14 marks
Outline the role that world cities play in the global economy.
Was this exam question helpful?
Exam code: 7037
Outline the role that world cities play in the global economy.
Was this exam question helpful?
Which of the following is a cause of counter-urbanisation?
Some inner-city areas have undergone gentrification, whereby people buy run-down properties and turn them into luxurious homes. This causes house prices to rise
New technology such as FaceTime and Google Meet allow people to work from home, enabling them to live a much greater distance from their place of work
The closure of coal mines meant that many miners’ families had to leave the pit villages. They moved to the local towns and cities, working in low-skilled jobs in retail parks
The local shops in many commuter villages are forced to close as the residents living in the new housing estates shop nearer to their places of work in the cities
Was this exam question helpful?
Choose the description that best fits the present global pattern of urbanisation.
The most urbanised regions include North America (82%), Latin America and the Caribbean (80%) and Europe (73%).
The fastest rate of urbanisation is found in Latin America which is projected to increase to 91% by 2030.
Growth is projected to rise fastest in North America and Europe, with just three countries accounting for most of the growth – UK, USA and Germany.
The most urbanised regions are Asia (82%), Africa (80%) and Latin America and the Caribbean (71%).
Was this exam question helpful?
Choose the correct definition for urbanisation from the list below.
The increasing number of people living in towns and cities
The increasing proportion of the population living in towns and cities
The movement of people from inner city areas into the suburbs
An increase in the number of megacities in a given region
Was this exam question helpful?
Which of the following describes the process of decentralisation?
It is now cheaper to manufacture steel in China due to the nearby availability of raw materials and large low-cost supply of labour. This has resulted in the closure of steel plants such as Tata Steel in Redcar.
In Notting Hill, individuals moved into large slum houses and began to redevelop them. House prices began to rise and landlords, realising they could make a quick profit, sold these houses to private property developers. There are also many boutiques and gastropubs in the area.
Decline in manufacturing in the UK has led to the rise of the service economy in urban areas. This has occurred due to the increased technology demands of a consumer society. As a result more people work in quaternary-based ICT industries than manufacturing.
In the UK, the government encouraged the relocation of government agencies and public bodies away from London. Examples include the DVLA relocating to Swansea and the BBC moving to Media City in Salford.
Was this exam question helpful?
Describe the processes that drive urbanisation in low- and middle-income countries.
Was this exam question helpful?
Outline the demographic processes associated with urban growth.
Was this exam question helpful?
Outline how the rise of the service economy has led to urban change.
Was this exam question helpful?
Outline characteristics of an area undergoing urban resurgence.
Was this exam question helpful?
Analyse changes in the world pattern of urbanisation shown in Figure 7 and Figure 8.
Figure 7 - 1990–2015

Figure 8 - 2015–2030

Was this exam question helpful?
Assess the extent to which counter-urbanisation leads to social and economic change.
Was this exam question helpful?
Assess the role of technological processes leading to the growing number of global megacities.
Was this exam question helpful?
Using Figure 2 and your own knowledge, explain the economic and social outcomes of urban regeneration in a city you have studied.
Figure 2: Selected indicators of the London Docklands before and after LDDC regeneration
Indicator | 1981 (before LDDC) | 1998 (LDDC winds up) |
|---|---|---|
Unemployment rate (%) | 24 | 7 |
Derelict land (hectares) | 2,000 | 180 |
New homes built | 0 | 24,000 |
Private investment attracted (£bn) | 0 | 7.7 |
Commercial floor space (million m²) | 0.1 | 2.3 |
Source: London Docklands Development Corporation Annual Report, 1998.
Was this exam question helpful?
Figures 5a and 5b show OS map extracts for the dockland area in East London in 1974 and 2016.
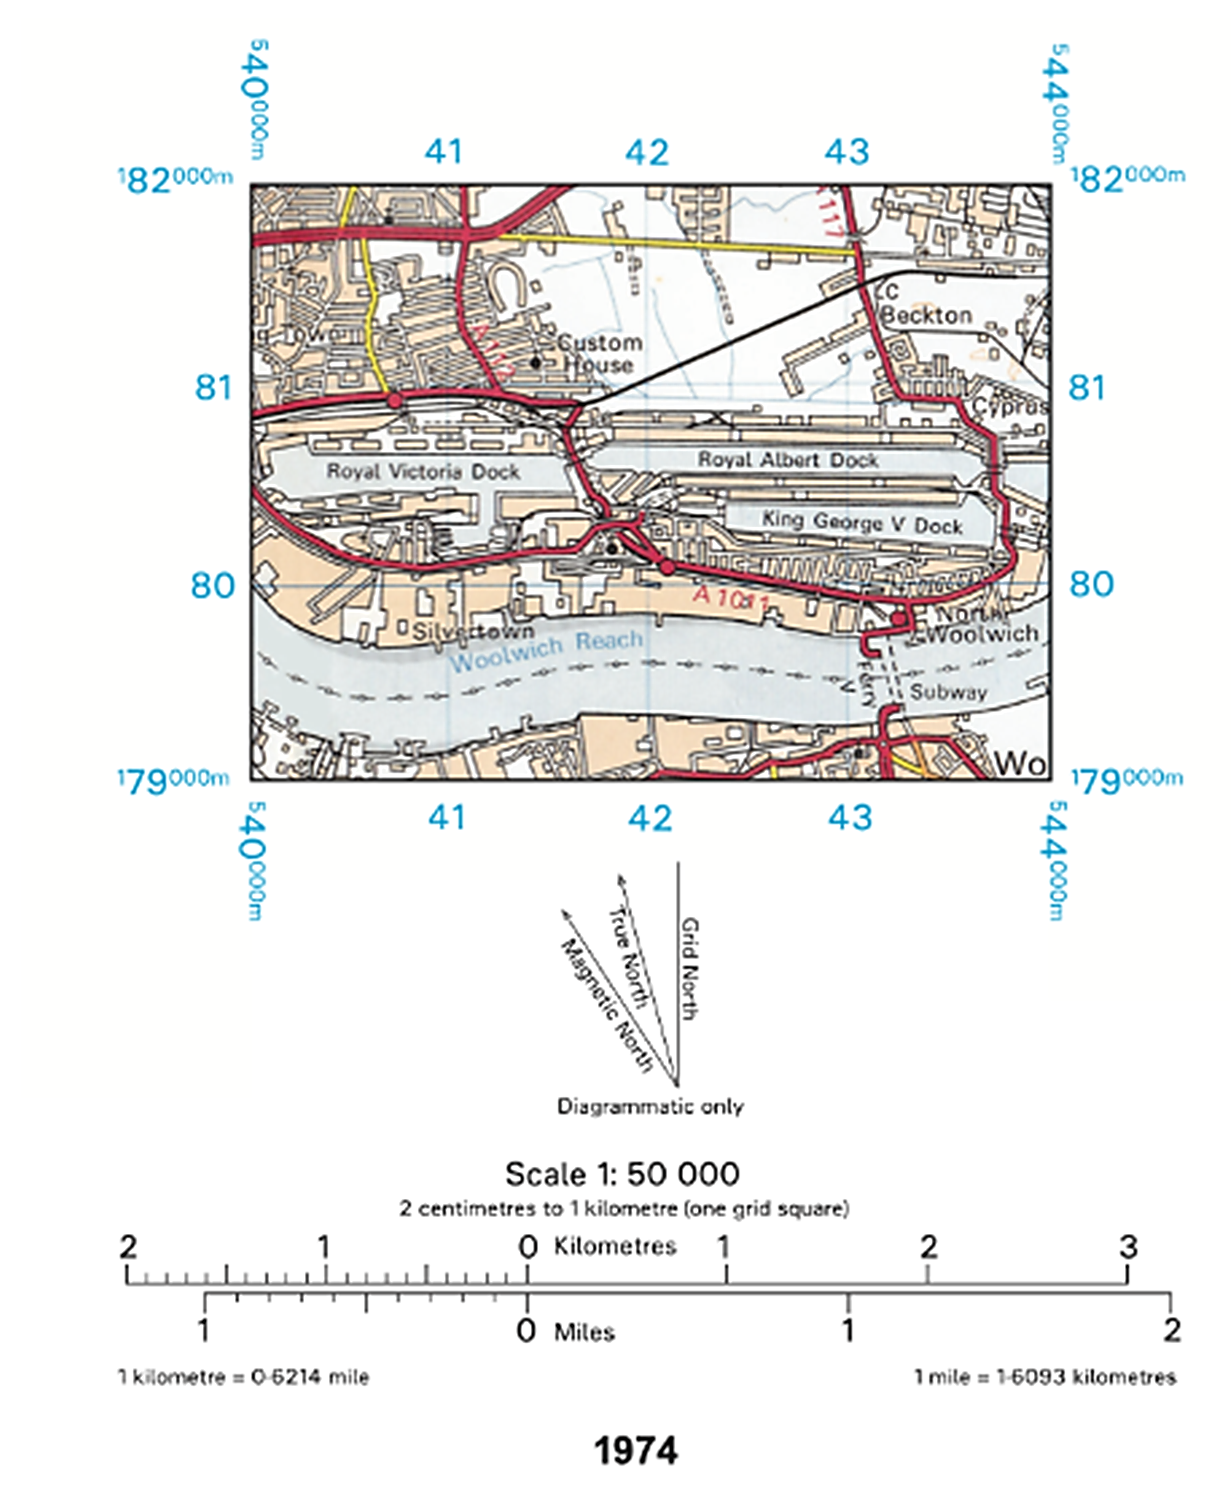
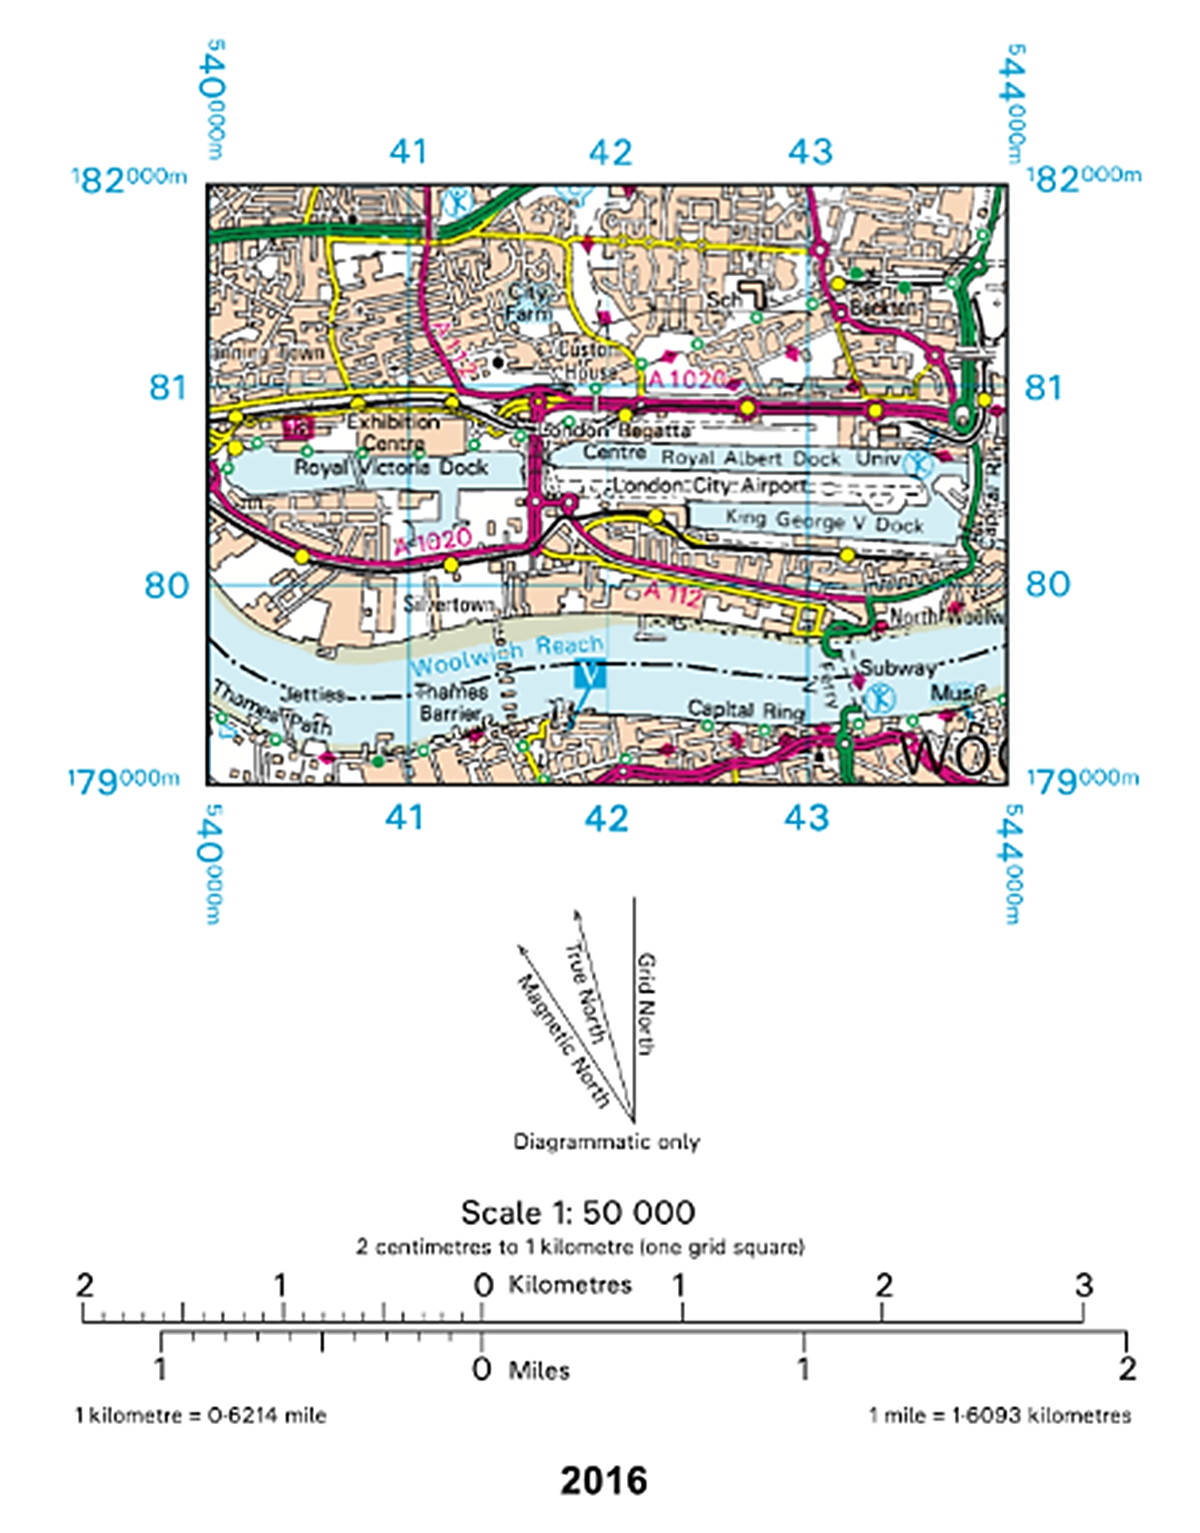
Analyse the changes shown.
Was this exam question helpful?
Figure 5 is in the insert. Figure 5 shows the GDP per capita and the percentage of total population living in urban areas in selected countries in 2016.
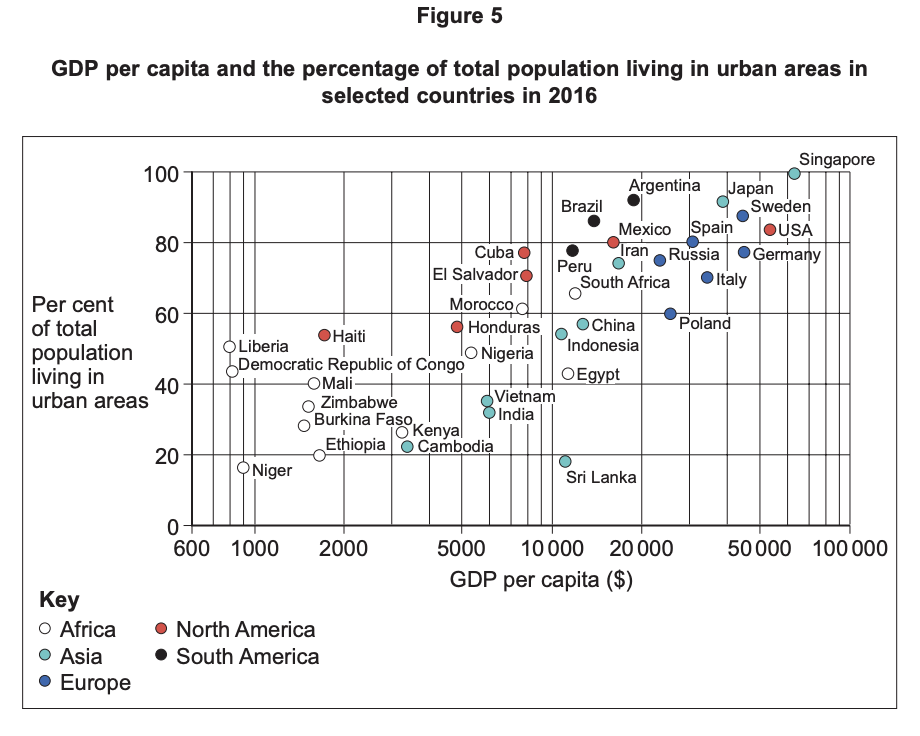
Analyse the data shown in Figure 5.
Was this exam question helpful?
‘Britain’s urban regeneration policies since 1979 have failed to address problems of economic inequality and social segregation. The gap between the richest and the poorest urban residents has widened.’
To what extent do you agree with this statement?
Was this exam question helpful?
Assess the view that the rapid growth of megacities creates more problems than benefits.
Was this exam question helpful?
Assess the extent to which the process of urbanisation differs between lower-income and higher-income countries.
Was this exam question helpful?