Motion Graphs (Cambridge (CIE) A Level Physics): Revision Note
Exam code: 9702

Motion graphs
There are five types of graph that can represent motion
Distance-time graphs
On a distance-time graph…
slope equals speed
the y-intercept equals the initial position
a straight (diagonal) line represents a constant speed
a curved line represents an acceleration
the slope is always zero or positive because distance is a scalar quantity
a zero slope (horizontal line) represents a state of rest
the area under the curve is meaningless
Displacement-time graphs
On a displacement-time graph…
slope equals velocity
the y-intercept equals the initial position
a straight (diagonal) line represents a constant velocity
a curved line represents an acceleration
a positive slope represents motion in the positive direction
a negative slope represents motion in the negative direction
a zero slope (horizontal line) represents a state of rest
the area under the curve is meaningless
Displacement-time graphs for different scenarios
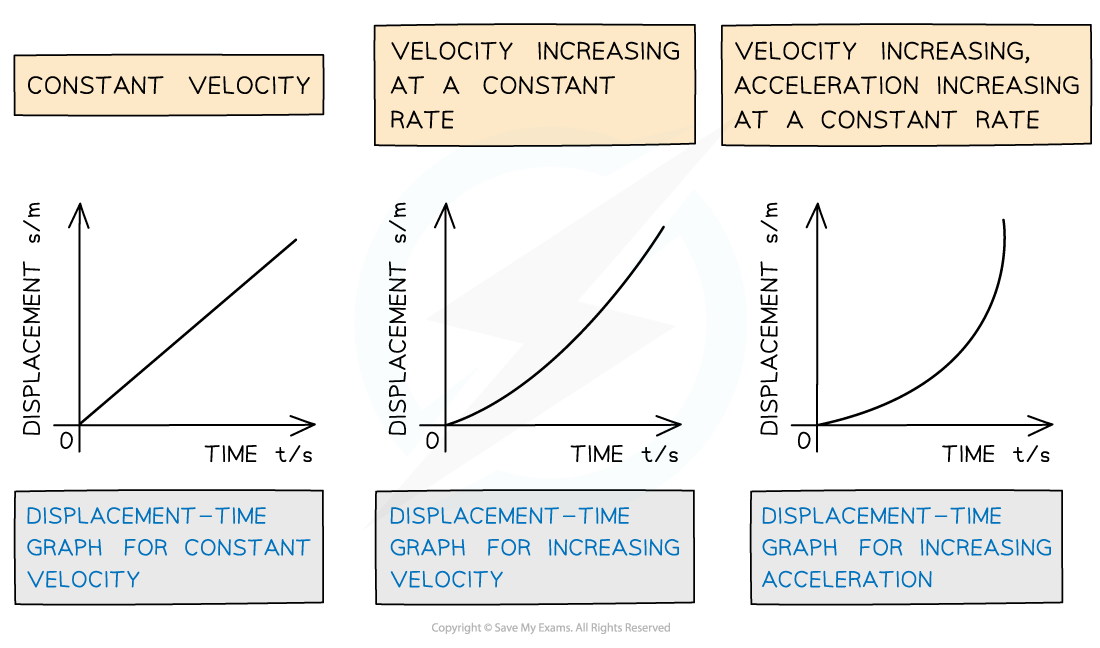
The displacement-time graph for constant velocity is a straight diagonal line, and for acceleration is a curve
Speed-time graphs
On a speed-time graph…
slope equals acceleration
the y-intercept equals the initial speed
a straight line represents uniform acceleration
a curved line represents non-uniform acceleration
a positive slope represents an increase in speed
a negative slope represents a decrease in speed
a zero slope (horizontal line) represents motion with constant speed
the area under the curve equals the distance travelled
Velocity-time graphs
On a velocity-time graph…
slope equals acceleration
the y-intercept equals the initial velocity
a straight line represents uniform acceleration
a curved line represents non-uniform acceleration
a positive slope represents an increase in velocity in the positive direction
a negative slope represents an increase in velocity in the negative direction
a zero slope (horizontal line) represents motion with constant velocity
the area under the curve equals the displacement
Velocity-time graphs for different scenarios
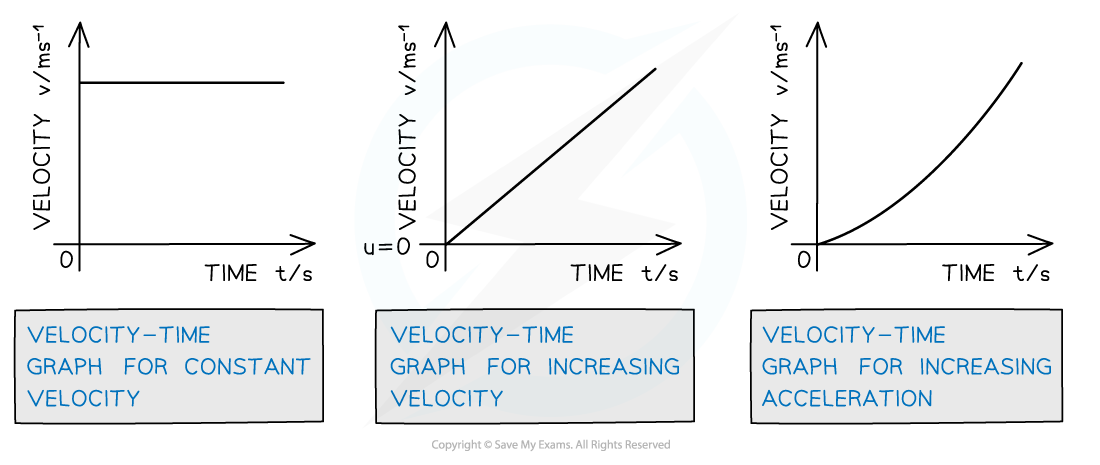
The velocity-time graph for constant velocity is a straight horizontal line, for acceleration is a straight diagonal line and for increasing acceleration is a curve
Acceleration-time graphs
On an acceleration-time graph…
slope is meaningless
the y-intercept equals the initial acceleration
a zero slope (horizontal line) represents an object undergoing constant acceleration
the area under the curve equals the change in velocity
Acceleration-time graph for different scenarios
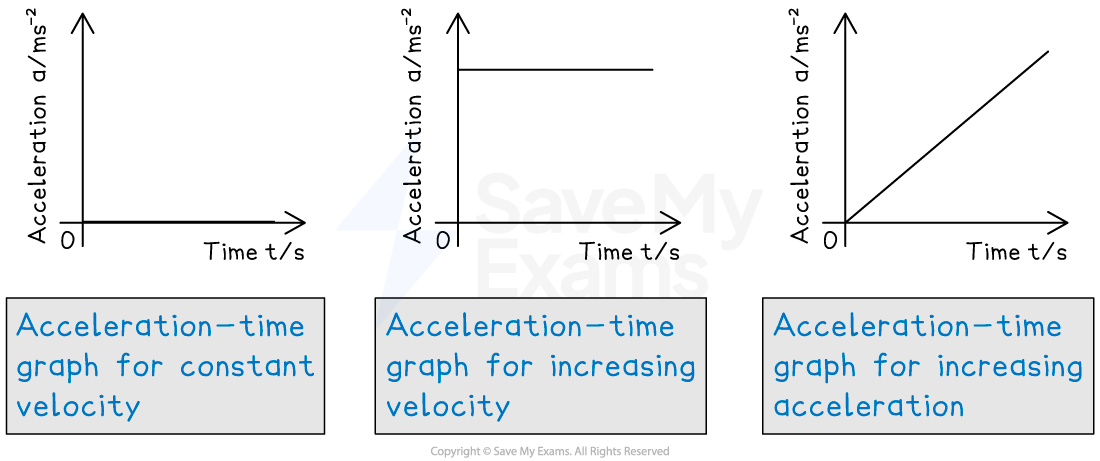
The acceleration-time graph for constant velocity is blank, for increasing velocity is a straight horizontal line and for increasing acceleration is a straight diagonal line
Examiner Tips and Tricks
Always check the axes when dealing with graphs. The differences between distance-time graphs and displacement-time graphs, and speed-time graphs and velocity-time graphs are subtle but important. Make sure you know what you are looking at before answering any graph questions in the exam.

Unlock more, it's free!
Join the 100,000+ Students that ❤️ Save My Exams
the (exam) results speak for themselves:

Was this revision note helpful?
Build on this topic