1
3 marks
Find the finite area bounded by the -axis and the graph of .
Was this exam question helpful?
Find the finite area bounded by the -axis and the graph of .
Was this exam question helpful?
Let be the region enclosed by the graphs of and, the -axis, and the vertical line , as shown in the figure below.
Find the area of .

Was this exam question helpful?
Let be the region in the first quadrant bounded by the -axis and the graphs of and , as shown in the figure below.
Find the area of region .

Was this exam question helpful?
Let be the shaded region bounded by the graphs of , and the vertical line , as shown in the figure below.
Find the area of .

Was this exam question helpful?
Find the exact total area enclosed by the graph of , the line , and the -axis.
Was this exam question helpful?
What information does provide about the graph of the function ?
Was this exam question helpful?
Figures 1 and 2 illustrate regions in the first quadrant associated with the graphs of and , respectively. In Figure 1, let be the region bounded by the graph of , the -axis, and the vertical lines and . In Figure 2, let be the unbounded region between the graph of and the -axis that lies to the right of the vertical line .
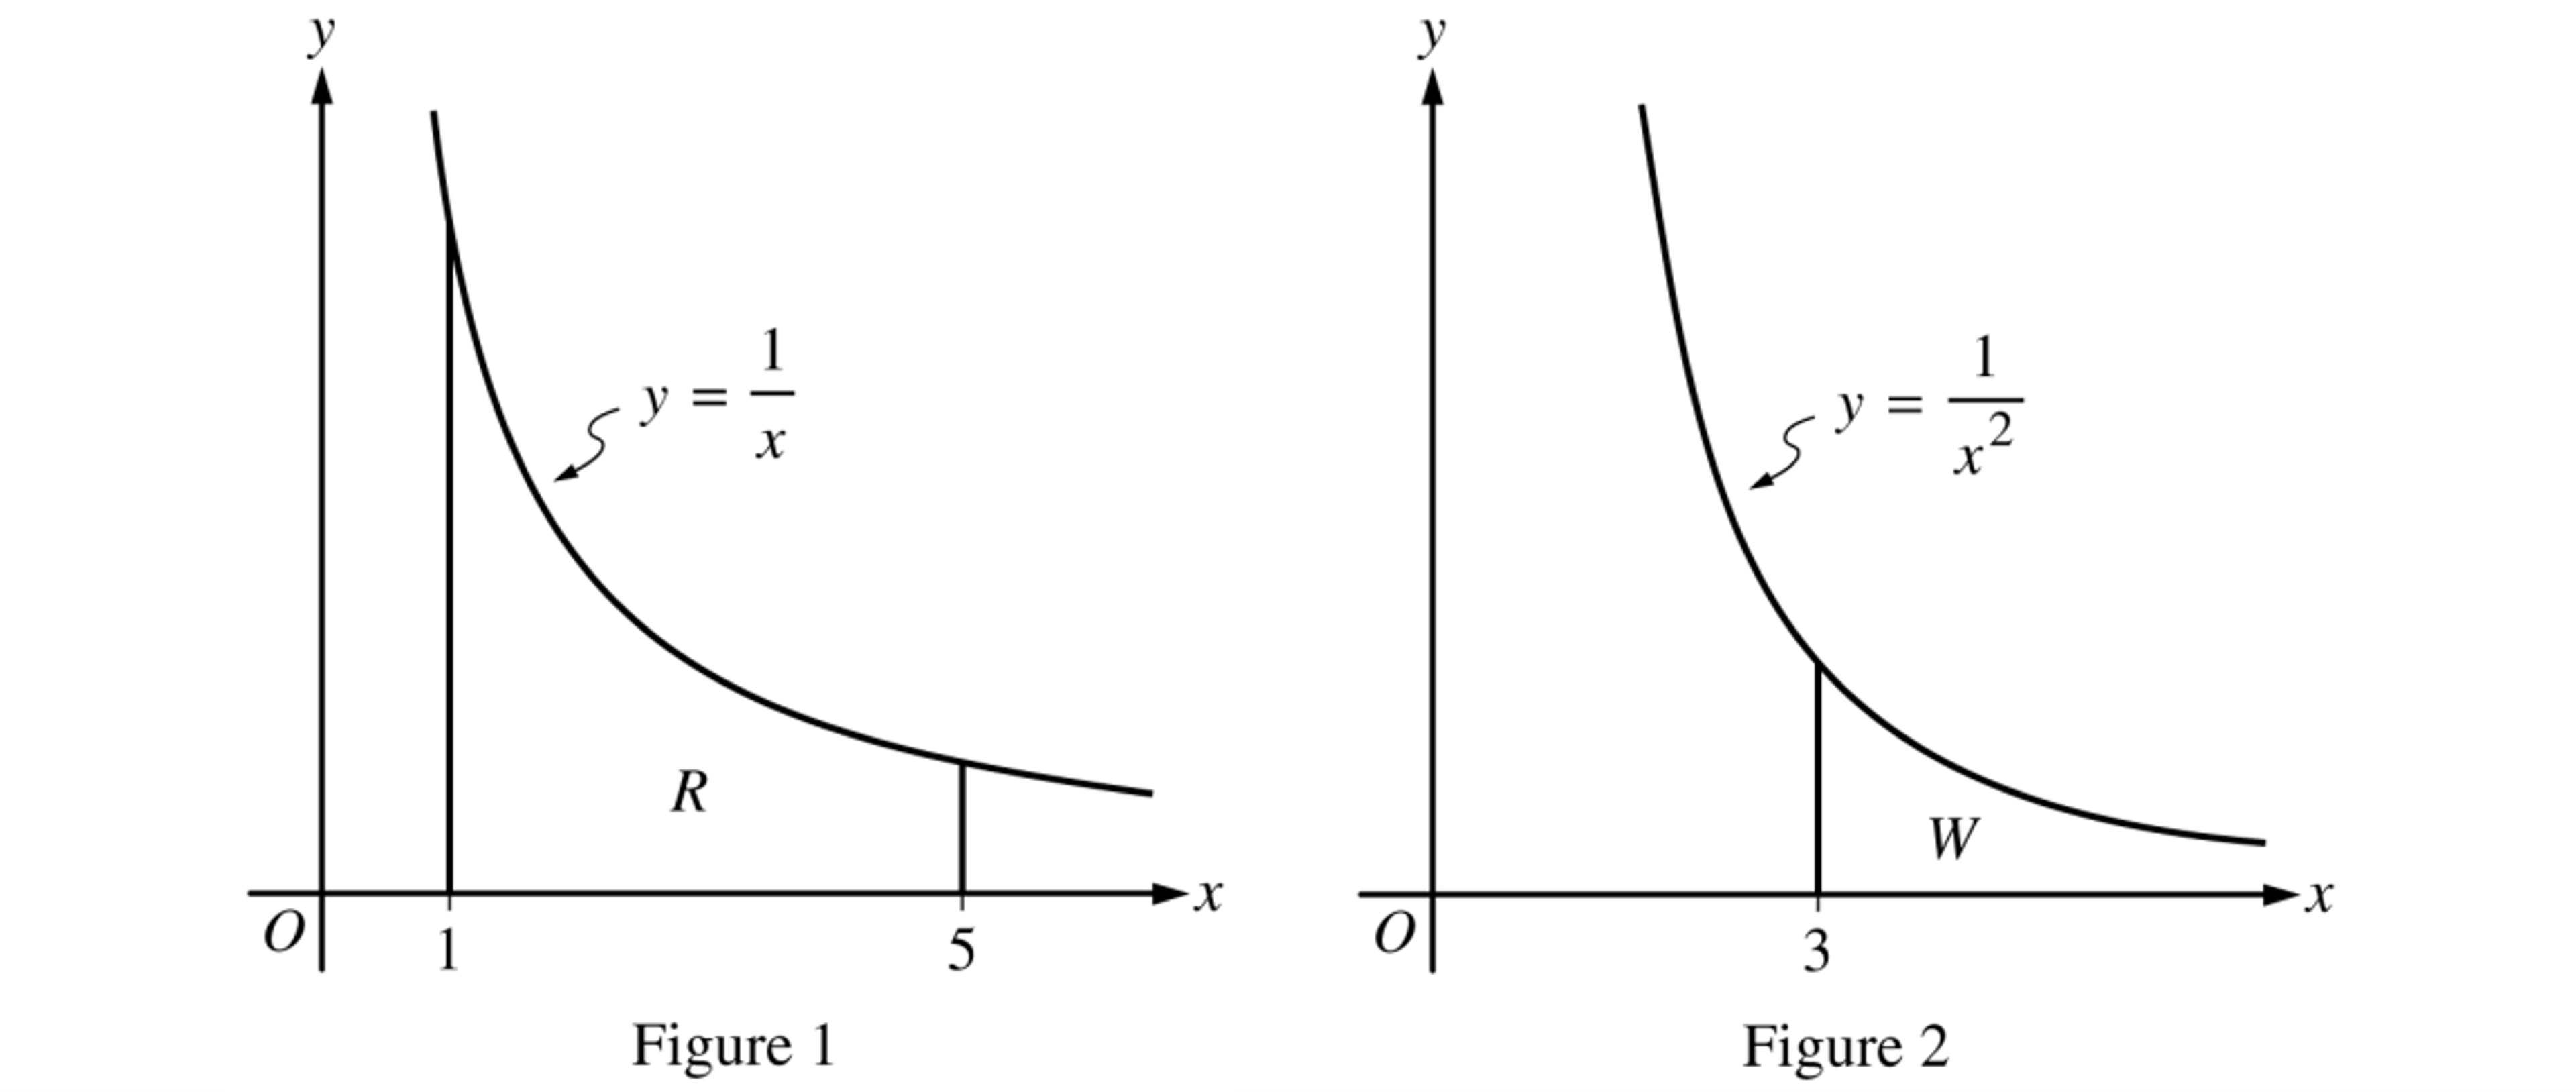
Find the area of region .
Was this exam question helpful?

Let and be the functions defined by and . The graphs of and , shown in the figure above, intersect at and where and .
Find the area of the region enclosed by the graphs of and .
Was this exam question helpful?

The graph of the family of functions for , where is a positive constant, has the general shape shown in the figure above.
Find the area of the region in the first quadrant bounded by the -axis and the graph of for .
Was this exam question helpful?

The region is bounded by the curves with equations and . Find the area of .
Was this exam question helpful?
Let and be the regions bounded by the graphs of and between and , as shown below.
Find the sum of the areas of the regions and , writing your answer in an exact form.

Was this exam question helpful?
Function is given by . Find the area of the region bounded by , the -axis, and the vertical lines and . The graph of and the the two vertical lines are shown below.
Write your answer in an exact form.

Was this exam question helpful?
Find the length of the curve on the interval where .
Was this exam question helpful?
The shaded region is bounded by the graphs of the functions and , where and , as shown in the figure.
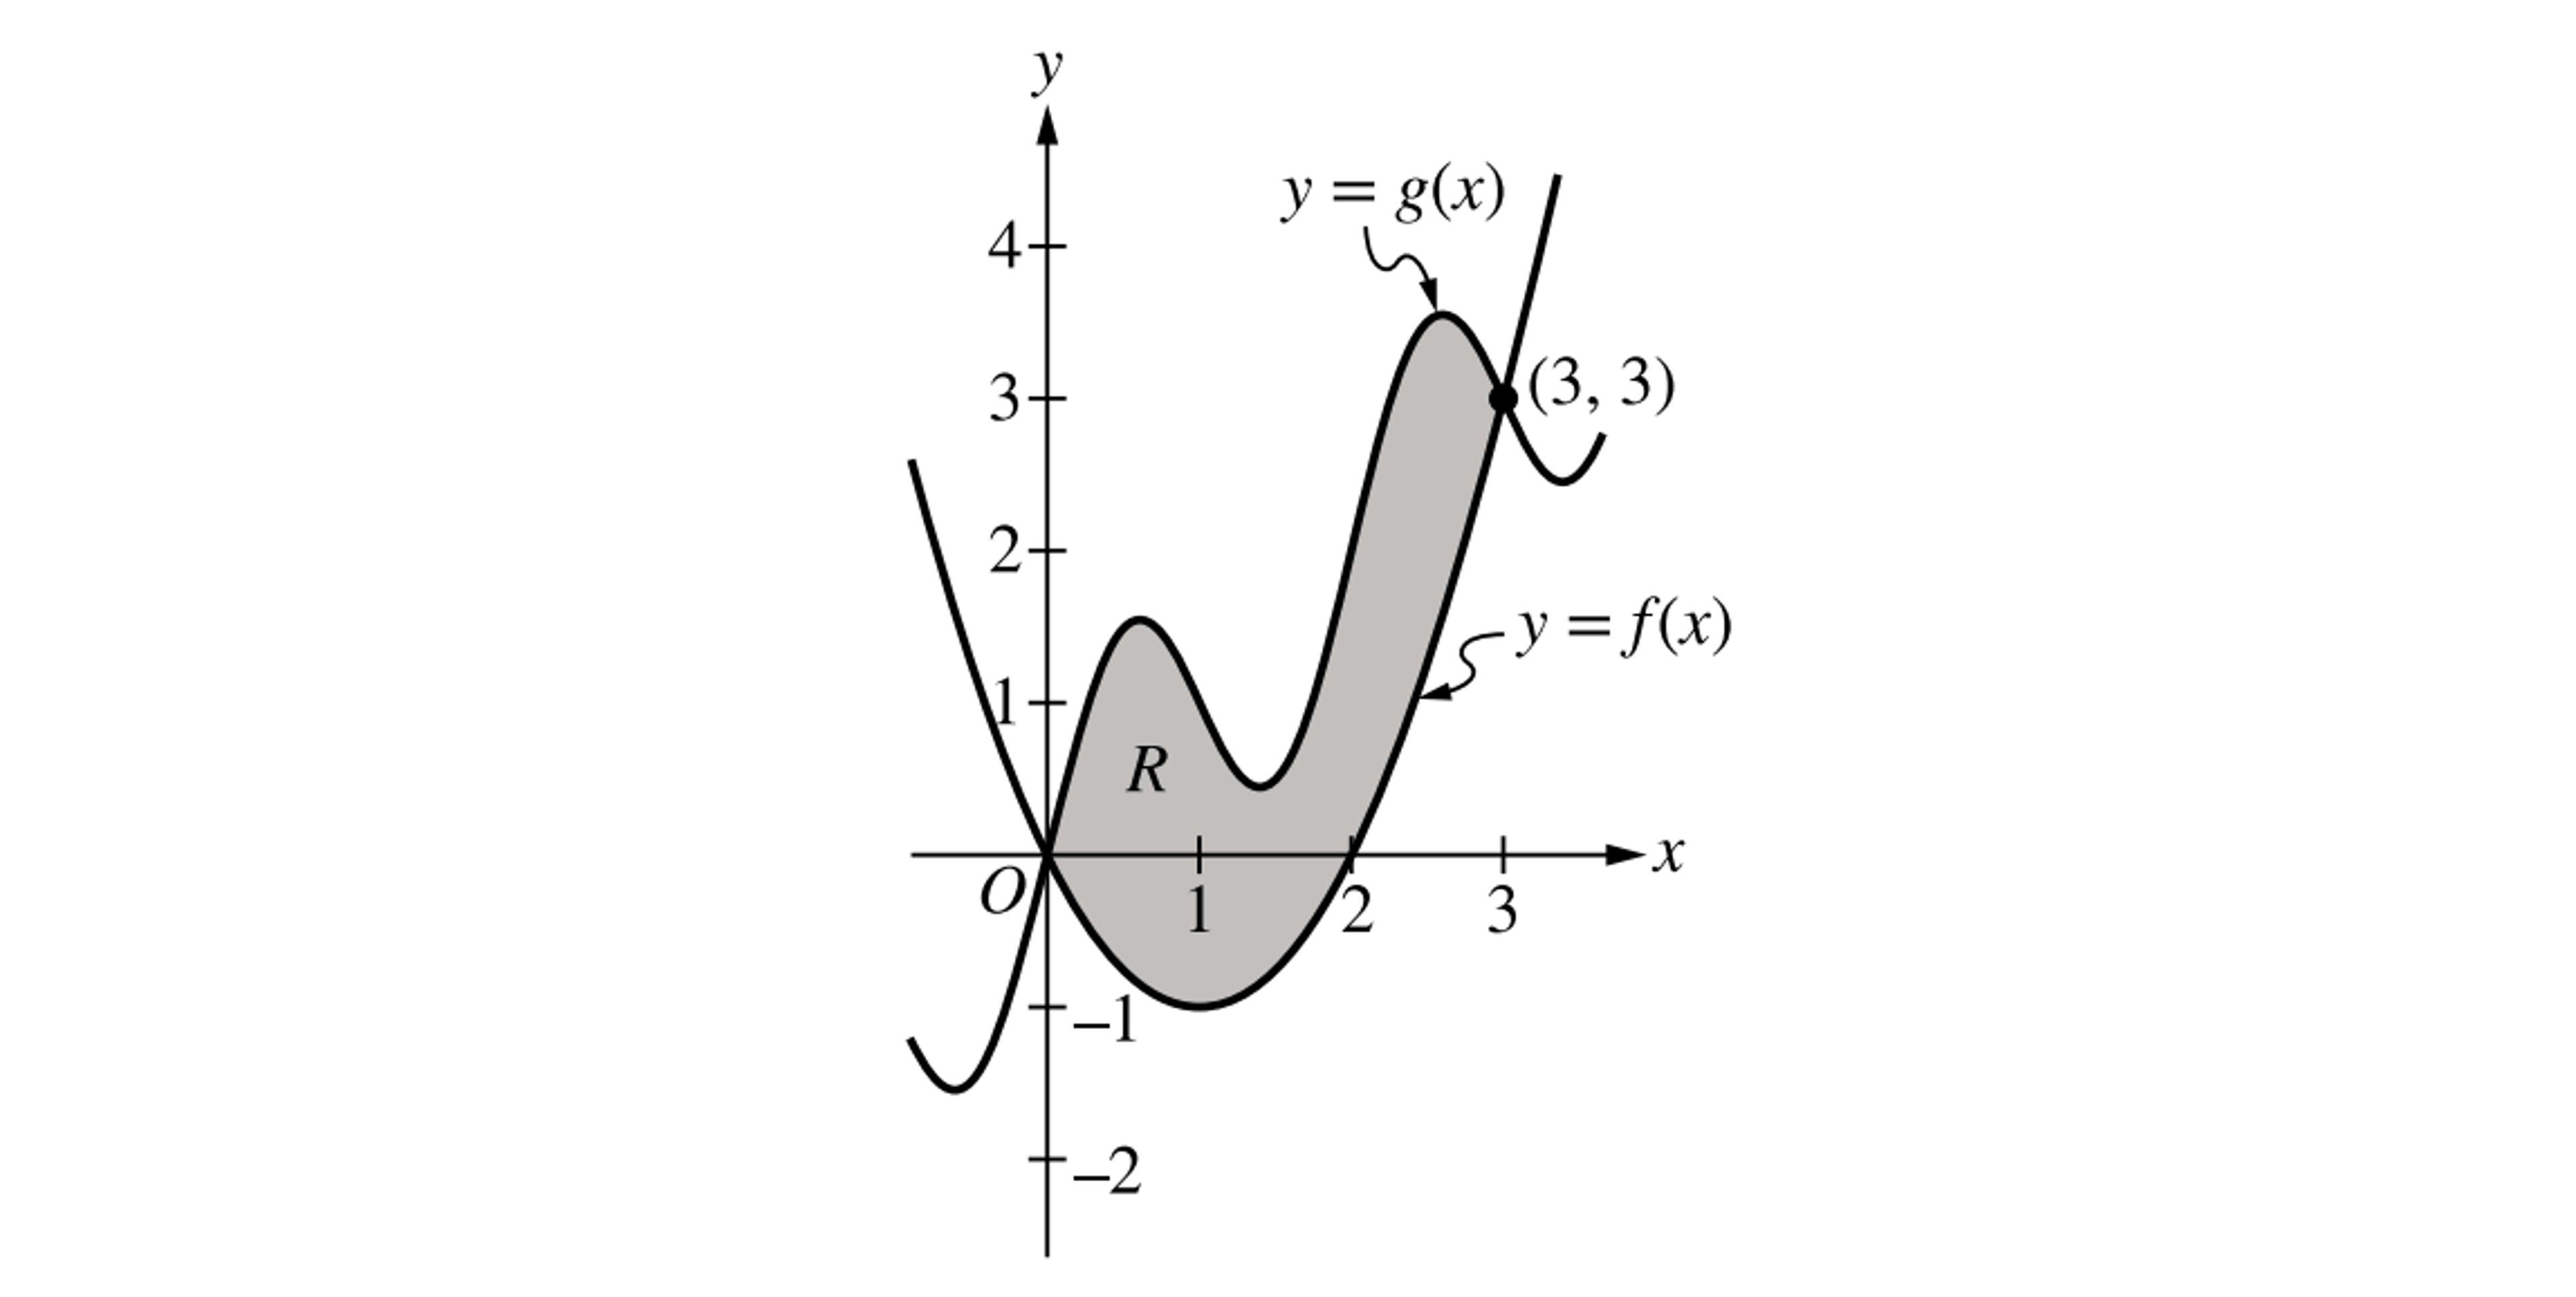
(Note: Your calculator should be in radian mode.)
Find the area of . Show the setup for your calculations.
Was this exam question helpful?
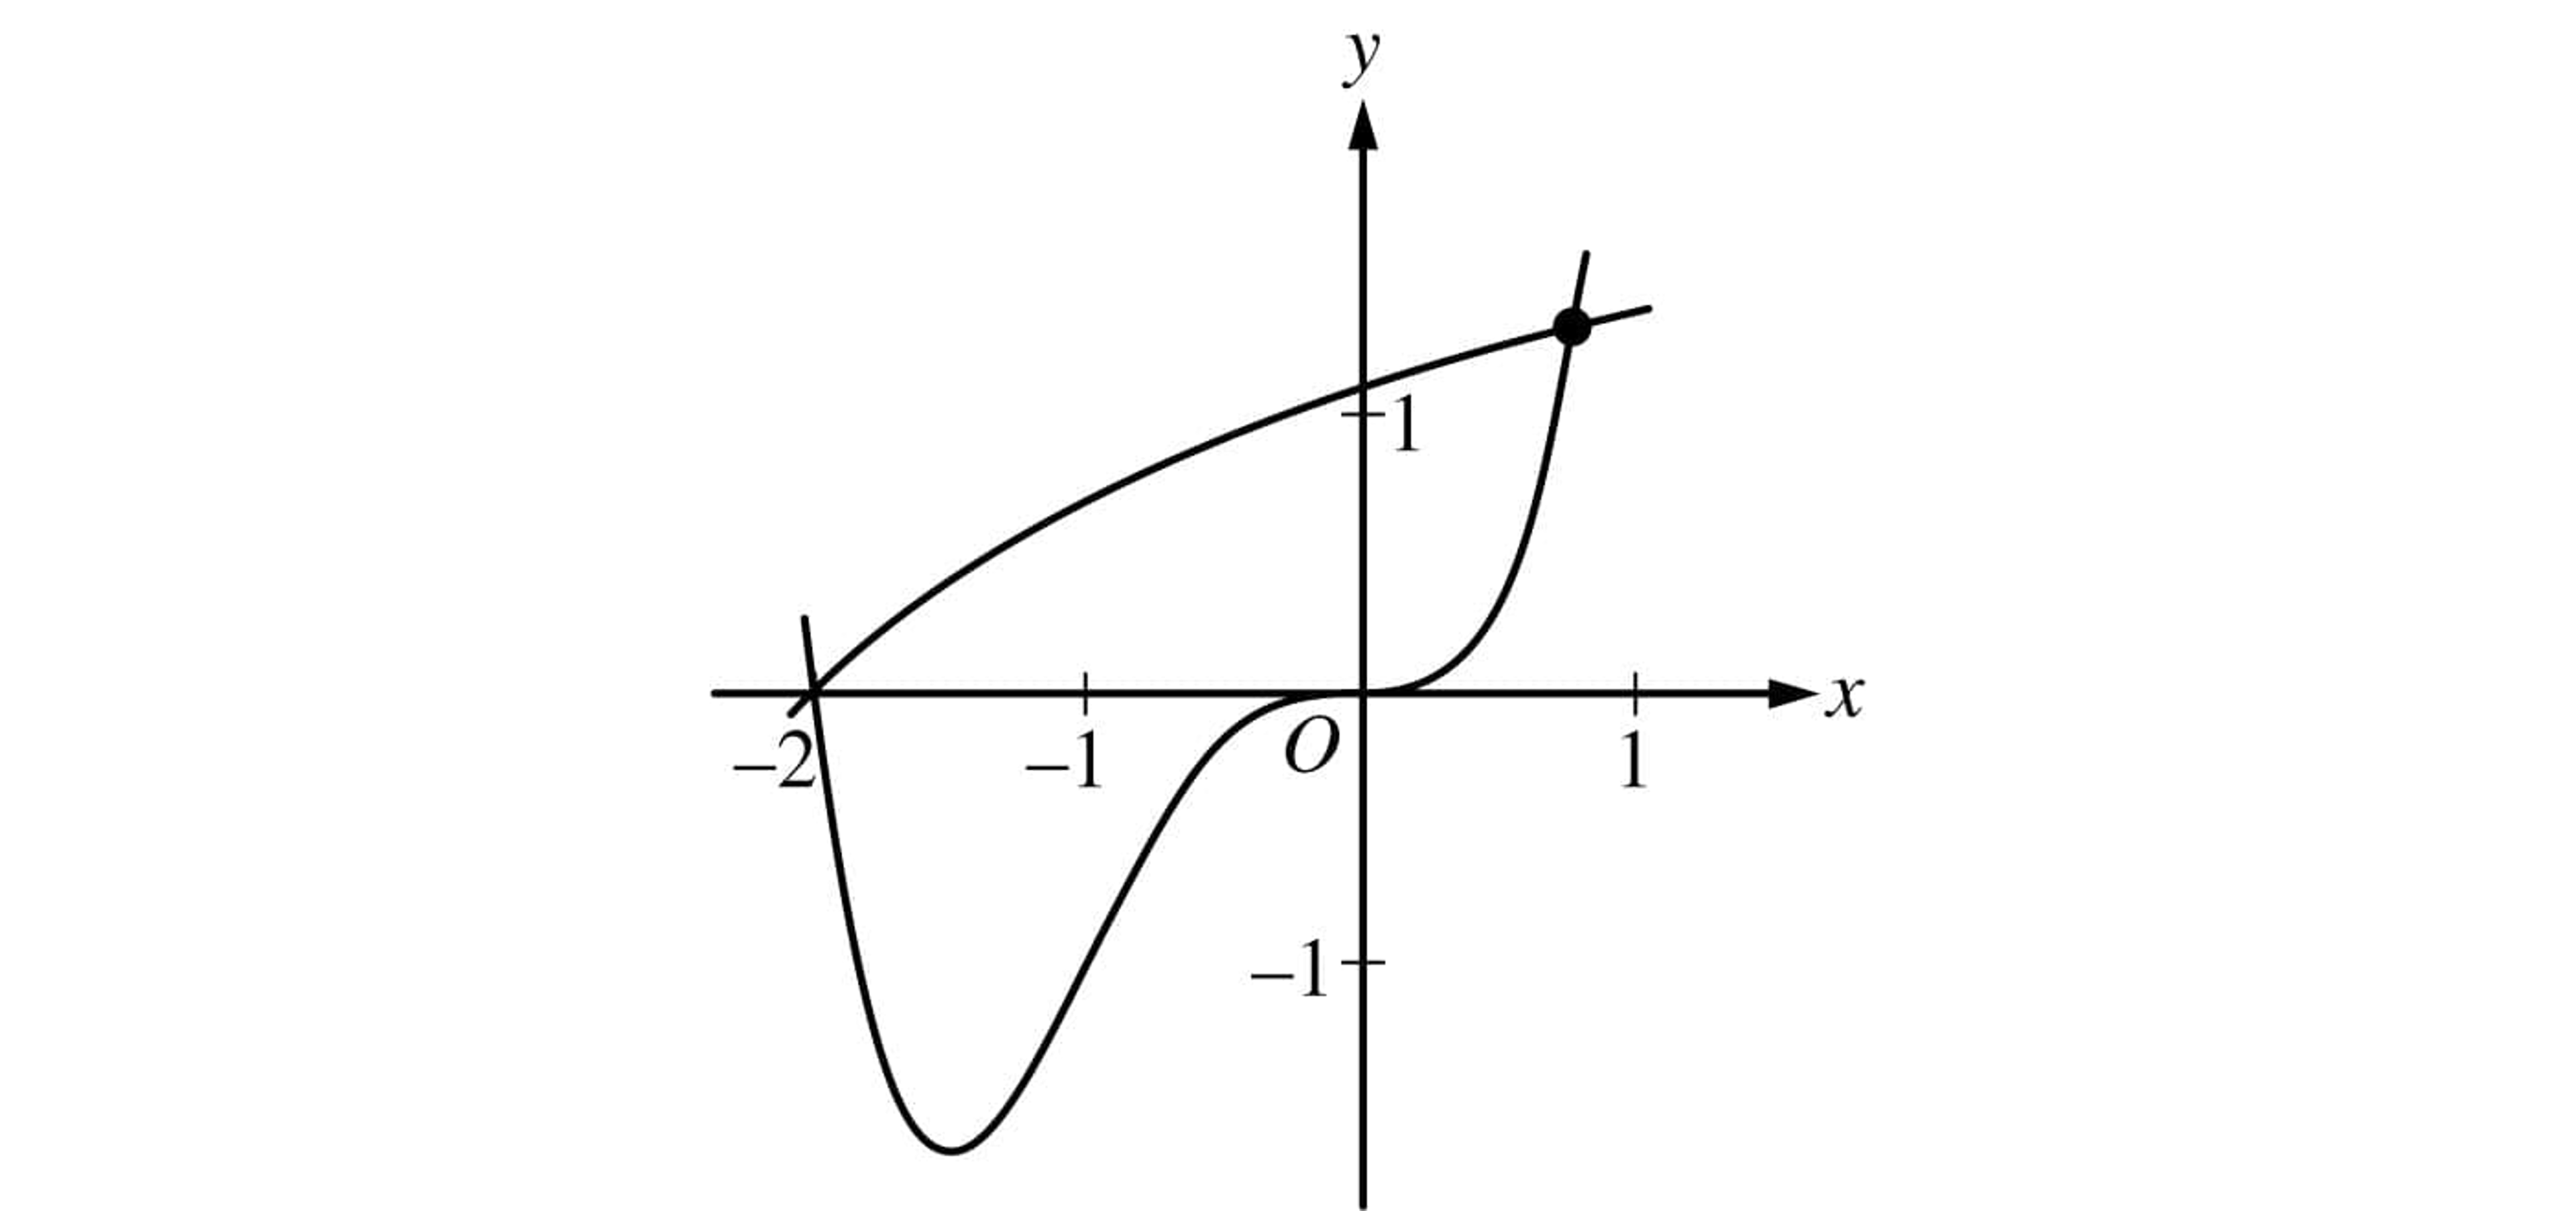
Let and be the functions defined by and . The graphs of and , shown in the figure above, intersect at and , where .
Find the area of the region enclosed by the graphs of and .
Was this exam question helpful?
The functions and are defined by and , as shown in the graph.
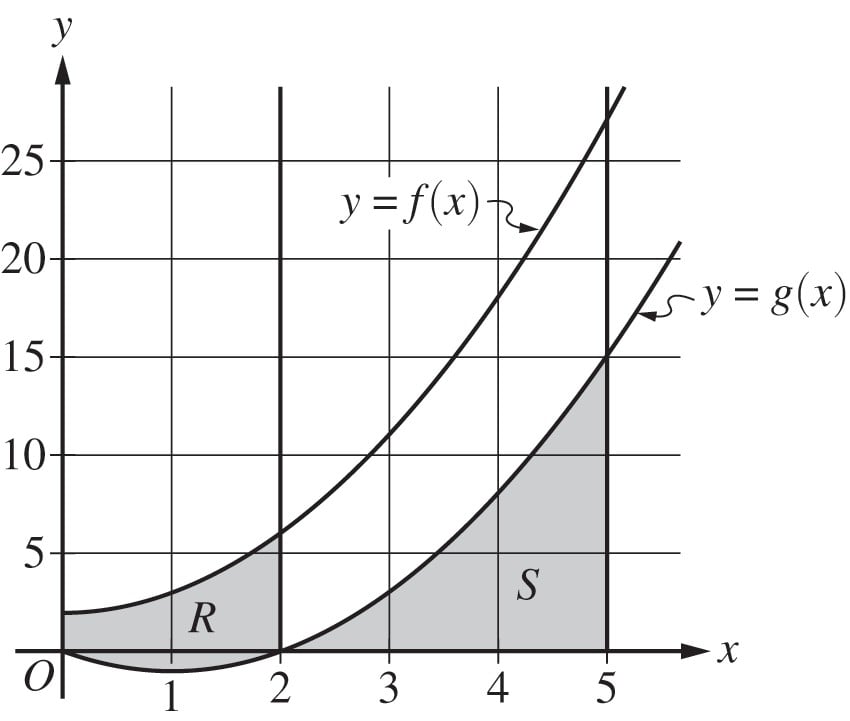
Let be the region bounded by the graphs of and , from to , as shown in the graph. Write, but do not evaluate, an integral expression that gives the area of region .
Was this exam question helpful?
The graphs of the functions and are shown in the figure for . It is known that for . The twice-differentiable function , which is not explicitly given, satisfies and .
![The shaded region enclosed by y = f(x) (the upper curve) and y = g(x) (the lower curve) from (0, 4) to (3, 2) in the xy-plane]](https://cdn.savemyexams.com/cdn-cgi/image/f=auto,width=3840/https://cdn.savemyexams.com/uploads/2026/06/13878-ap-calc-bc-2023-q5a.png)
Find the area of the shaded region enclosed by the graphs of and .
Was this exam question helpful?
The function is twice differentiable for all with . Values of , the derivative of , are given in the table for selected values of .
For , the function is defined by . Find the value of . Show the work that leads to your answer.
What information does provide about the graph of ?
Was this exam question helpful?

Let and be the functions defined by and . Let and be the two regions enclosed by the graphs of and shown in the figure above. Points and are the intersections of the two graphs.
Find the sum of the areas of regions and .
Was this exam question helpful?
Let be the region in the first quadrant bounded by the -axis and the graphs of and , as shown in the figure below.
The horizontal line divides into two regions of equal area. Write an equation involving one or more integrals whose solution allows the value of to be found. You do not need to solve the equation.
Was this exam question helpful?
Find the exact area of the region enclosed by the graph of , the -axis, and the line .
Write your answer in the form where and are positive integers and and are positive rational numbers to be found.
Was this exam question helpful?
The graph below shows the functions and .
Find the area of the shaded region.

Was this exam question helpful?
The graph below shows the functions and .
One of the points of intersection of and is at .
Find the ratio of the areas in the form where and are integers.

Was this exam question helpful?
Find, in terms of , the arc length of the curve on the interval where .
Was this exam question helpful?
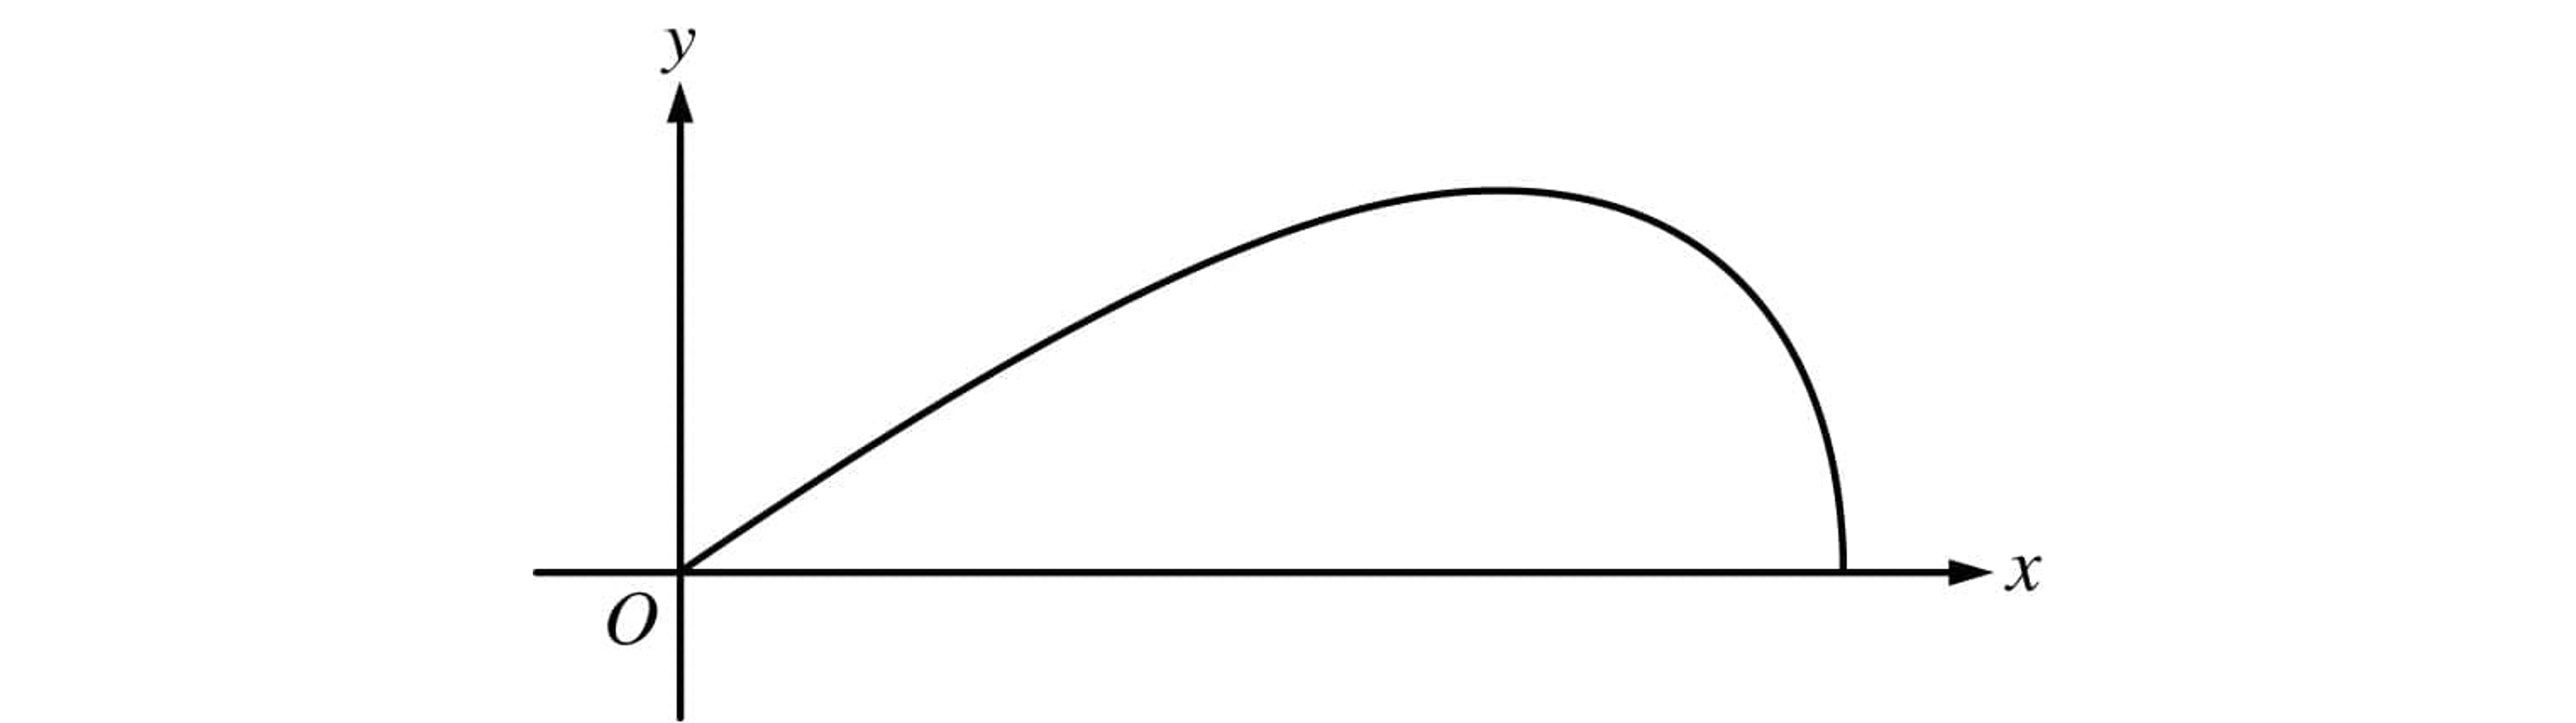
A company designs spinning toys using the family of functions , where is a positive constant. The figure above shows the region in the first quadrant bounded by the -axis and the graph of , for some . Each spinning toy is in the shape of the solid generated when such a region is revolved about the -axis. Both and are measured in inches.
Find the area of the region in the first quadrant bounded by the -axis and the graph of for .
Was this exam question helpful?
Let be the region enclosed by the graphs of and , the -axis, and the vertical line , as shown in the figure below.
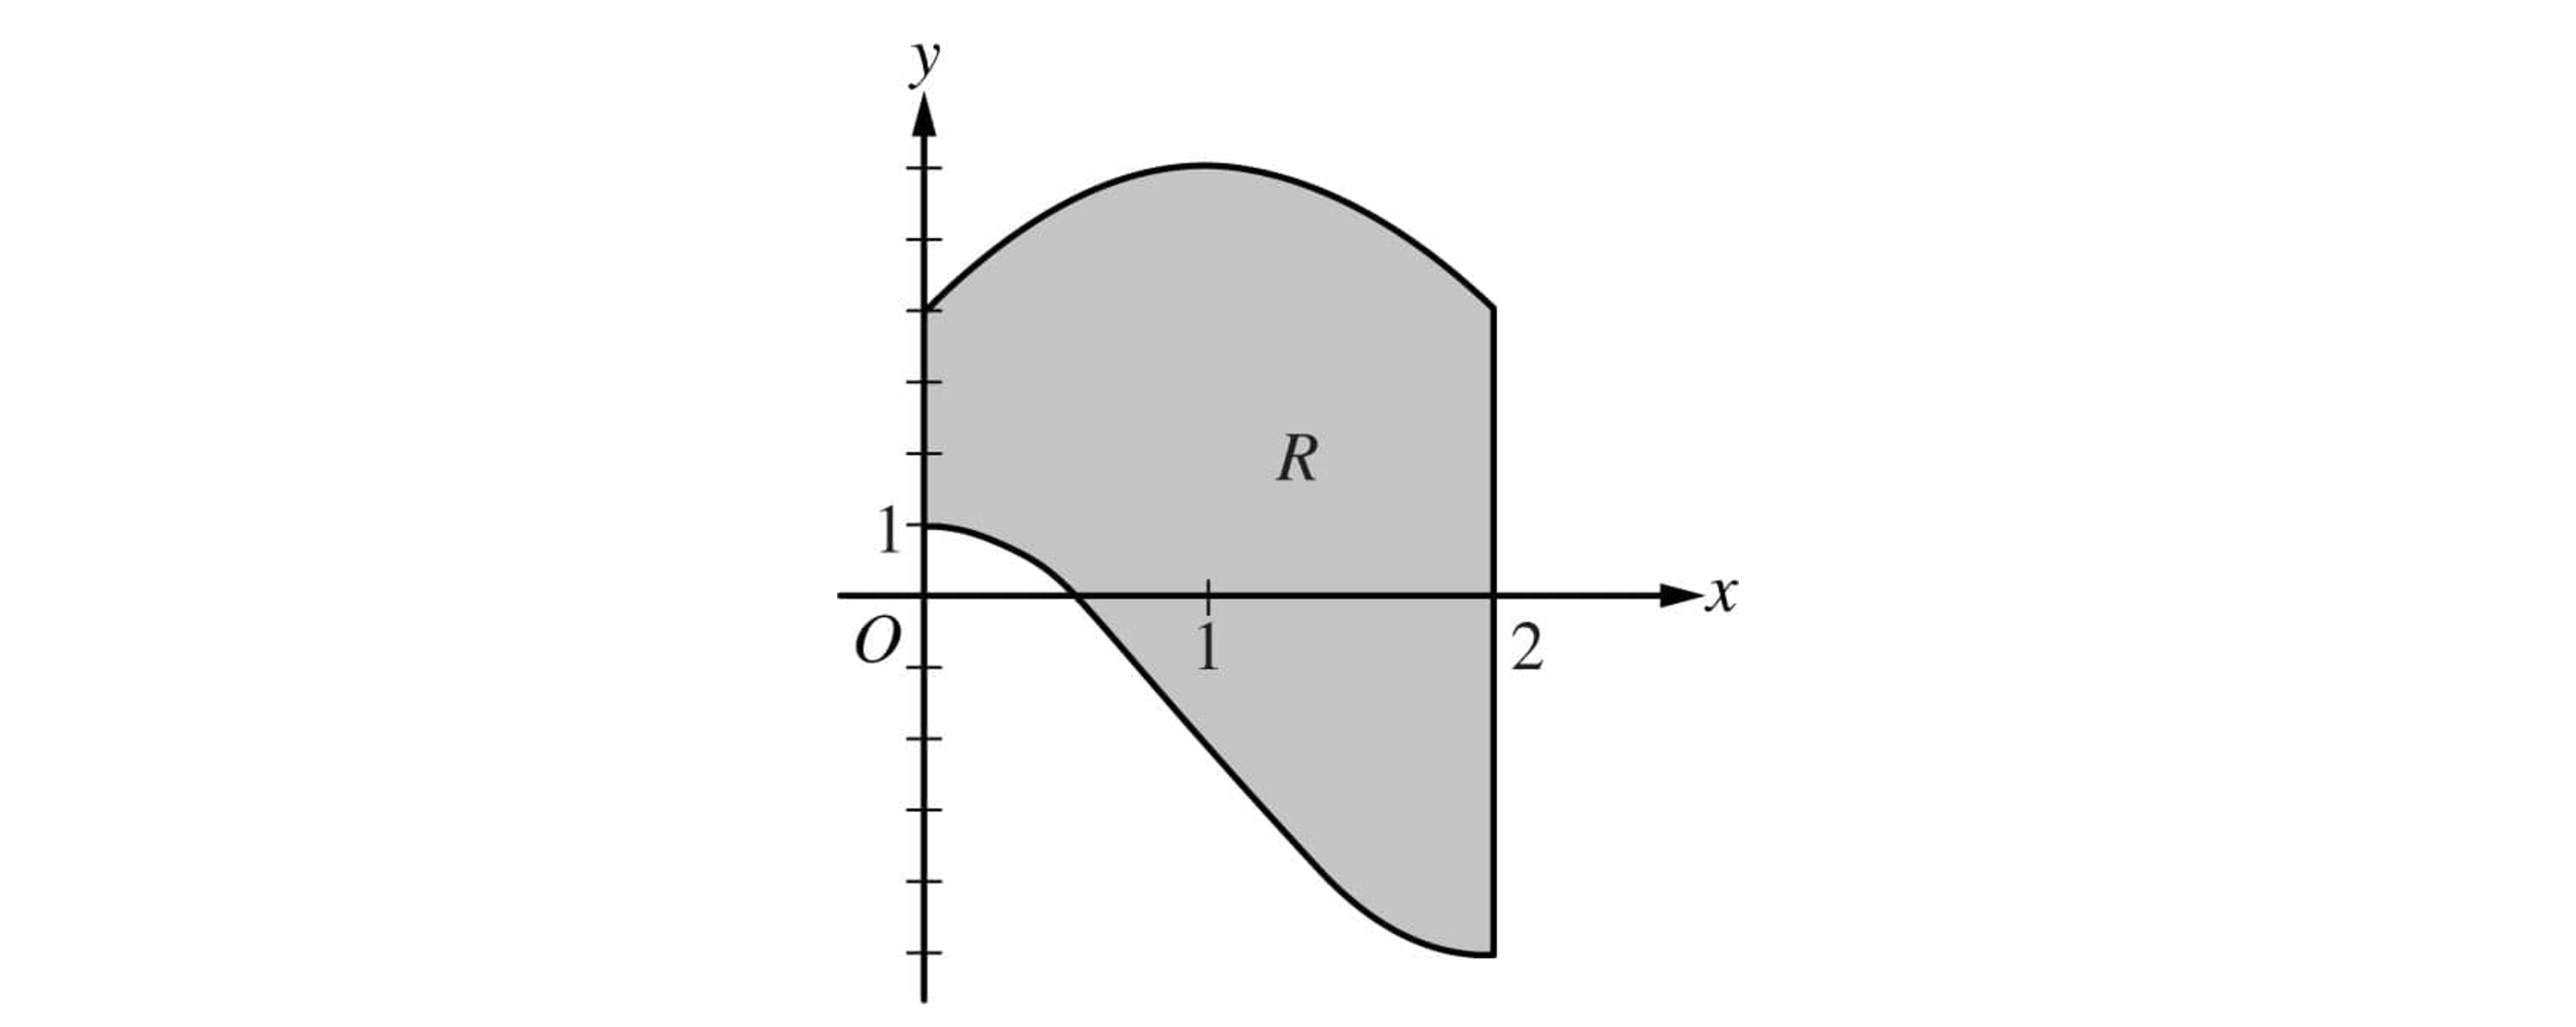
Find the area of .
Was this exam question helpful?