Markets (Edexcel A Level Business): Revision Note
Exam code: 9BS0

The interaction of supply and demand
In a market, prices for goods/services are determined by the interaction of demand and supply
A market is any place that brings buyers and sellers together to trade at an agreed price
Markets can be physical (e.g. McDonald's) or virtual (e.g. eBay)
Buyers agree on the price by purchasing the good/service
If they do not agree on the price, then they do not purchase the good/service
Based on this interaction with buyers, sellers will gradually adjust their prices until there is an equilibrium price and quantity that works for both parties
At the equilibrium price, sellers will be satisfied with the rate/quantity of sales
At the equilibrium price, buyers are satisfied that the product provides benefits worth paying for
Equilibrium
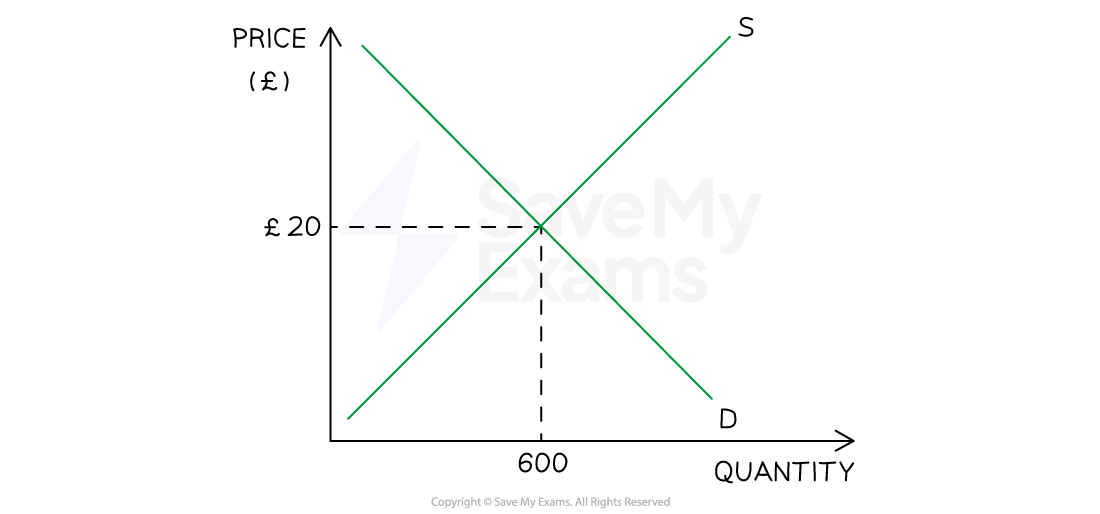
Diagram analysis
If the price is set at £20, demand will equal supply, and an equilibrium is reached
600 units will be demanded and supplied
If the price were set above the equilibrium, supply would be greater than demand, and there would be a surplus
If the price were set below the equilibrium, demand would be greater than supply, and there would be a shortage
Dynamic changes in markets
There are four diagrams that can be used to show the causes and consequences of changes to the non-price factors of demand and supply
The impact of changes to the non-price factors of demand and supply
A rise in demand
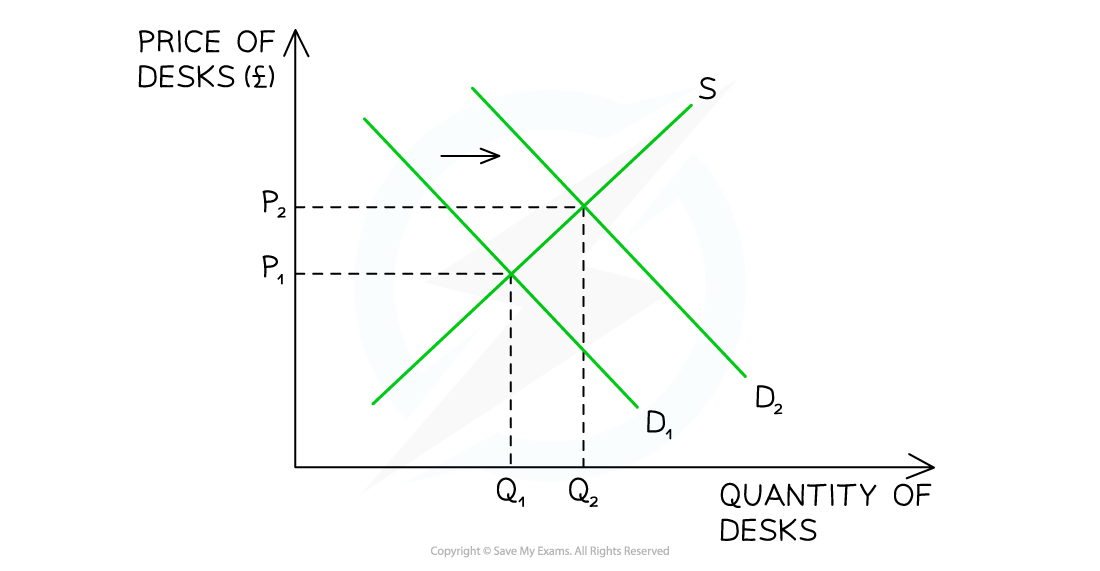
Explanation
The original equilibrium was at P1 and Q1
A rise in demand causes the demand curve to shift to the right from D1→ D2 (perhaps due to an increase in working from home)
At the original price of P1, there is now a shortage, as demand exceeds the supply
The shortage causes prices to rise from P1 to P2
A new equilibrium develops at a price of P2 and a quantity of Q2 units
The business revenue (P × Q) has changed from P1Q1 to P2Q2
A fall in demand

Explanation
The original equilibrium was at P1 and Q1
A fall in demand causes the demand curve to shift to the left from D1→D2 (perhaps due to an external shock)
At the original price of P1, there is now a surplus, as supply exceeds demand
The surplus causes prices to fall from P1 to P2
A new equilibrium develops at a price of P2 and a quantity of Q2 units
The business revenue (P × Q) has changed from P1Q1 to P2Q2
A rise in supply
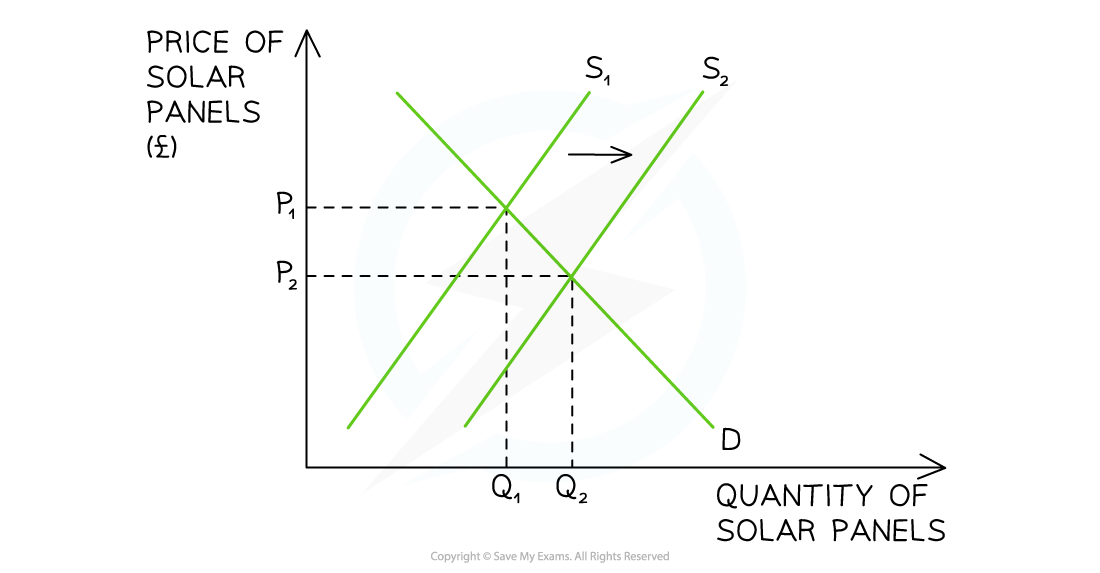
Explanation
The original equilibrium was at P1 and Q1
A rise in supply causes the supply curve to shift to the right from S1→S2 (perhaps due to an increase in productivity)
At the original price of P1, there is now a surplus, as supply exceeds demand
The surplus causes prices to fall from P1 to P2
A new equilibrium develops at a price of P2 and a quantity of Q2 units
The business revenue (P × Q) has changed from P1Q1 to P2Q2
A fall in supply
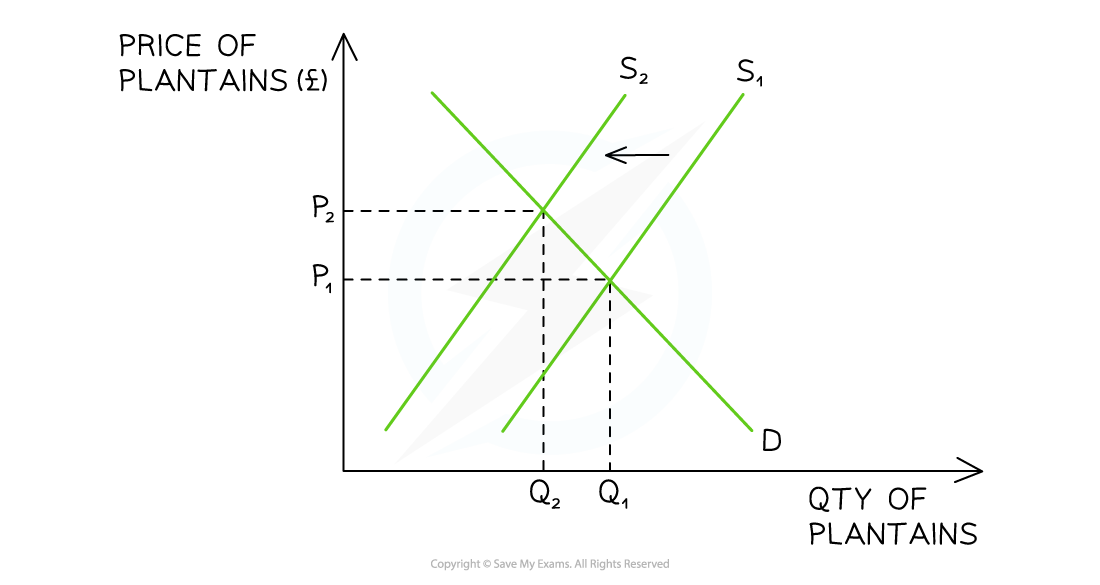
Explanation
The original equilibrium was at P1 and Q1
A fall in supply causes the supply curve to shift to the left from S1→S2 (perhaps due to an increase in the costs of production)
At the original price of P1, there is now a shortage, as demand exceeds supply
The shortage causes prices to rise from P1 to P2
A new equilibrium develops at a price of P2 and a quantity of Q2 units
The business revenue (P × Q) has changed from P1Q1 to P2Q2
Examiner Tips and Tricks
When answering questions on changes to markets, remember that a change in the price of the good leads to a movement along the demand or supply curve, not a shift in the demand or supply curve.
Practise drawing and labelling demand and supply diagrams accurately, describing them step by step. This will help you gain analysis marks. You can also use demand and supply diagrams to illustrate changes in total revenue.

Unlock more, it's free!
Join the 100,000+ Students that ❤️ Save My Exams
the (exam) results speak for themselves:

Was this revision note helpful?
