Break-even (Edexcel A Level Business): Revision Note
Exam code: 9BS0

Using the contribution to calculate the break-even point
The contribution value is used to calculate the break-even point
The break-even point is where total revenue earned for a product is exactly equal to its total costs and where the business is making neither a profit nor a loss
It is calculated using the formula
The break-even point is expressed in units (e.g. the number of scented candles)
Identifying the break-even point allows a business to understand how many items it needs to produce and sell to cover all costs before it starts to make a profit
Each subsequent unit sold past this point will generate profit for the business
Worked Example
Cost and revenue data for Canterbury Glamping
Cost/revenue | Cost (£) |
|---|---|
Revenue per pod per night | 95 |
Variable costs per pod per night | 19 |
Annual fixed costs | 55,000 |
Using the information in the table, calculate how many pods need to be occupied each year for Canterbury Glamping to break even. [4]
Step 1: State the formula to calculate the break-even point
[1]
Step 2: Calculate the contribution
[1]
Step 3: Apply the formula to calculate the break-even point
[1]
Step 4: Always round up to the nearest whole number because only whole products can be sold
[1]
Margin of safety
The margin of safety is the difference between the actual level of output of a business and its break-even level of output
The margin of safety can be calculated using the following formula:
Worked Example
The cost, sales and revenue for an electric bicycle manufacturer are presented in the table below.
Annual fixed costs | £42,000 |
Selling price per unit | £750 |
Variable cost per unit | £350 |
Number of units sold | 240 |
Using the data, calculate the margin of safety. You are advised to show your workings.
Step 1: Calculate the contribution
Step 2: Calculate the break-even point
Step 3: Calculate the margin of safety
Interpretation of break-even charts
A break-even chart is a visual representation of the break-even point and is used to identify the following
Fixed costs, total costs and revenue over a range of output
The break-even point, where total costs are equal to revenue
The profit or loss made at each level of output
The margin of safety
An example break-even chart
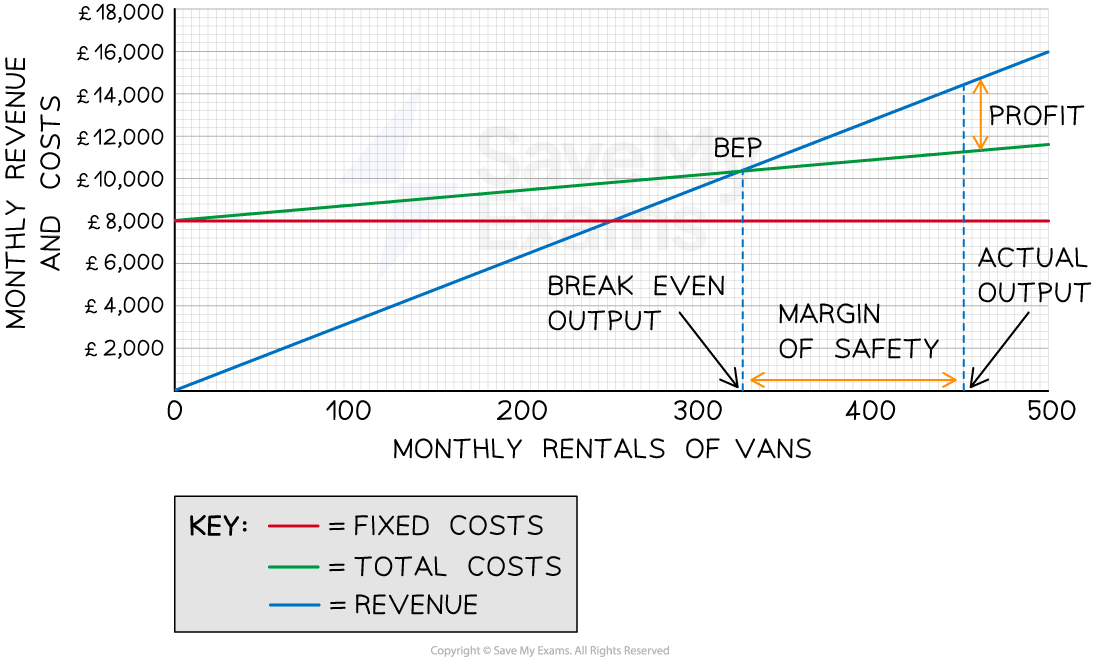
Diagram analysis
Fixed costs do not change as output increases
A2B's fixed costs are £8,000, and these do not change whether the business produces zero units or 500 units
Total costs are made up of fixed and variable costs
At zero units of output, they are made up exclusively of fixed costs
At 500 units, the total variable costs equate to £11,800
This line slopes upwards because total variable costs increase as output increases
The revenue line also slopes upwards
At zero units of output, the revenue is £0
At 500 units, the total revenue equates to £16,000
Revenue will increase with the output
The line will slope more steeply than the total costs and will cross the total costs line at some point
The point at which the total costs and the revenue lines cross is the break-even point
The break-even level of output for A2B is 324 units
The margin of safety can be identified as the difference on the x-axis between the actual level of output (in this case, 450 units) and the break-even point
The profit made at a specific level of output can be identified as the space between the revenue and total cost lines
In this instance, the profit made at 450 units of output is £14,400 − £11,250 = £3,150
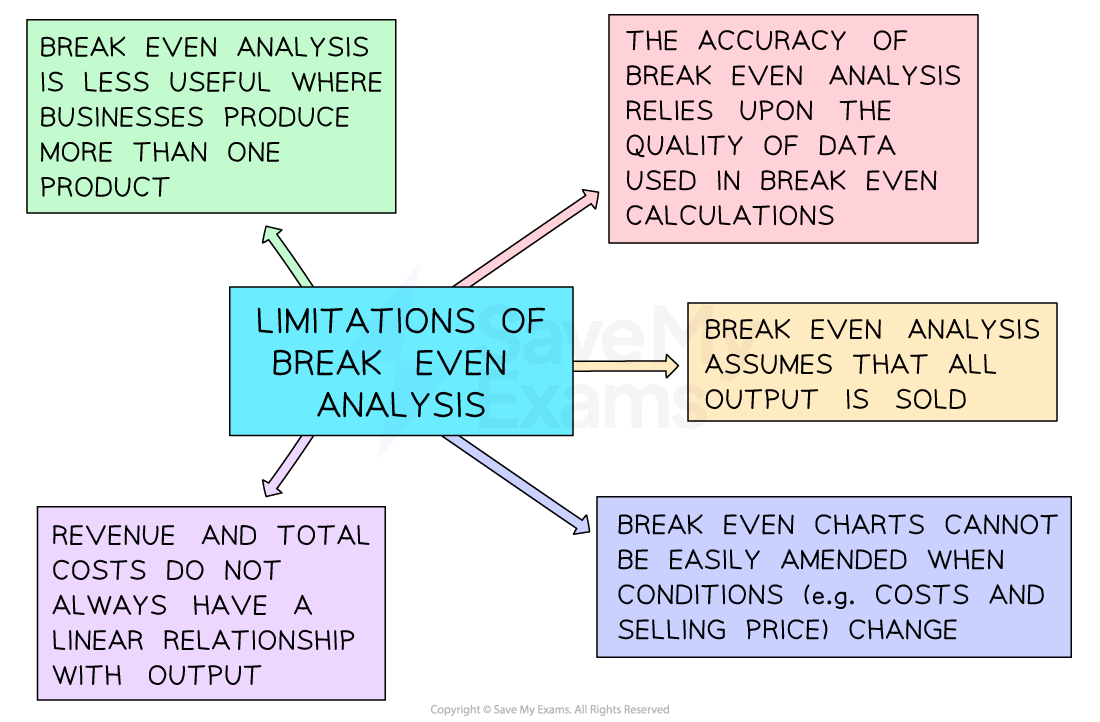
Limitations of break-even analysis
Examiner Tips and Tricks
When assessing break-even analysis, ensure that you explain why it has an important internal planning role, but don’t forget that it has a significant external role as well.
Break-even analysis should be included in a business plan when a business is trying to secure external finance. Businesses looking to borrow money or attract investors seeking to manage their risk should take care to model the break-even point, margin of safety and level of profit (or loss) at different levels of output and prepare themselves to be scrutinised on the figures.

Unlock more, it's free!
Join the 100,000+ Students that ❤️ Save My Exams
the (exam) results speak for themselves:

Was this revision note helpful?
Build on this topic