Sales, Revenue & Costs (Edexcel A Level Business): Revision Note
Exam code: 9BS0

Calculation of sales volume and sales revenue
Sales volume is the number of units sold by a business
For example, the number of Harry Styles album download purchases
Sales revenue is the value of the units sold by a business
For example, the revenue earned by Apple Music from sales of music downloads
Sales revenue is a key business performance measure and must be calculated to identify profit
Sales revenue is calculated using the formula:
Sales revenue usually increases as the sales volume increases
When a firm sells one product, it is easy to calculate the sales revenue
The more products a firm sells, the harder it is to calculate the sales revenue
Computer systems make it easier to track sales revenue when multiple products are sold by the business
Worked Example
Fotherhill Organics Limited sold 39,264 packs of its specialist compost to mail-order customers in 2022. The price per pack was £8.75. In addition, it sold 4,280 tonnes to gardening businesses for £123.95 per tonne.
Calculate Fotherhill Organics' sales revenue for 2022.
Step 1: Calculate the sales revenue from sales to mail-order customers
Step 2: Calculate the sales revenue from sales to gardening businesses
Step 3: Add together the two sales revenue figures
An introduction to costs
In preparing goods/services for sale, businesses incur a range of costs
These costs can be broken down into different categories
Fixed costs
Fixed costs (FC) do not change as the level of output changes
These have to be paid whether the output is zero or 5,000
For example, building rent, management salaries, insurance and bank loan repayments
Variable costs
Variable costs (VC) vary directly with the output
These increase as output increases and vice versa
For example, raw material costs and wages of workers directly involved in production
Total costs
Total costs (TC) are the sum of FC and total VC
Average costs
Average cost is the total cost of production divided by the number of units produced
Calculation of fixed, variable and total costs
Based on the above definitions, we can calculate several different types of costs
Key formulas
Type of cost | Formula |
|---|---|
TC | = Total FC + total VC |
Total VC | = VC per unit × quantity |
Average TC (unit cost) | = TC ÷ quantity produced |
VC per unit | = Total VC ÷ quantity produced |
Example: cost calculations where variable costs = £60
Output (Q) | FC | TVC = | TC = | AVC = | AC = |
|---|---|---|---|---|---|
0 | 200 | - | 200 | - | - |
1 | 200 | 60 | 260 | 60 | 260 |
2 | 200 | 120 | 320 | 60 | 160 |
3 | 200 | 180 | 380 | 60 | 126.67 |
4 | 200 | 240 | 440 | 60 | 110 |
5 | 200 | 300 | 500 | 60 | 100 |
6 | 200 | 360 | 560 | 60 | 93.33 |
7 | 200 | 420 | 620 | 60 | 88.57 |
8 | 200 | 480 | 680 | 60 | 85 |
Variable costs per unit
VC per unit are calculated by adding together the cost of each component or raw material used to produce the unit
Worked Example
Rosebud Aromas manufactures luxury scented candles. The production of each candle incurs the following VC:
VC | Cost per candle (£) |
|---|---|
Wax | 0.14 |
Perfume oil | 0.72 |
Telephone bill | 24.32 |
Glass jar | 1.46 |
Outer packaging | 0.33 |
Calculate the VC in pounds sterling for each candle.
Step 1: Identify the VC in the list
A telephone bill is classified as an FC, so it should not be included in the calculation.
Step 2: Total the VC listed
Examiner Tips and Tricks
Take care when calculating VC per unit, as it is likely that one or more FC will be included in the list, as seen above.
Diagrammatic representation of costs
Fixed costs

The firm has to pay its fixed costs, which do not change according to output
The FC for this firm are £4,000
Variable costs

The VC initially rises proportionally with output, as shown in the diagram
At some point, the firm will benefit from purchasing economies of scale, and the rise will no longer be proportional
Total costs
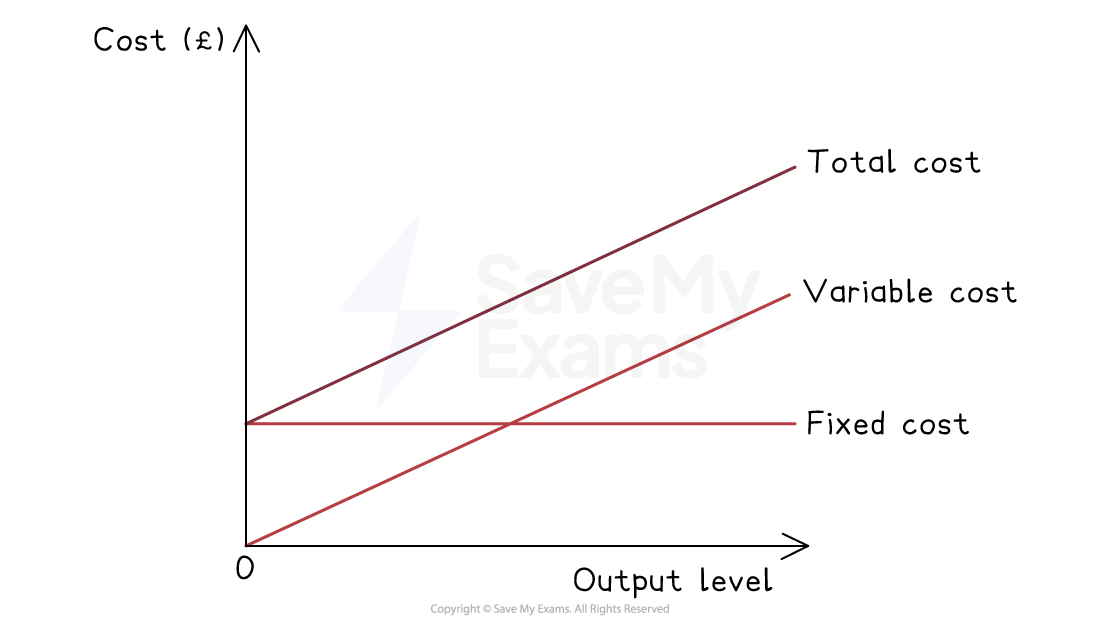
The TC are the sum of the VC and FC
The TC cannot be zero, as all firms have some level of FC
Average total costs
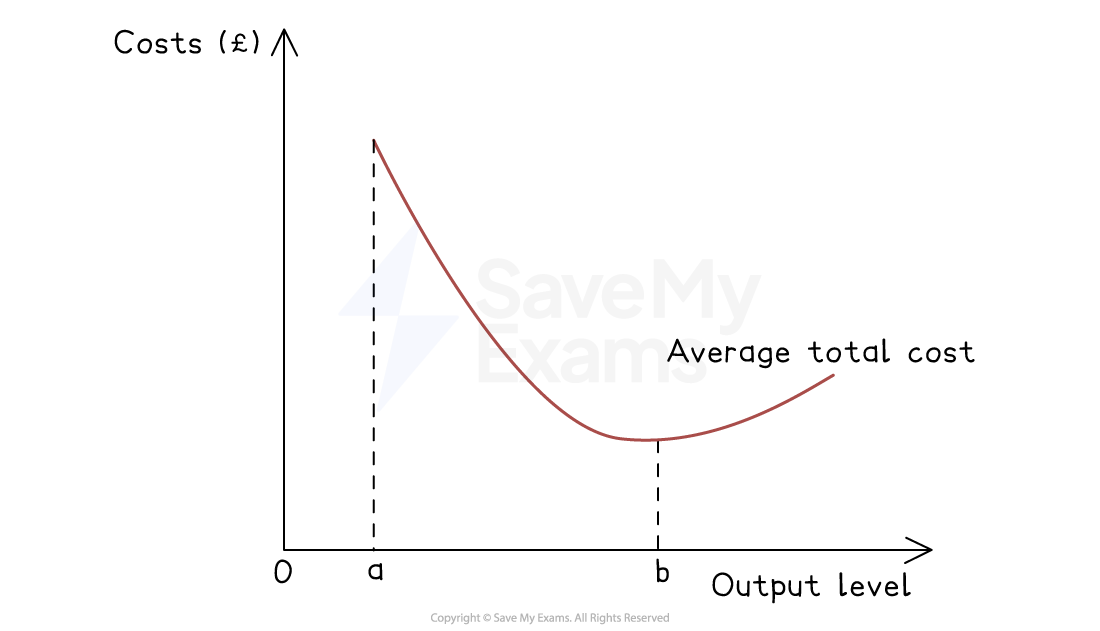
As a firm grows, it can increase its scale of output, generating efficiencies that lower its average total costs (AC) of production
These efficiencies are called economies of scale
As a firm continues increasing its scale of output, it will reach a point where its AC will start to increase
The reasons for the increase in the average costs are called diseconomies of scale
Contribution
Contribution is a product’s selling price minus the VC directly involved in producing that unit
Contribution can be calculated using the following formula:
It is called "contribution", as this amount contributes towards paying off the FC of the business
Once the FC have been paid off, the contribution starts to contribute to the profits of the business
Contribution is used to calculate the break-even point
Worked Example
Rosebud Aromas manufactures luxury scented candles. The production of each candle incurs the following VC:
VC | Cost per candle (£) |
|---|---|
Wax | 0.14 |
Perfume oil | 0.72 |
Glass jar | 1.46 |
Outer packaging | 0.33 |
Each candle is sold for an average wholesale price of £15 to retail outlets. Calculate the contribution for each candle.
Step 1: Calculate the total VC per candle
Step 2: Deduct the total VC per candle from the selling price

Unlock more, it's free!
Join the 100,000+ Students that ❤️ Save My Exams
the (exam) results speak for themselves:

Was this revision note helpful?
Build on this topic