Variations in Population Characteristics (Edexcel A Level Geography): Revision Note
Exam code: 9GE0

Variation between settlements
In the UK, there are similar numbers of males (49%) and females (51%) for most ethnic groups
The exceptions are Chinese, Black Caribbean and Other White ethnic groups, where females represent 53% of the population (2021 census)
Settlements vary in their population characteristics (gender and ethnicity)
Some urban areas have more males than females due to the industries located there
E.g. the offshore oil industry in Aberdeen is dominated by male employees
Rural areas have more single men than women (103 males for every 100 females), as women are more likely to move to urban areas for job opportunities
Coastal areas, especially the south coast and east coast of England, have higher rates of elderly people
On average, women live longer than men, so these coastal retirement locations tend to have more older women
There are more male international economic migrants than females, as male immigrants are more likely to get a job compared to females
This often leads to inner-city areas having more young male immigrants
The ethnic diversity of a place increases too
Urban areas attract more international migrants as they cater for a wider range of cultural needs e.g. places of worship for religious practice
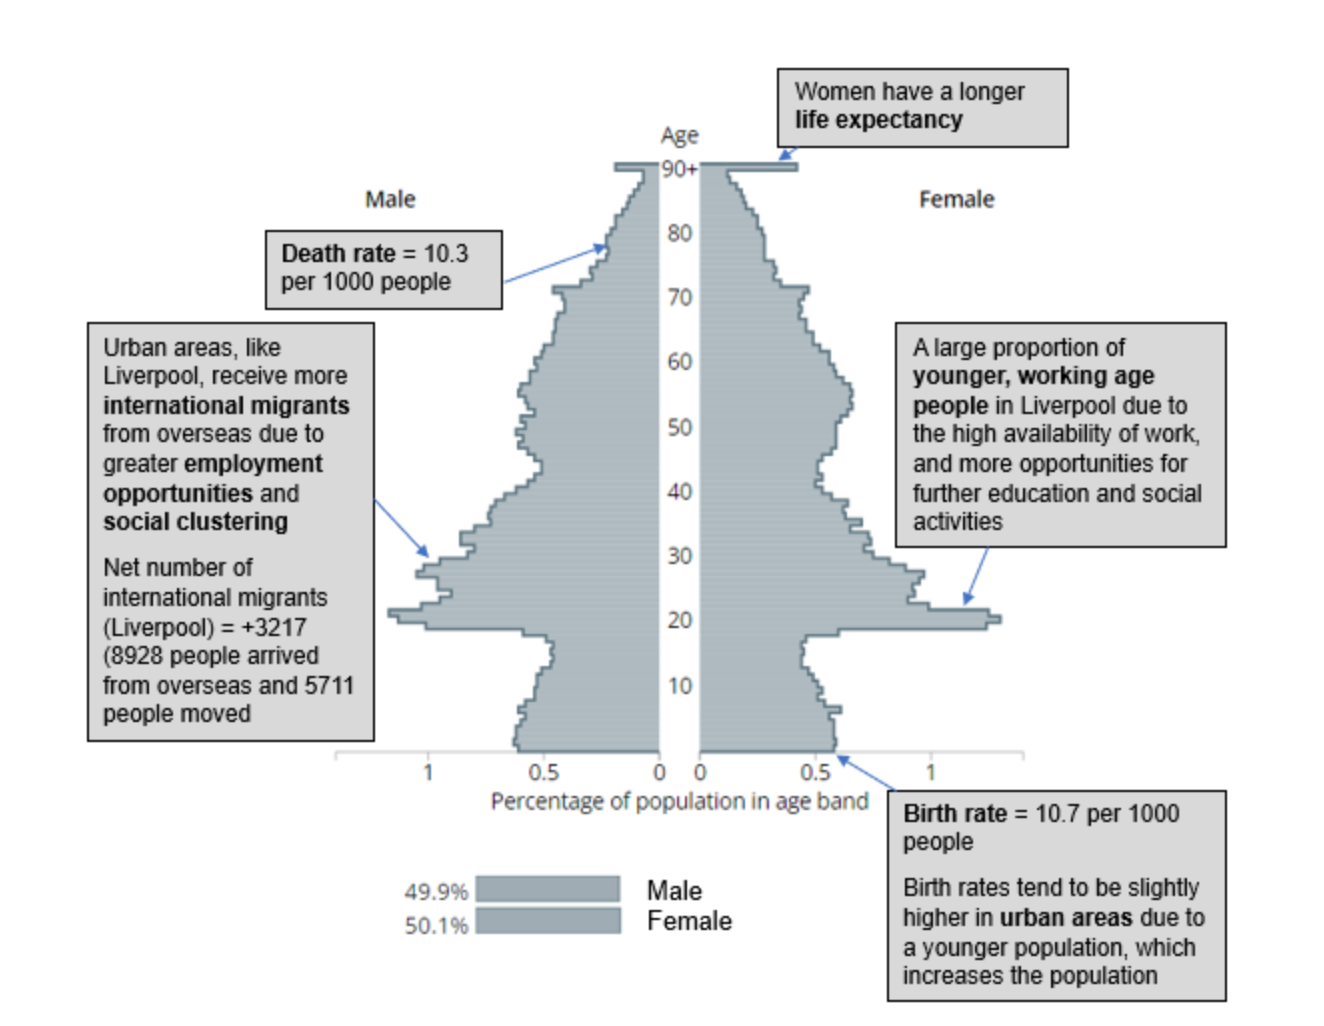
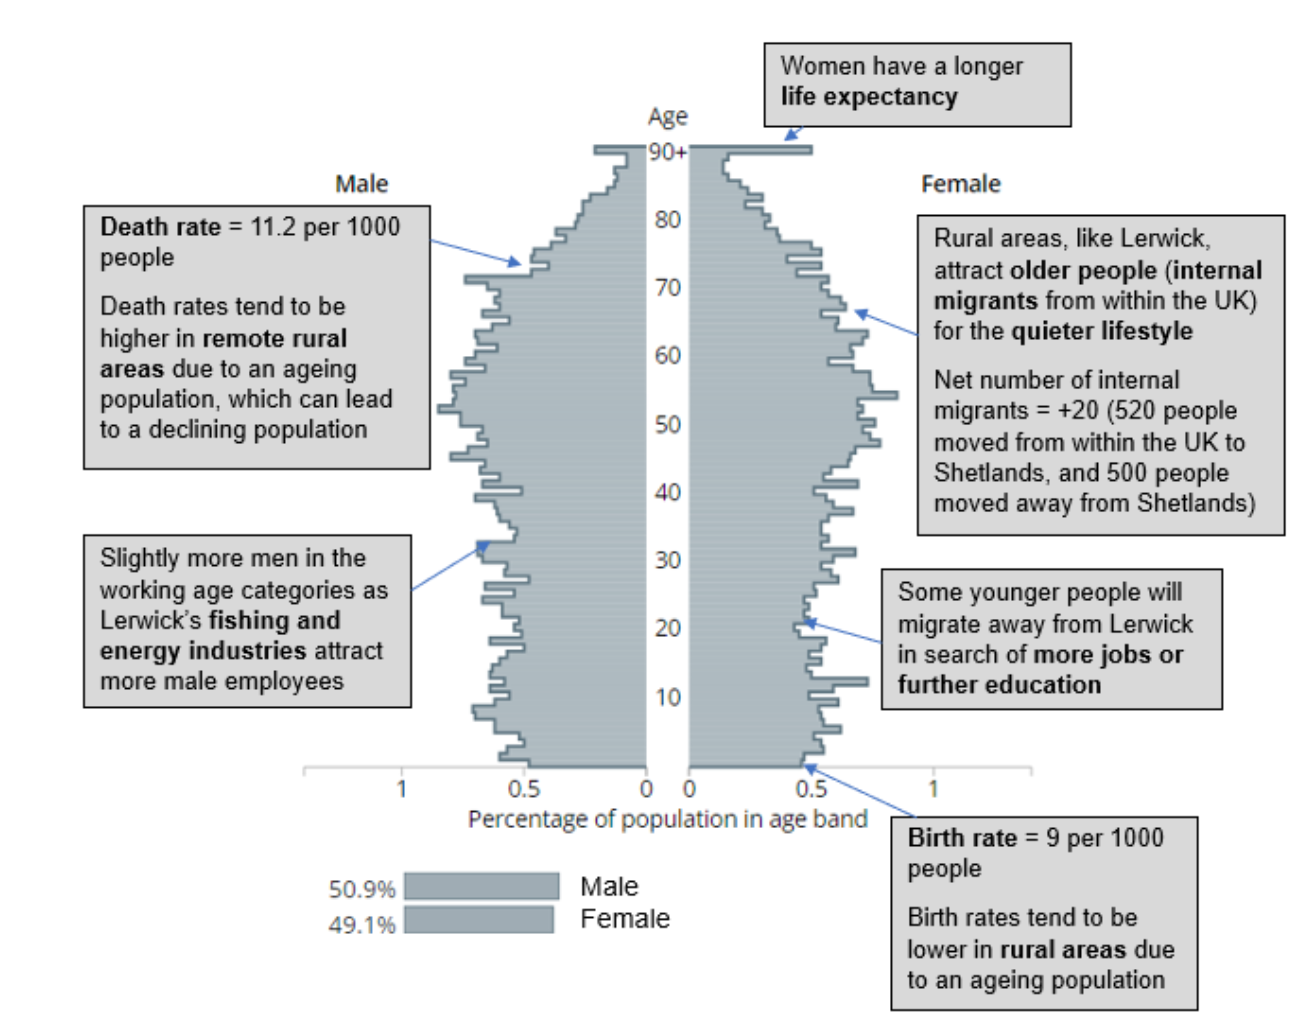
The population pyramids for Liverpool (an urban area) and Shetland (a rural area) show differences e.g.
Liverpool has a larger proportion of younger, working-age people, whilst Shetland has more of an ageing population
There are significant variations in population characteristics within larger urban settlements (towns and cities)
The inner city areas have a larger proportion of younger working-age people, whilst families dominate the suburbs
The inner city attracts higher numbers of university students and graduates (internal migration), compared to the suburbs
The inner city has higher levels of international migrants, due to social clustering, than the suburbs
The population of inner cities has a wider ethnic diversity than the suburbs
Variations in cultural diversity
The extent of ethnicity and cultural diversity of places within the UK is being driven by:
The social clustering of immigrants
Immigrants become highly concentrated in particular places within cities, e.g. Brent’s (a borough in north-west Greater London) population consists of 56% non-UK born residents
Clustering occurs largely due to the availability of cheaper housing and the feeling of safety created by an already established community, with a shared language, religion and culture
The pull of accessible cities - ethnic immigrant groups are more concentrated in Britain’s major cities (e.g. London, Birmingham) due to more job opportunities
Remote rural areas will be less culturally diverse due to physical factors, making accessibility harder (mountainous terrain, difficult climates)
Government policies may foster or suppress diversity
Since the European Union (EU) introduced free movement of EU citizens in 1995, the number of international migrants has doubled in the UK
Half of the international migrants settled in the South East region
Skills shortages in the knowledge-based industries force companies to recruit from overseas, e.g. the EU, USA and Australia
Shortages of semi-skilled and unskilled workers (e.g. refuse collection, construction, childcare) are filled with workers from the EU, as well as southern Asia and West Africa

2021 (England) 2022 (Scotland) census data
Ethnic diversity for Liverpool and Shetland is lower than the averages for England and Wales, where 18% identify as non-white
Liverpool has a much wider range of ethnic diversity than Shetland
Delving deeper into Liverpool’s ethnic diversity:
Approximately 5% of the population identify as “Other White”, predominantly from Poland
Between the 2011 and 2021 census, the number of people identifying as “Other White” residents in Liverpool has doubled
After English, the highest non-English languages are Arabic and Polish
The area with the highest rate of non-White English/British is in Princes Park (69%), an inner-city area of Liverpool
Examiner Tips and Tricks
It is a good idea to create a glossary of the key terms used for each topic. Continue to add to your glossary as you work through the topic e.g.
International migration
Internal migration
Fertility rate
Social Clustering
To make this even easier, key terms are highlighted in blue on our revision pages. Hover over these terms and a definition will appear!
Changes in cultural characteristics
The cultural characteristics of a place can be influenced by internal and international migration, as well as fertility and mortality rates
The majority of places experiencing cultural change will be urban areas that have higher levels of ethnic diversity
The concentration of ethnic groups in certain areas will lead to the introduction of food and clothing shops on the high streets
Fertility rates could rise if the immigrants’ culture promotes larger families
Internal migration can also lead to cultural changes within a place
The influx of students into a neighbourhood can lead to studentification of an area
Family homes becoming a house of multiple occupation (HMOs) for students
Increase in the number of services directed at students e.g. discount stores, fast food outlets
Worked Example
Suggest reasons for the different levels of cultural diversity between Newcastle-upon-Tyne and Northumberland
[6 marks]
There is no expectation that your have studied either location, so specific knowledge about the places is not required
The expectation is that you recognise that Newcastle is an urban area, whilst Northumberland is rural, which leads to variations in cultural diversity
Answer:
International and internal migration is changing the cultural characteristics of places. Northumberland will have less variation in cultural diversity as internal migration to this area will be predominantly by older, retired people. This leads to an ageing population in rural areas, like Northumberland, and as a result there are fewer services aimed at economically active migrants. There are also fewer opportunities for employment in rural areas, attracting fewer migrants and therefore limiting cultural diversity.
The vast majority of international migrants will end up in urban areas, like Newcastle, due to the variety of job opportunities available. This leads to greater cultural diversity, as the immigrants will bring their own culture. The introduction of new shops, places of worship and eating places will reflect this, and this may result in the area being unofficially renamed, for example, Chinatown in London.
Within these urban areas, like Newcastle, immigrants become highly concentrated in particular places within cities. For example, Brent’s (a borough in north-west Greater London) population consists of 56% non-UK-born residents. This social clustering occurs largely due to the availability of cheaper housing and the feeling of safety created by an already established community, with a shared language, religion and culture.

Unlock more, it's free!
Join the 100,000+ Students that ❤️ Save My Exams
the (exam) results speak for themselves:

Was this revision note helpful?
Build on this topic
