Stopping Distance (AQA GCSE Physics): Revision Note
Exam code: 8463

Estimating Stopping Distances
For a given braking force, the speed of a vehicle determines the size of the stopping distance
The greater the speed of the vehicle, the larger the stopping distance
The image below shows how the stopping distance of a typical family car increases with increasing speed:
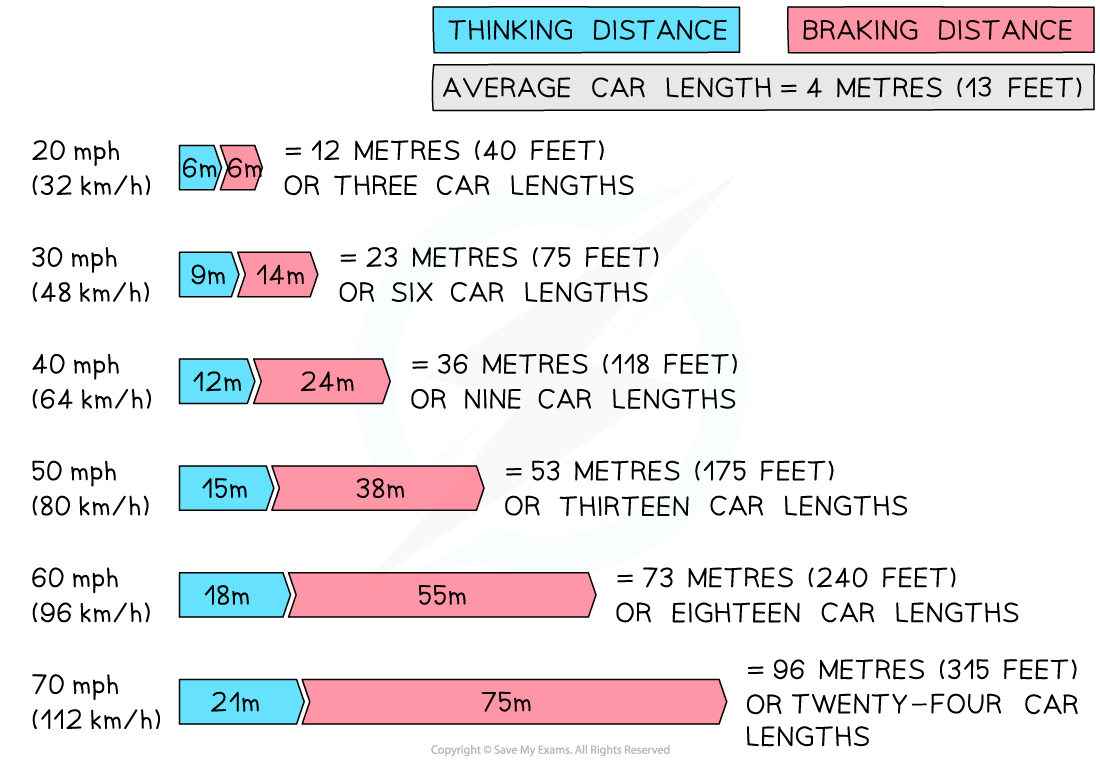
A vehicle's stopping distance increases with speed. At a speed of 20 mph the stopping distance is 12 m, whereas at 60 mph the stopping distance is 73 m (reproduced from the UK Highway Code)
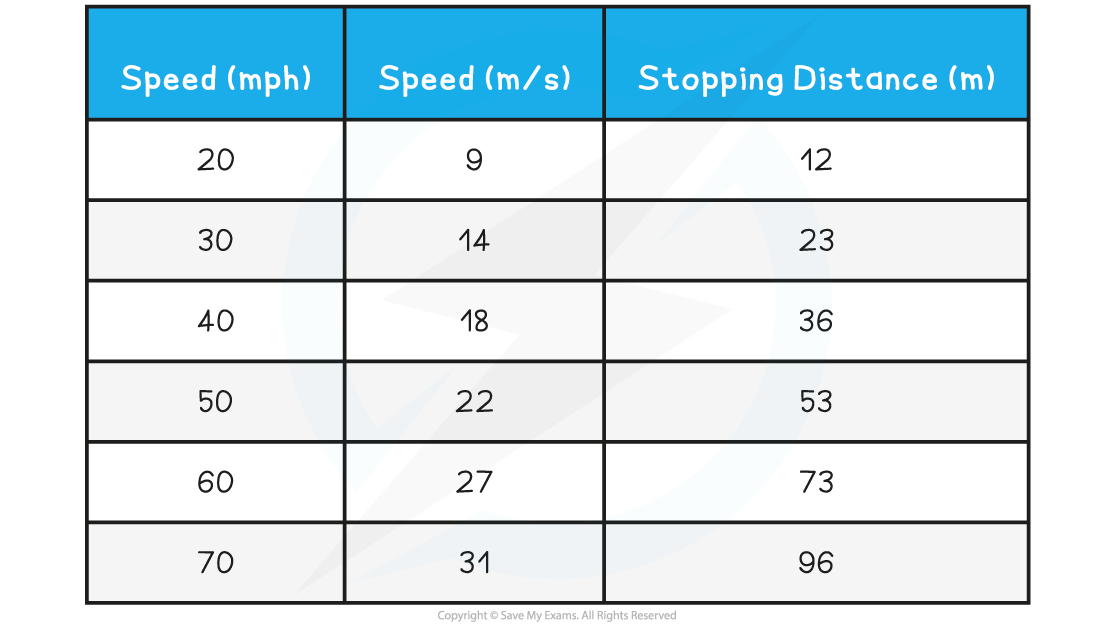
Graphs Relating Speed to Stopping Distance
The velocity-time graph below shows how the velocity of a car will typically change during an emergency stop
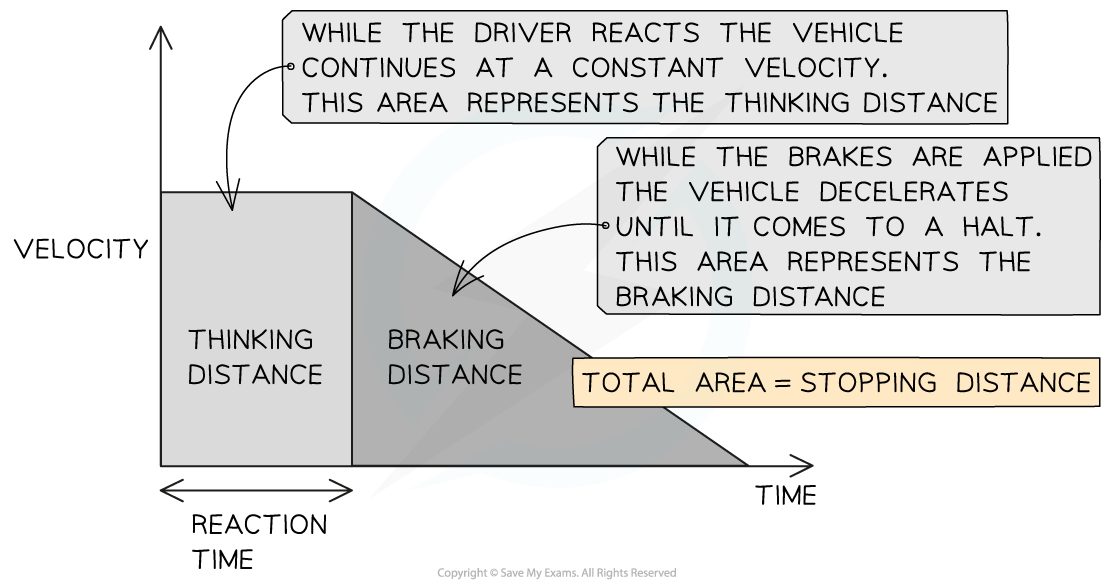
Graph showing how the velocity typically changes as a vehicle comes to an emergency stop
While the driver reacts (the time taken to press the brakes is called the reaction time), the vehicle continues moving at a constant velocity
The area underneath the graph during this time represents the thinking distance
As soon as the brakes are applied, the vehicle decelerates to a halt
The area underneath the graph during this time represents the braking distance
Worked Example
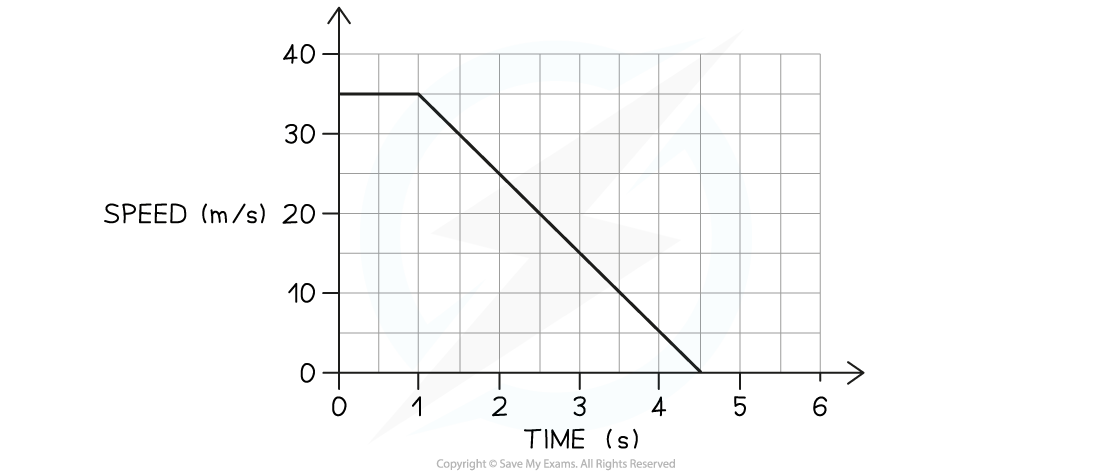
While driving at a speed of 35 m/s, Stephen sees an obstacle in the road at time t = 0.The velocity-time graph below shows how the speed of the car changes as Stephen reacts and slams the brakes, bringing the car to a halt.
Determine
(a) The braking distance of the car.
(b) The driver's reaction time.
Answer:
Part (a)
Step 1: Identify the section of the graph which represents the braking distance
The area under a velocity-time graph represents distance travelled
The braking distance of the car is the distance travelled under the braking force
This area of the graph is shaded below:
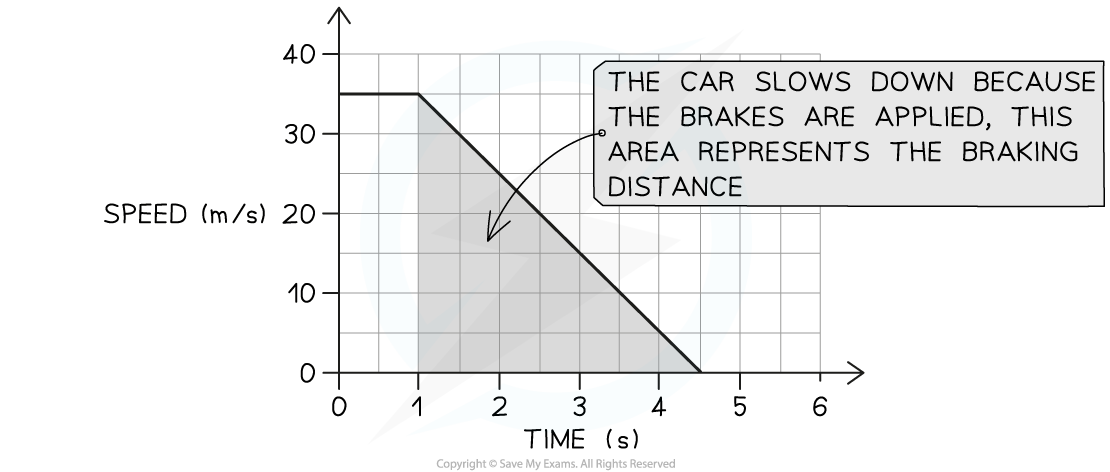
The braking distance of the car is the area shaded because the car decelerates once the brakes are applied
Step 2: Calculate the area under the graph during the car's deceleration
The area is a triangle, so the braking distance is given by:
Braking distance = Area = ½ × base × height
Braking distance = ½ × (4.5 – 1) × 35 = 61.3 m
Part (b)
Step 1: Determine how long the driver takes before the brakes are applied
Between seeing the obstacle and applying the brakes, 1 second passes
This sequence of events is labelled on the graph below:
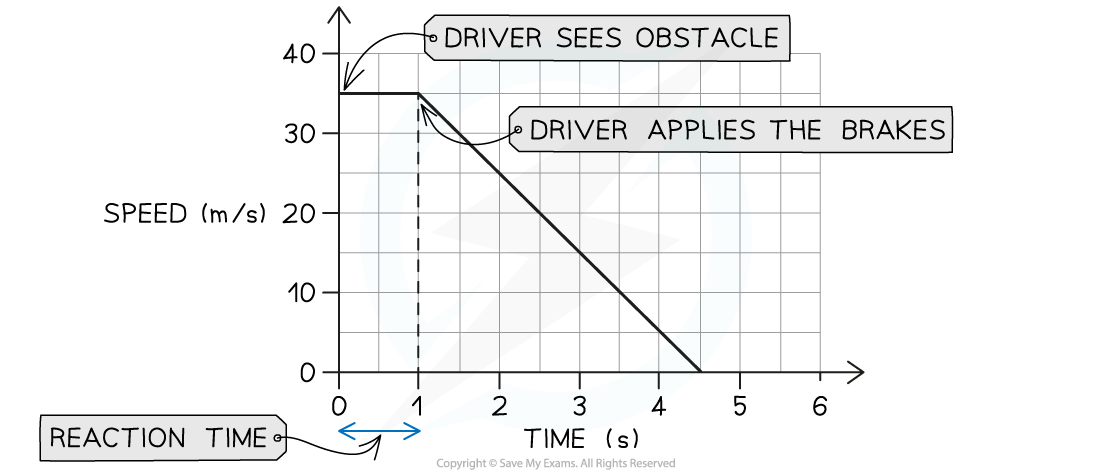
The driver's reaction time is the time between the moment they see the obstacle to the moment the brakes are applied
Therefore, the driver's reaction time is 1 s

Unlock more, it's free!
Join the 100,000+ Students that ❤️ Save My Exams
the (exam) results speak for themselves:

Was this revision note helpful?
Build on this topic