Waves (AQA GCSE Combined Science: Synergy: Life & Environmental Sciences): Exam Questions

Exam code: 8465

1 hour9 questions
1a
2 marks

Ultraviolet, infrared and visible light are part of the electromagnetic spectrum.

Ultraviolet radiation and infrared radiation are emitted by some objects.

Give one use of ultraviolet radiation and one use of infrared radiation.

1b
1 mark

Neon atoms can absorb electromagnetic radiation.

Figure 13 shows three of the energy levels around the nucleus of a neon atom.
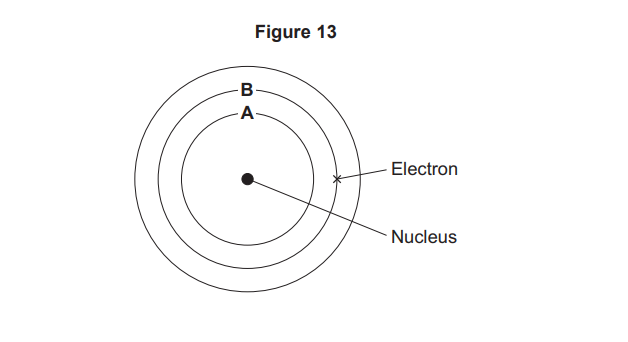
Diagram of an atom showing a central nucleus and three circular electron orbits, labelled A and B, with an electron marked on the outer orbit

The atom in Figure 13 has absorbed electromagnetic radiation.

What happens as an electron moves from energy level B to energy level A?

  • Light is absorbed

  • Light is emitted

  • Light is reflected

1c
1 mark

An electromagnetic wave has a speed of 300000000 m/s.

What is the speed of the wave in standard form?

  • 3.0×10⁷ m/s

  • 3.0×10⁸ m/s

  • 3.0×10⁹ m/s

1d
1 mark

Use the Physics Equations Sheet to answer questions 09.4 and 09.5.

Write down the equation that links frequency (f), wavelength (λ) and wave speed (v).

1e
Sme Calculator
4 marks

The electromagnetic wave has a frequency of 750000 Hz.

Calculate the wavelength of the electromagnetic wave.

Give the unit.

2a
3 marks

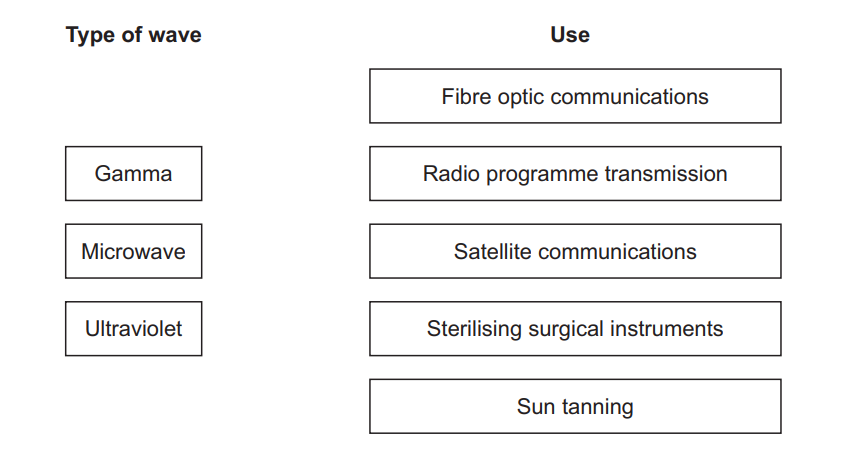
The electromagnetic spectrum is grouped into different types of wave.

Draw one line from each type of wave to a use of the wave.

Diagram listing wave types (gamma, microwave, ultraviolet) to be matched with uses: fibre optic and satellite communications, radio transmission, sterilising tools, sun tanning
2b
1 mark

Infrared radiation is emitted by heaters.

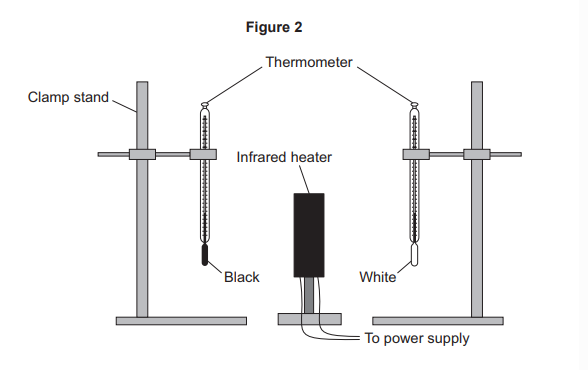
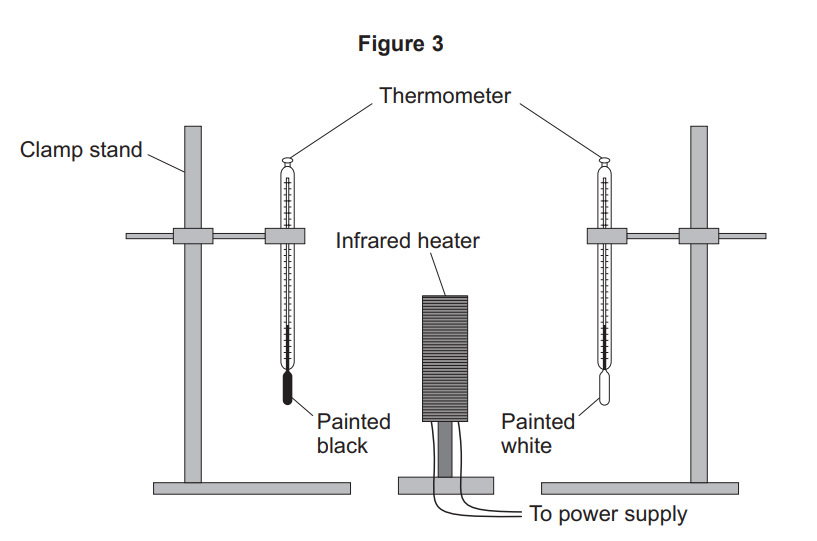
A student investigated the absorption of infrared radiation by a black surface and by a white surface.

Figure 2 shows some of the equipment used.

Diagram of two thermometers on clamp stands, black and white bulbs facing an infrared heater block connected by wires to a power supply

This is the method used.

  1. Ensure that the initial temperature shown on the thermometers is the same.

  2. Switch on the infrared heater.

  3. Record the temperature shown on each thermometer every 30 seconds for 5 minutes.

What equipment should the student have used to measure time?

2c
1 mark

The distance between the infrared heater and each thermometer was kept the same throughout the investigation.

What type of variable was the distance?

Tick (✓) one box.

  • A control variable

  • A dependent variable

  • An independent variable

2d
1 mark

What was a risk to the student in the investigation?

Tick (✓) one box.

  • Burns from the infrared heater

  • Misreading the thermometers

  • Wearing safety glasses

2e
1 mark

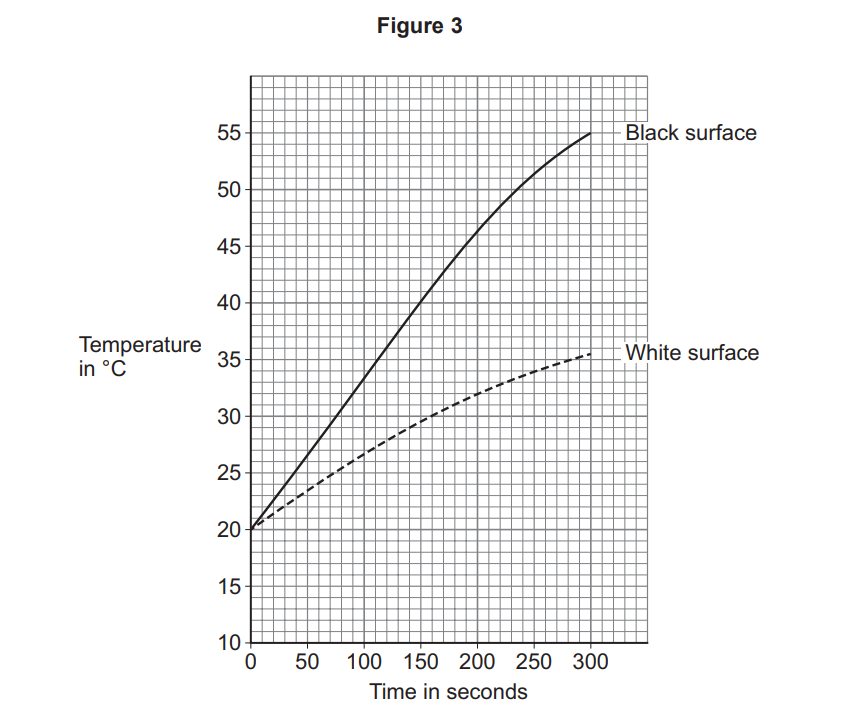
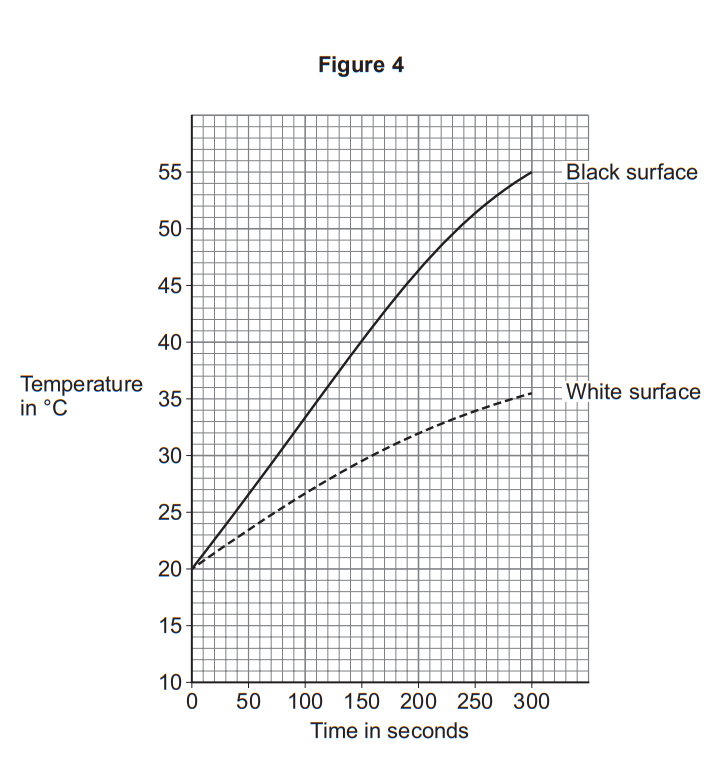
Figure 3 shows the results.

Line graph of temperature versus time showing a black surface heating faster to about 54°C than a white surface, which rises more slowly to about 36°C.

What was the temperature of the room where the investigation took place?

Use Figure 3.

Temperature =__________°C

2f
2 marks

What two conclusions can be made from Figure 3?

Tick (✓) two boxes.

  • The black surface absorbed all the infrared radiation.

  • The black surface had a greater temperature increase per second.

  • The black surface reflected all the infrared radiation.

  • The black surface was a better absorber of infrared radiation.

  • The black surface was a better reflector of infrared radiation.

2g
2 marks

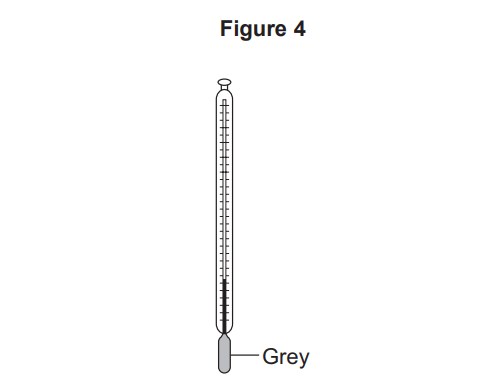
Figure 4 shows a thermometer with a grey surface.

Diagram of a vertical thermometer with a grey bulb at the bottom, showing a shaded grey column of liquid rising partway up the narrow tube

The investigation was repeated using this thermometer.

  • The distance between the thermometer and the heater was the same as in the first investigation.

  • The room temperature was the same as the first investigation.

Draw a line on Figure 3 to predict the results for the thermometer shown in Figure 4.

3a
1 mark

Waves transfer energy.

Radio waves are transmitted from a radio station and absorbed by a radio receiver.

What is created in the radio receiver when the radio waves are absorbed?

  • An alpha particle

  • An alternating current

  • An ultraviolet wave

  • An X-ray

3b
1 mark

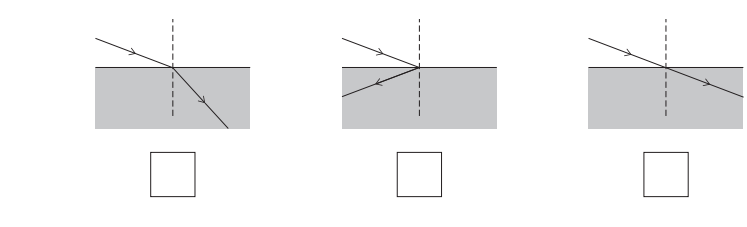
Radio waves may be refracted when they travel from one substance into another substance.

Which diagram shows the refraction of a radio wave?

Three diagrams of light rays at a boundary between air and a denser block, showing different incident, refracted and reflected paths with a dashed normal line
3c
2 marks

When the radio receiver is switched on, a sound wave is produced.

Give two differences between radio waves and sound waves.

3d
3 marks

Table 4 shows the speed of sound in different substances at two different temperatures.

Table 4

Substance

Temperature of substance in °C

Speed of sound in metres per second

Air

1

332

Air

20

344

Steel

1

5002

Steel

20

5136

Water

1

1411

Water

20

1465

Give three conclusions about the effect of temperature and the type of substance on the speed of sound waves.

3e
3 marks

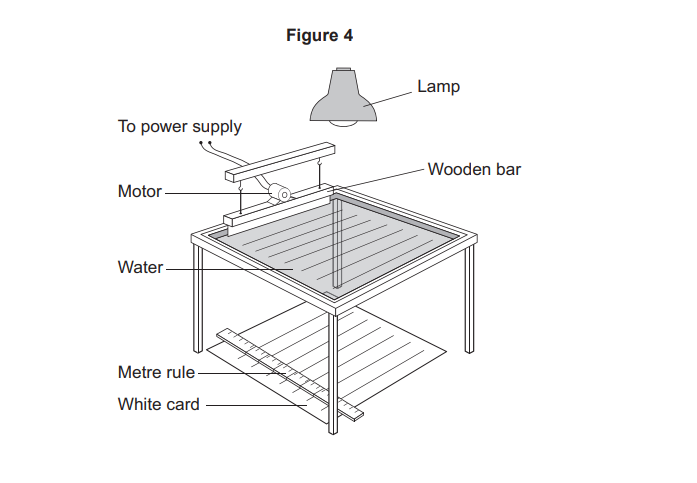
A teacher used a ripple tank to show how varying the frequency affected the wavelength of water waves.

Figure 4 shows the apparatus.

Diagram of a ripple tank with water, motor-driven wooden bar, overhead lamp, and below a white card with metre rule for observing wave patterns

This is the method used.

  1. Turn on the lamp.

  2. Adjust the power supply so that the wooden bar vibrates with a frequency of 10 Hz to produce waves on the water.

  3. Take a photograph of the image of the waves projected onto the white card.

  4. Measure the length of 5 waves from the photograph.

  5. Calculate the wavelength of 1 wave.

  6. Repeat steps 2 to 5 for different frequencies.

The method used by the teacher is better than measuring the length of only 1 wave directly from the white card.

Explain why.

4a
1 mark

Ultraviolet waves and visible light waves are types of radiation in the electromagnetic spectrum.

How does the frequency of ultraviolet waves compare with the frequency of visible light waves?

Tick (✓) one box.

  • The frequency of ultraviolet waves is higher than the frequency of visible light waves.

  • The frequency of ultraviolet waves is the same as the frequency of visible light waves.

  • The frequency of ultraviolet waves is lower than the frequency of visible light waves.

4b
Sme Calculator
4 marks

An ultraviolet wave has a wavelength of 340 nanometres.

speed of electromagnetic radiation = 3.0 × 10⁸ m/s

Calculate the frequency of the ultraviolet wave.

Use the Physics Equations Sheet.

Frequency = Hz

4c
3 marks

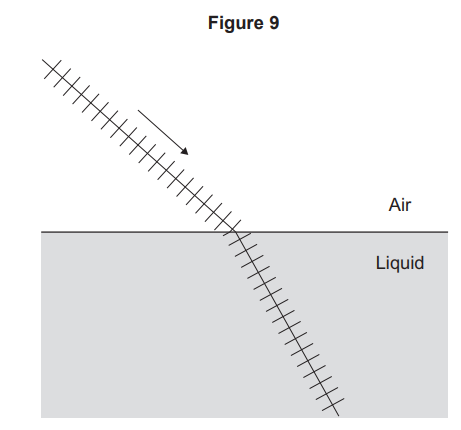
Figure 9 shows the wavefronts of a visible light wave passing from air into a liquid.

Figure 9

Figure 9: a light ray with closely spaced wavefronts travels through air at an angle and meets the boundary with a denser liquid. In the liquid the wavefronts are closer together and the ray bends towards the normal.

Explain why the wave refracts as it passes from the air into the liquid.

5a
1 mark

A student used a ripple tank to investigate water waves.

What type of wave is a water wave?

  • A sound wave

  • A transverse wave

  • An electromagnetic wave

5b
1 mark

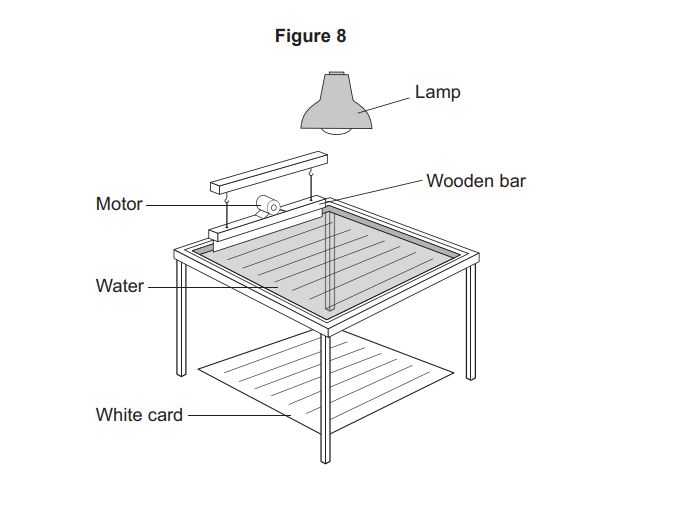
Figure 8 shows the ripple tank.

Diagram of an experiment with a lamp above a tank of water, a motor moving a wooden bar across the surface, and a white card beneath the tank

Describe how the water waves are produced in the ripple tank.

5c
1 mark

The student counted the number of waves reaching the end of the tank.

What other measurement is needed to calculate the frequency of the waves?

5d
2 marks

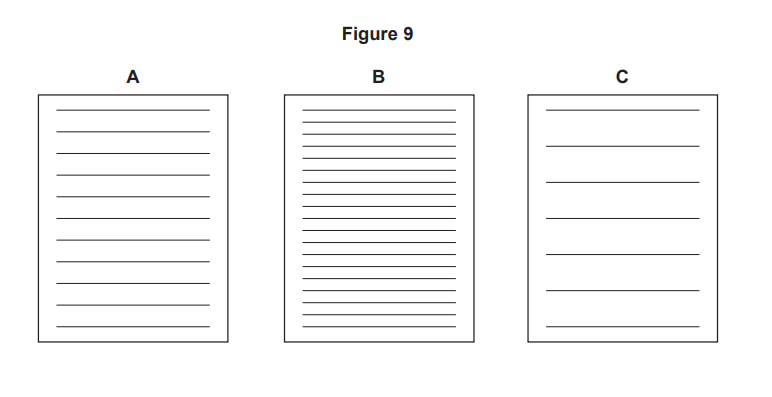
Figure 9 shows three different wave patterns produced on the white card.

Figure 9 showing three labelled pages: A with widely spaced lines, B with many closely spaced lines, and C with fewer widely spaced lines.

Which pattern in Figure 9 shows the waves with the greatest frequency?

Give a reason for your answer.

5e
1 mark

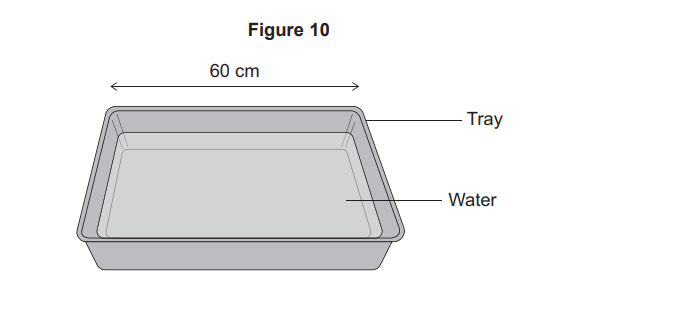
Another student investigated how the depth of water in a tray affected the speed of water waves.

Figure 10 shows the apparatus.

Diagram of a rectangular tray 60 cm wide, partly filled with water, with arrows labelling the tray sides and the water inside.

This is the method used.

  1. Pour water at room temperature into a tray to a depth of 5 mm.

  2. Lift one end of the tray 5 cm and then let it go.

  3. Measure the time taken for the water wave to move across the tray.

  4. Calculate the speed of the water wave.

  5. Repeat steps 1 to 4 with different depths of water.

Give one control variable in the student's investigation.

5f
1 mark

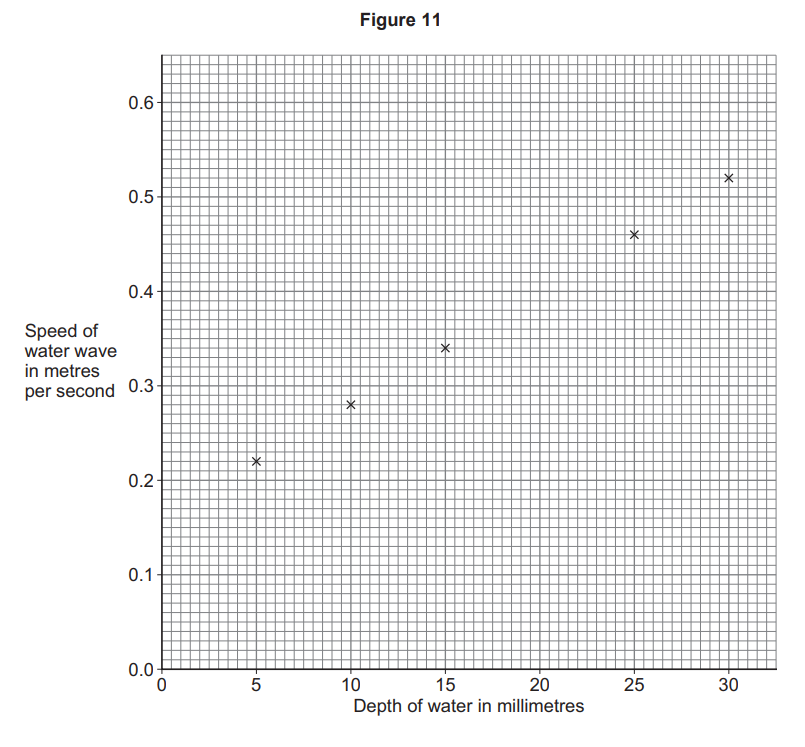
The student calculated the speed of the waves at each depth.

Figure 11 shows the results.

Scatter graph titled Figure 11 showing water wave speed increasing from about 0.22 to 0.55 m/s as water depth rises from 5 to 30 millimetres.

Draw a line of best fit on Figure 11.

5g
1 mark

What is the speed of the water wave when the depth of the water is 20 mm?

Use Figure 11.

6a
1 mark

Some students did an investigation to study the behaviour of waves.

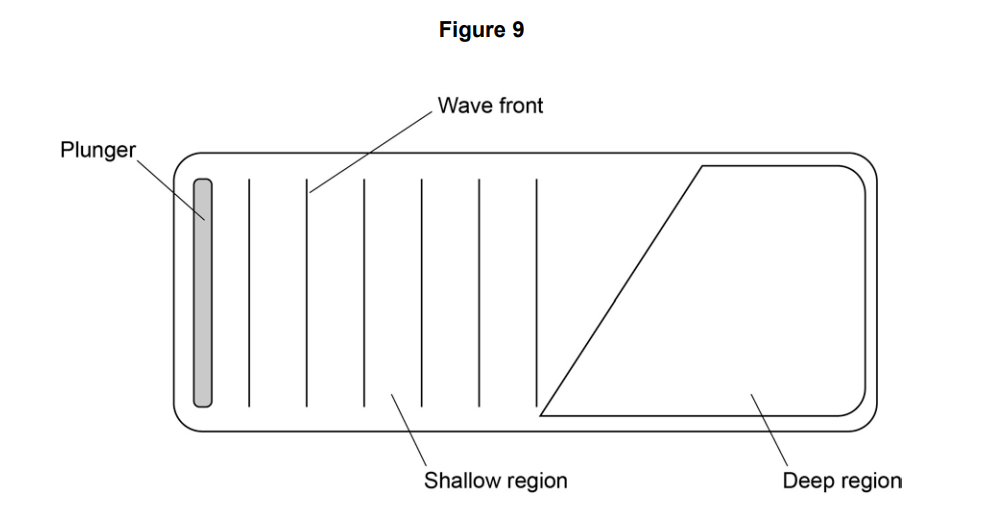
Figure 9 shows a ripple tank that they used to model the behaviour of waves

Diagram of a tank with a plunger on the left creating vertical wave fronts in a shallow region, leading to a sloping boundary and a deeper region on the right

Complete the wave fronts on Figure 9.

Show how the wave is refracted as it passes from the shallow region into the deep region.

6b
2 marks

Explain what happens to the waves as they pass into the deep region.

6c
3 marks

The waves generated on the surface of the water are transverse waves.

Describe the differences between longitudinal waves and transverse waves.

You may include labelled diagrams to help your answer.

6d
2 marks

Some students investigate the properties of the waves generated in Figure 9.

Student A says 'the waves move water from one end of the tank to the other'.

Student B says 'that's wrong. Only the waves move, not the water'.

Suggest what the students could do to decide which of them is correct.

6e
Sme Calculator
5 marks

Another student uses a ripple tank where all the water is the same depth.

She measures the wavelength of each wave as 0.34 m.

The period of each wave is 0.42 s.

Calculate the speed of the wave. Use the correct equation from the Physics Equation Sheet.

Give the unit.

Give your answer to three significant figures.

Speed = ____________________

Unit =______________________

7a
3 marks

The electromagnetic spectrum is grouped into different types of wave.

Each type of wave has different uses.

Complete the table.

Use

Type of wave

Satellite communications

Sterilising surgical instruments

Sun tanning

7b
2 marks

A student investigated the absorption of infrared radiation by a black surface and by a white surface. The student painted the bulb of one thermometer black and the bulb of another thermometer white.

Figure 3 shows some of the equipment used.

Diagram of two thermometers on clamp stands facing an infrared heater, one bulb painted black and the other white, wired to a power supply.

Method used:

  1. Ensure that the initial temperature shown on the thermometers is the same.

  2. Switch on the infrared heater.

  3. Record the temperature shown on each thermometer every 30 seconds for 5 minutes.

Explain why the distance between the infrared heater and each thermometer should be the same.

7c
2 marks

The infrared heater was a hazard in this investigation.

Describe the risk to the student and one precaution that the student should have taken.

Risk: __________________________________________________

Precaution: _____________________________________________

7d
2 marks

Figure 4 shows the results.

Line graph of temperature against time showing a black surface heating faster and reaching about 55°C, while a white surface rises more slowly to about 35°C.

Explain the conclusion that can be made from the results in Figure 4.

7e
2 marks

The paint used for the thermometer bulb painted white was a matt white paint.

The investigation was repeated using a thermometer bulb painted with shiny silver paint.

  • The distance between the thermometer and the heater was the same as in the first investigation.

  • The room temperature was the same as in the first investigation.

Draw a line on Figure 4 to predict the results for a thermometer painted with shiny silver paint.

8a
1 mark

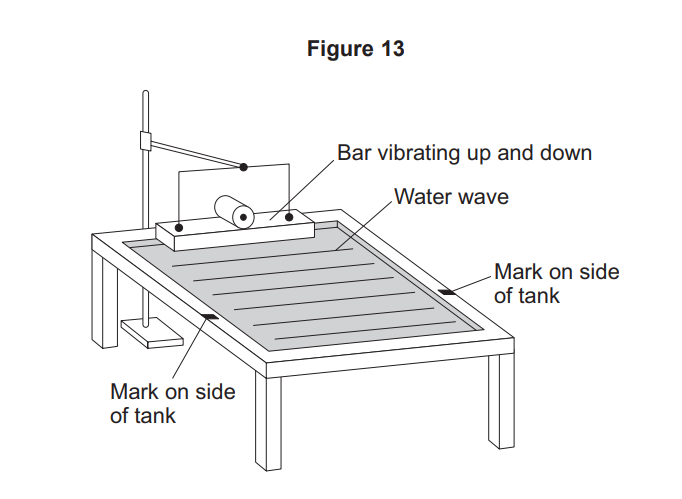
Figure 13 shows a ripple tank used to investigate the behaviour of water waves.

Diagram of a ripple tank with a vibrating bar creating parallel water waves, marked side points on the tank used to observe wave movement.

Water waves are transverse waves.

Complete the sentence.

Choose the answer from the box.

parallel     perpendicular     the same

In transverse waves, the direction of oscillation and the direction of energy transfer are ...............................

8b
4 marks

Describe a method a student could use to determine the frequency of the water waves.

8c
1 mark

Use the Physics Equations Sheet to answer part c and d.

Which equation links frequency (f), wavelength ( λ) and wave speed (v)?

  • v=fλ

  • v=fλ

  • v=f2λ 

8d
Sme Calculator
4 marks

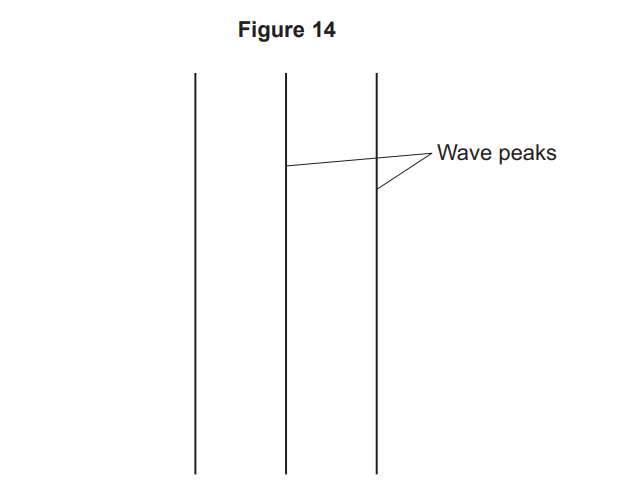
Figure 14 shows the water waves in the ripple tank when viewed from above.

Figure 14 showing three vertical parallel lines with a short diagonal line between the right pair, labelled “Wave peaks” to indicate wave crest positions.

Figure 14 has been drawn to actual size.

The water waves have a frequency of 2.5 Hz.

Calculate the wave speed of the waves in Figure 14.

You should take measurements from Figure 14.

Wave speed = ________m/s

9a
Sme Calculator
2 marks

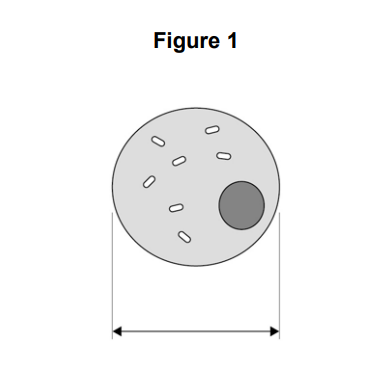
Figure 1 shows a cell viewed through a light microscope.

Diagram of a circular cell labelled Figure 1, showing small internal organelles and a darker circular nucleus, with a horizontal double‑headed arrow for diameter.

The size of the real cell is 0.03 mm.

Calculate the magnification of the microscope.

Use Figure 1 to help you answer.

Magnification = _______________

9b
1 mark

A light microscope uses light waves to observe objects.

Light waves can be modelled using water waves.

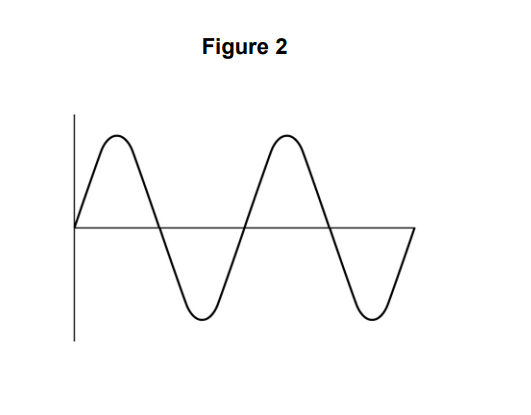
Figure 2 shows a water wave .

Figure 2: simple line graph with horizontal and vertical axes, showing a smooth wave oscillating above and below the central horizontal line

Give one similarity between a light wave and a water wave.

9c
1 mark

Write down the equation that links frequency, wave speed and wavelength.

9d
Sme Calculator
4 marks

The wave in Figure 2 has a wavelength of 75 cm.

The wave moves at a speed of 1.6 m/s.

Calculate the frequency of the wave.

Frequency =_____________ Hz