Velocity-Time Graphs (AQA GCSE Combined Science: Synergy: Physical Sciences): Revision Note
Exam code: 8465

Written by: Ashika
Updated on
Gradient of a Velocity-Time Graph
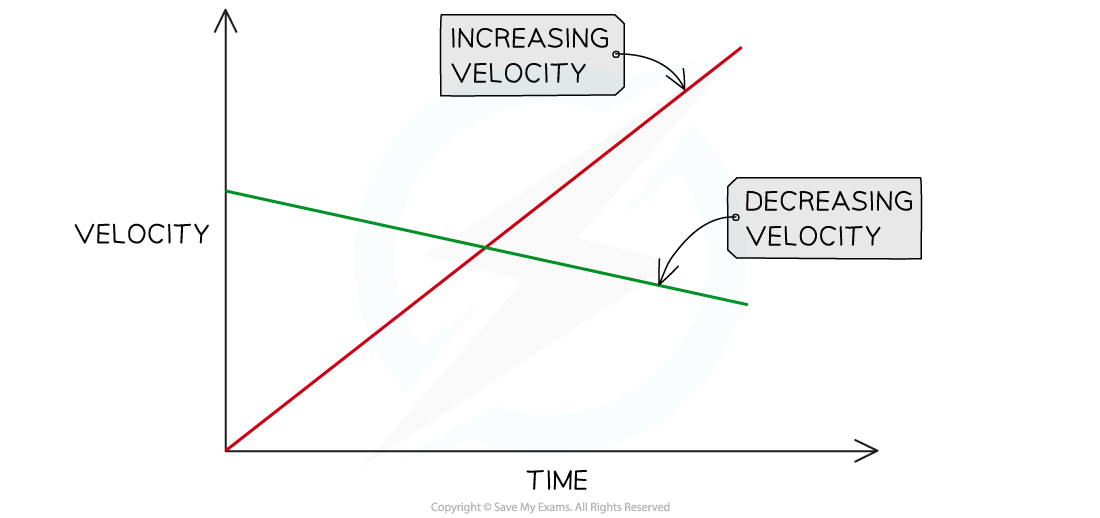
A velocity-time graph shows how the velocity of a moving object varies with time
The red line represents an object with increasing velocity
The green line represents an object with decreasing velocity
Acceleration on a Velocity-Time Graph
Velocity-time graphs also show the following information:
If the object is moving with a constant acceleration/deceleration
The magnitude of the acceleration/deceleration
A straight line represents constant acceleration
The slope of the line represents the magnitude of acceleration
A steep slope means large acceleration (or deceleration) - i.e. the object's speed changes very quickly
A gentle slope means small acceleration (or deceleration) - i.e. the object's speed changes very gradually
A flat line means the acceleration is zero - i.e. the object is moving with a constant velocity

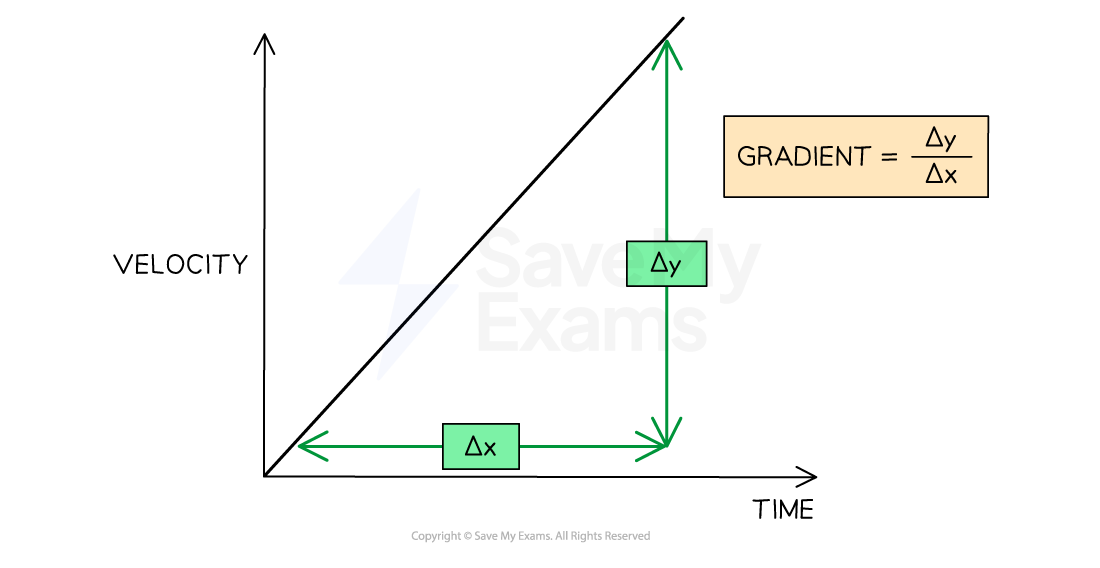
Calculating the Gradient of a Velocity-Time Graph
The acceleration of an object can be calculated from the gradient of a velocity-time graph
Worked Example
A cyclist is training for a cycling tournament.
The velocity-time graph below shows the cyclist's motion as they cycle along a flat, straight road.
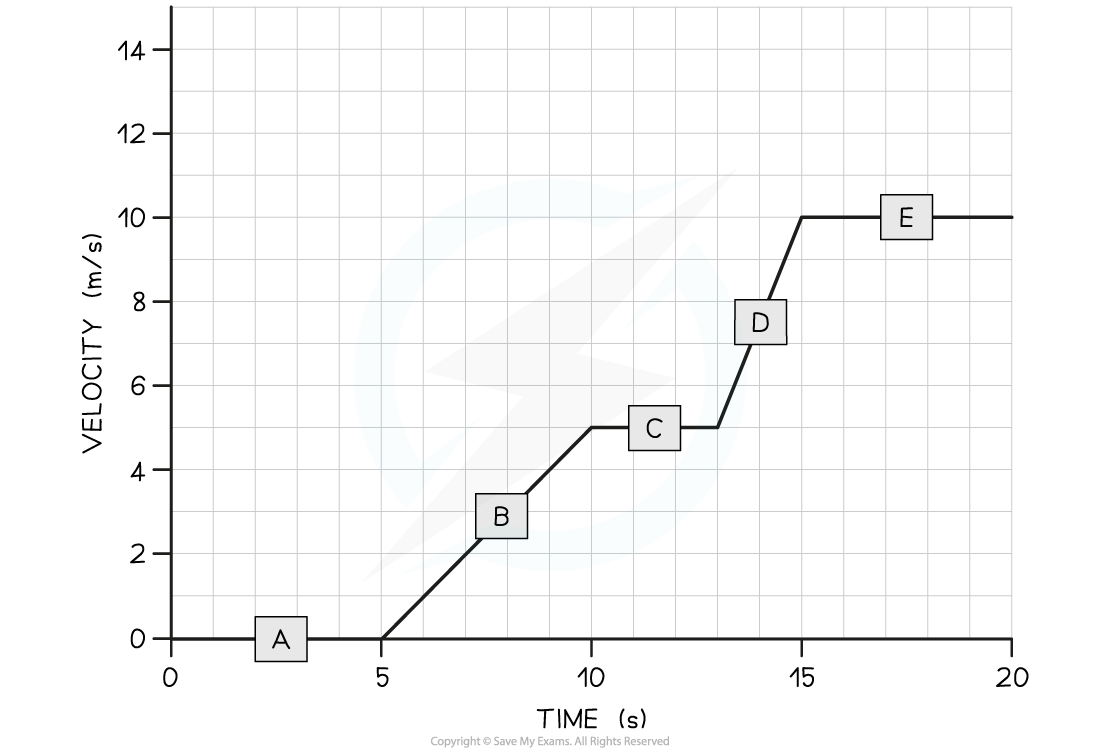
(a) In which section (A, B, C, D, or E) of the velocity-time graph is the cyclist's acceleration the largest?
(b) Calculate the cyclist's acceleration between 5 and 10 seconds.
Answer:
Part (a)
Step 1: Recall that the slope of a velocity-time graph represents the magnitude of acceleration
The slope of a velocity-time graph indicates the magnitude of acceleration
Therefore, the only sections of the graph where the cyclist is accelerating are sections B and D
Sections A, C, and E are flat; in other words, the cyclist is moving at a constant velocity (therefore, not accelerating)
Step 2: Identify the section with the steepest slope
Section D of the graph has the steepest slope
Hence, the largest acceleration is shown in section D
Part (b)
Step 1: Recall that the gradient of a velocity-time graph gives the acceleration
Calculating the gradient of a slope on a velocity-time graph gives the acceleration for that time period
Step 2: Draw a large gradient triangle at the appropriate section of the graph
A gradient triangle is drawn for the time period between 5 and 10 seconds
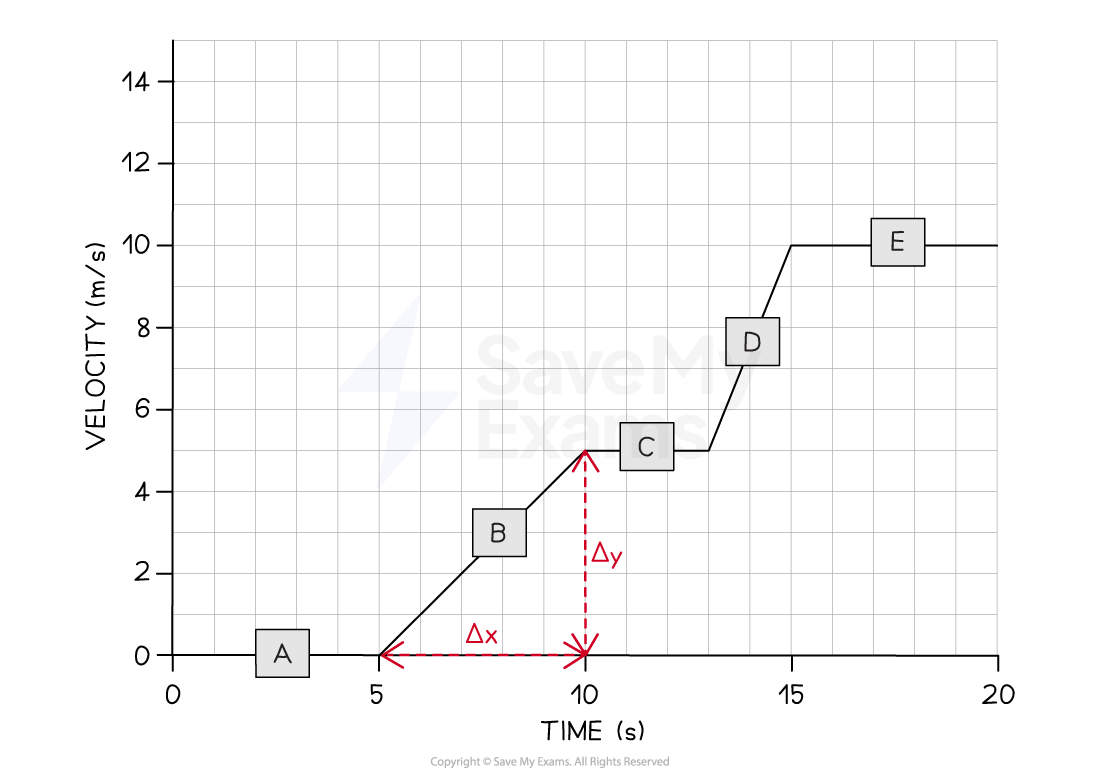
Step 3: Calculate the size of the gradient and state this as the acceleration
The acceleration is given by the gradient, which can be calculated using:
Therefore, the cyclist accelerated at 1 m/s2 between 5 and 10 seconds
Examiner Tips and Tricks
Use the entire slope, where possible, to calculate the gradient. Examiners tend to award credit if they see a large gradient triangle used.
Remember to actually draw the lines directly on the graph itself, particularly when the question asks you to use the graph to calculate the acceleration.
Area Under Velocity-Time Graphs
Higher Tier Only
The area under a velocity-time graph represents the displacement (or distance travelled) by an object
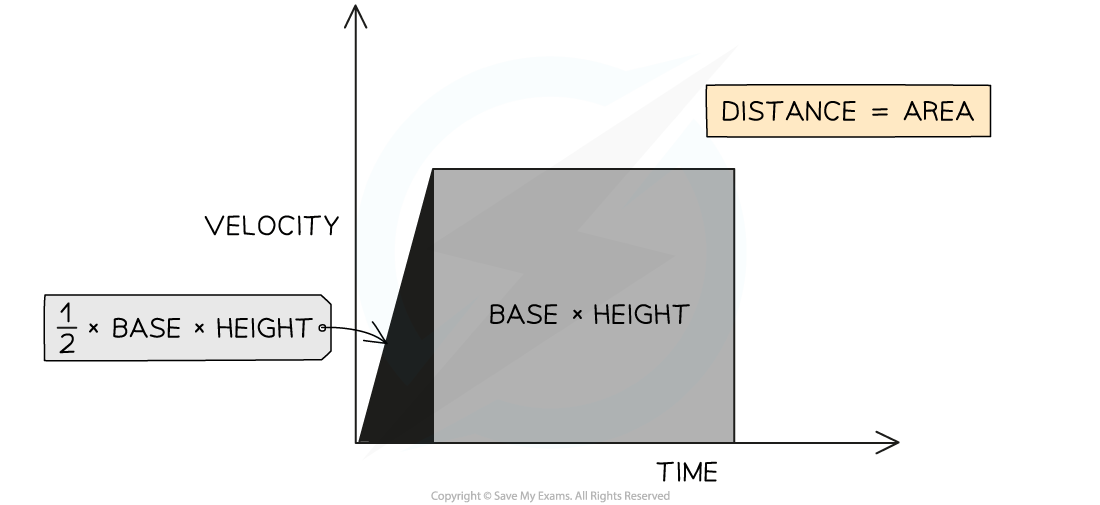
If the area beneath the graph forms a triangle (i.e. the object is accelerating or decelerating), then the area can be determined by using the following formula:
Area = ½ × Base × Height
If the area beneath the graph forms a rectangle (i.e. the object is moving at a constant velocity), then the area can be determined by using the following formula:
Area = Base × Height
Determining Distance
Enclosed areas under velocity-time graphs represent total displacement (or total distance travelled)
If an object moves with constant acceleration, its velocity-time graph will comprise of straight lines
In this case, calculate the distance travelled by working out the area of enclosed rectangles and triangles as in the image above
If an object moves with changing acceleration, its velocity-time graph will be a curve
In this case, estimate the distance travelled by counting the squares underneath the curve
Worked Example
The graph below shows how the velocity of a train changes with time as the train travels along a straight section of the journey.
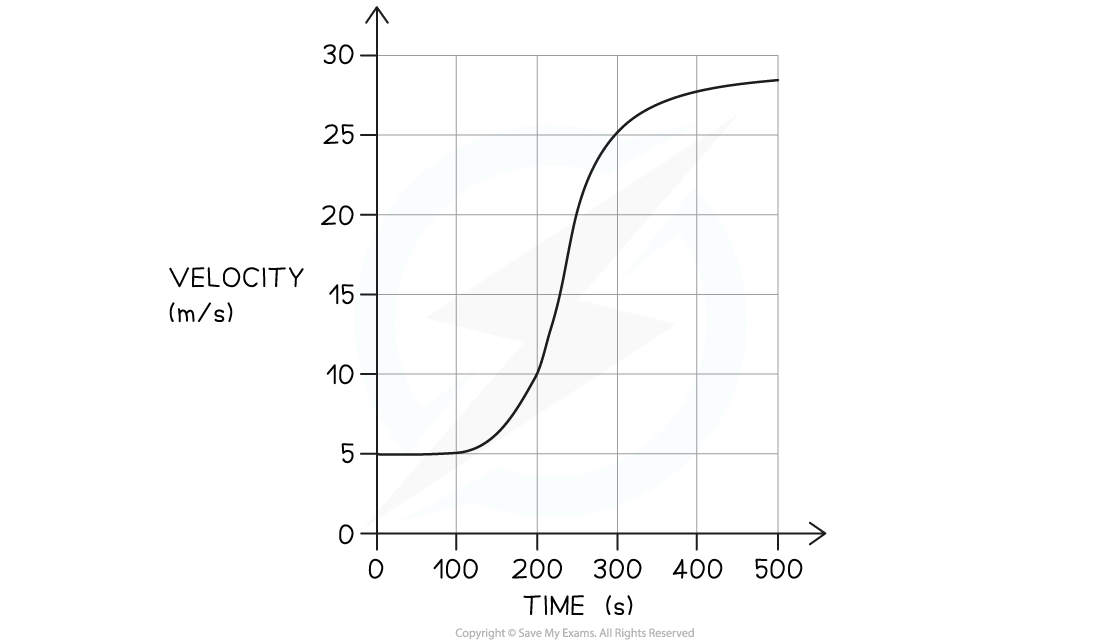
Estimate the distance travelled by the train along this section of the journey.
Answer:
Step 1: Identify whether distance can be determined exactly or by estimation
The train is moving with changing acceleration because the velocity-time graph is a curve
This means the distance should be estimated by counting squares underneath the curve
Step 2: Determine how much distance is represented by each square on the graph
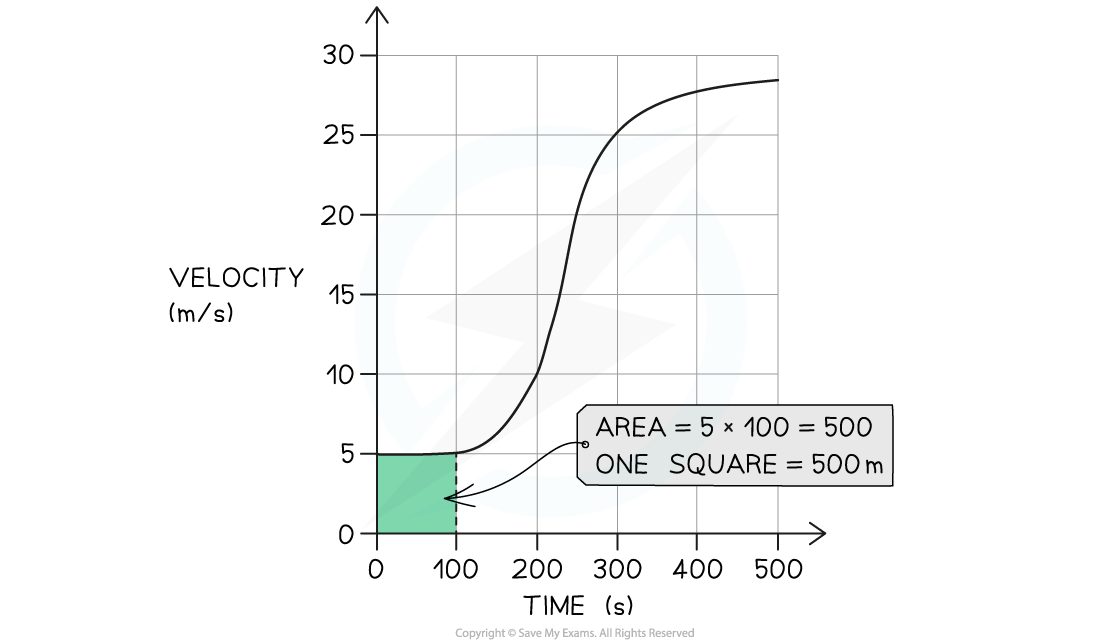
The area of each square on the graph can be calculated by using the equation:
Area = Base × Height
Area = 100 × 5 = 500
Therefore, the distance represented by each square is 500 m
Step 3: Write down the total number of squares underneath the curve
There are approximately 17 squares underneath the curve (including non-whole squares)
Step 4: Determine the total estimated distance
The total estimated distance is found by multiplying the number of squares by the distance represented by each square:
Total estimated distance = Number of squares × Distance represented by each square
Total estimated distance = 17 × 500 = 8500 m
Worked Example
The velocity-time graph below shows a car journey which lasts for 160 seconds.
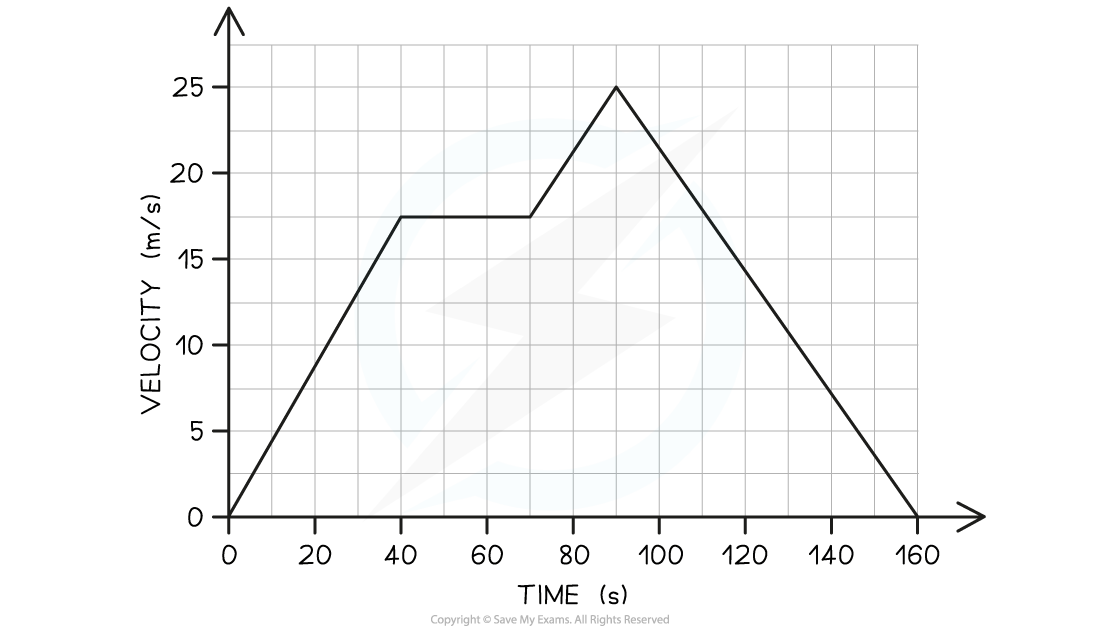
Calculate the total distance travelled by the car on this journey.
Answer:
Step 1: Recall that the area under a velocity-time graph represents the distance travelled
In order to calculate the total distance travelled, the total area underneath the line must be determined
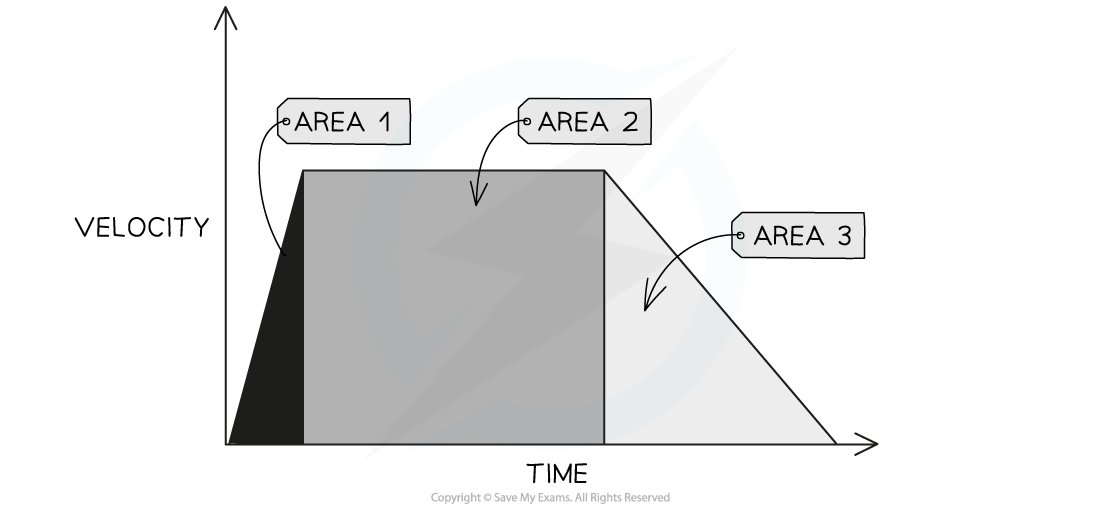
Step 2: Identify each enclosed area
In this example, there are five enclosed areas under the line
These can be labelled as areas 1, 2, 3, 4 and 5, as shown in the image below:
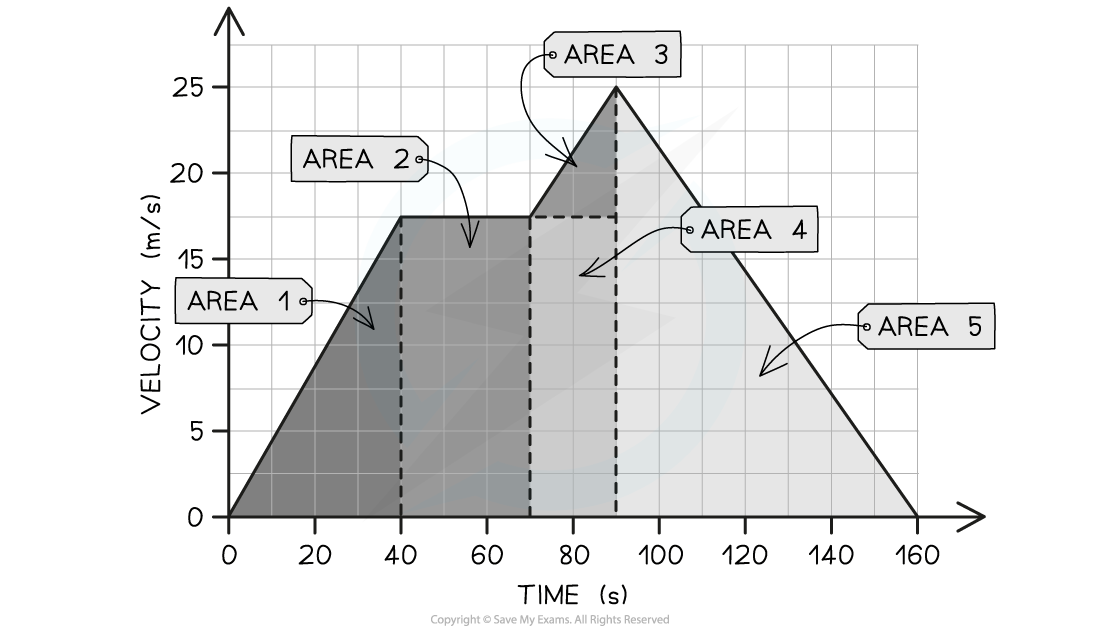
Step 3: Calculate the area of each enclosed shape under the line
Area 1 = area of a triangle = ½ × base × height = ½ × 40 × 17.5 = 350 m
Area 2 = area of a rectangle = base × height = 30 × 17.5 = 525 m
Area 3 = area of a triangle = ½ × base × height = ½ × 20 × 7.5 = 75 m
Area 4 = area of a rectangle = base × height = 20 × 17.5 = 350 m
Area 5 = area of a triangle = ½ × base × height = ½ × 70 × 25 = 875 m
Step 4: Calculate the total distance travelled by finding the total area under the line
Add up each of the five areas enclosed:
total distance = 350 + 525 + 75 + 350 + 875
total distance = 2175 m
Examiner Tips and Tricks
Whenever you are asked to determine the distance using a velocity-time graph, start by stating that the distance = the area under the graph. A common mistake is to try and find distance by using the equation for speed, distance and time - but this equation will not work if the object's speed is changing. In this case, you can only estimate the distance travelled by approximating the area under the graph (counting squares).

Unlock more, it's free!
Join the 100,000+ Students that ❤️ Save My Exams
the (exam) results speak for themselves:

Was this revision note helpful?