11 mark
The bumper car collides with a stationary barrier and stops.
What happens to the velocity of the bumper car during the collision?
Was this exam question helpful?
Exam code: 8465
The bumper car collides with a stationary barrier and stops.
What happens to the velocity of the bumper car during the collision?
Was this exam question helpful?
A student investigated how the acceleration of a glider varied with the force causing the acceleration.
Figure 18 shows the equipment used.
The air blower allows the glider to move along the air-track with almost no friction.
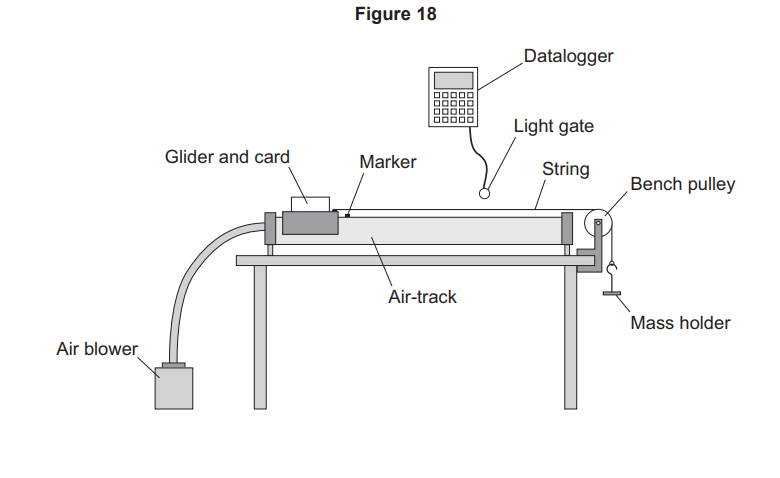
This is the method used.
Line up the front of the glider with the marker.
Release the glider.
Record the velocity as the glider passes through the light gate.
Repeat steps 1 to 3 using different masses on the mass holder.
The student calculated the weight of each mass to determine the force causing the acceleration.
Which measurements does the datalogger need to calculate the velocity of the glider?
The length of the card and the time taken to pass the light gate
The length of the string and the length of the card
The length of the string and the mass of the glider
The mass of the glider and the time taken to pass the light gate
Table 3 shows one set of results from the investigation.
Table 3
Mass on holder in kilograms | Change in velocity in m/s | Time in seconds |
|---|---|---|
0.025 | 0.50 | 0.40 |
Calculate the acceleration of the glider.
Use the equation:
Figure 19 shows the results.
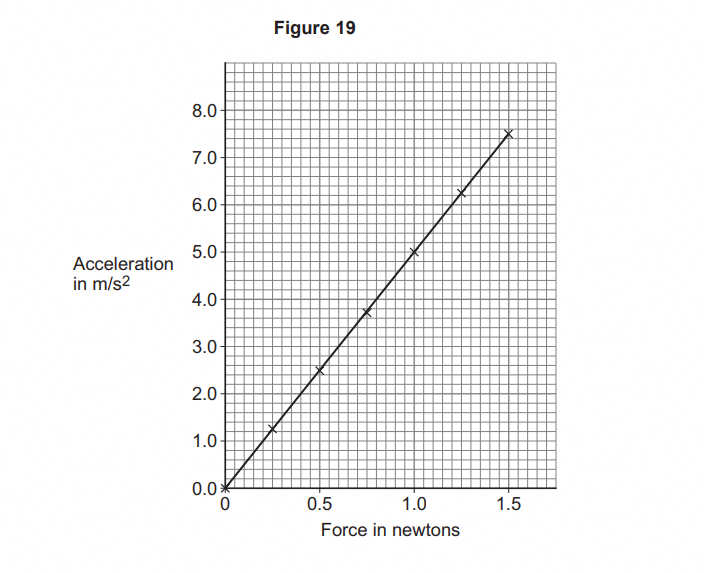
What conclusion can the student make from the results in Figure 19?
Give a reason for your answer.
Another student used a wooden block pulled along a wooden board instead of a glider on an air-track.
Figure 20 shows the wooden block.
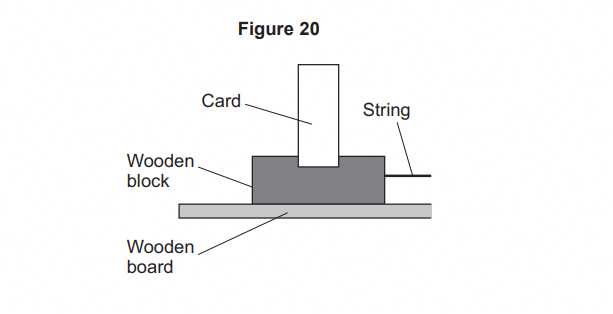
How would the friction between the wooden block and the wooden board compare with the friction between the glider and the air-track?
The friction between the wooden block and the wooden board would be lower.
The friction between the wooden block and the wooden board would be the same.
The friction between the wooden block and the wooden board would be greater.
Was this exam question helpful?
Figure 2 shows a boat on the sea.
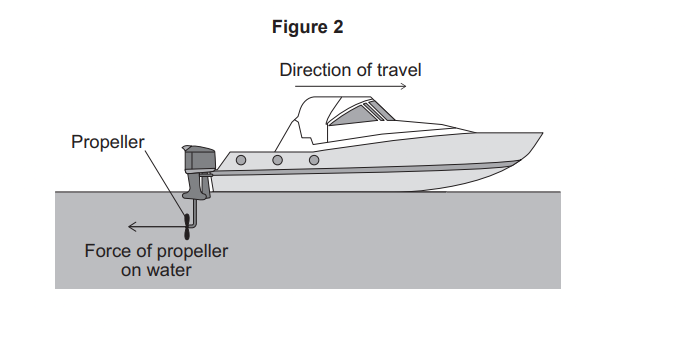
The boat is travelling at a constant speed.
Draw an arrow on Figure 2 to show the size and direction of the force of the water on the propeller.
A quantity can be a scalar quantity or a vector quantity.
Identify which quantities are scalar quantities and which quantities are vector quantities.
Tick (✓) one box in each row.
Quantity | Scalar | Vector |
|---|---|---|
Speed | ||
Velocity | ||
Mass | ||
Weight |
Which equation links distance , speed and time ?
The speed of the boat is 12 m/s.
Calculate the time taken to travel 6000 m.
Use the Physics Equations Sheet.
Figure 3 shows the forces acting on the boat when it is moving at a constant speed.
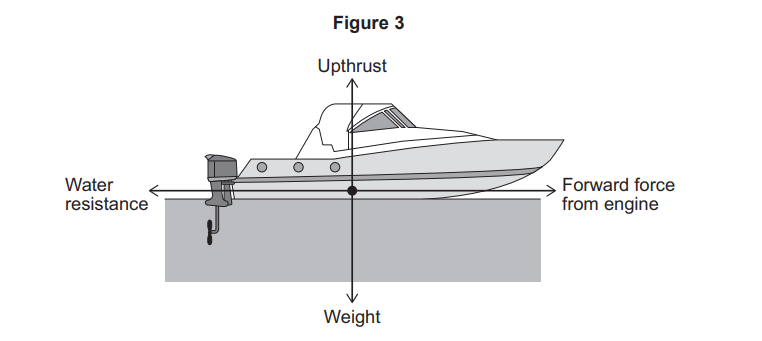
The engine of the boat is turned off. The boat slows down and stops.
Explain what happens to the forces acting on the boat.
Was this exam question helpful?
Figure 7 shows a student driving a bumper car at a theme park.
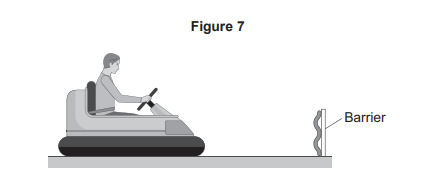
Figure 8 shows how the speed of the bumper car changed during a time of 20 seconds.
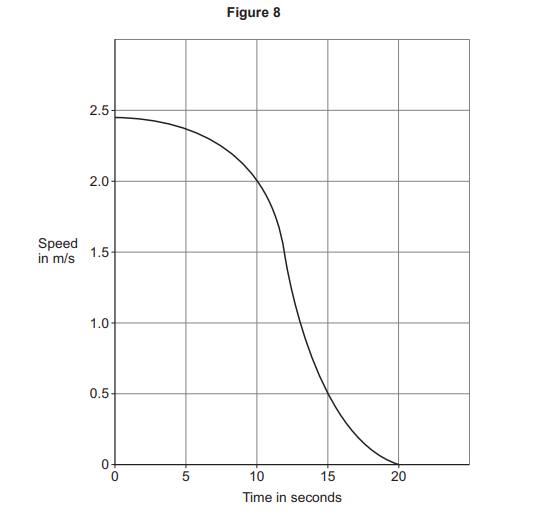
Estimate the distance travelled by the bumper car during the 20 seconds.
A bumper car collides with a stationary barrier and stops.
The student is wearing a seatbelt.
Explain how the seatbelt stops the student moving.
When the bumper car collided with the barrier, the bumper car came to a stop in a time of 600 ms.
The deceleration of the student was 2.0 m/s².
Calculate the initial velocity of the student.
Use the Physics Equations Sheet.
Was this exam question helpful?
The stopping distance of a vehicle depends on the thinking distance and the braking distance.
What is meant by 'braking distance'?
The thinking distance travelled by a vehicle depends on the reaction time of the driver.
Using a mobile phone increases a driver's reaction time.
A mobile phone can be used in these ways:
typing a text message
making a phone call while holding the phone
making a hands-free phone call using the car's audio system.
Figure 1 shows how different activities using a mobile phone affect a driver’s reaction time.
Figure 1
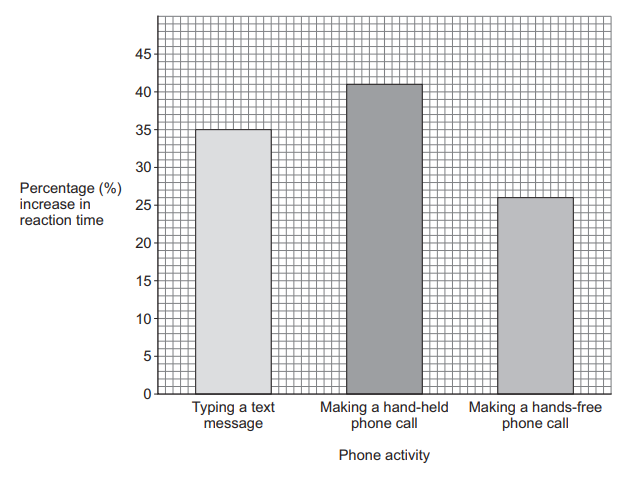
The reaction time of a typical driver is 0.50 s.
Calculate the reaction time of a typical driver typing a text message while driving.
The legal alcohol limit is the maximum amount of alcohol a person can have in the bloodstream and still legally drive.
The reaction time of a typical driver at the legal alcohol limit is increased by 12%.
A student suggests that it should be illegal to use a mobile phone in any way while driving.
Explain how the information in Figure 1 supports the student's suggestion.
Was this exam question helpful?
The student opened the switch and placed a paper clip near the electromagnet.
When the switch was closed, the paper clip accelerated towards the electromagnet.
Use the Physics Equations Sheet to answer questions 3.4 and 3.5.
Write down the equation which links acceleration (a), mass (m) and resultant force (F).
The initial resultant force on the paper clip was 4.8 × 10⁻³ N.
Calculate the initial acceleration of the paper clip.
mass of paper clip = 4.0 × 10⁻⁴ kg
Was this exam question helpful?
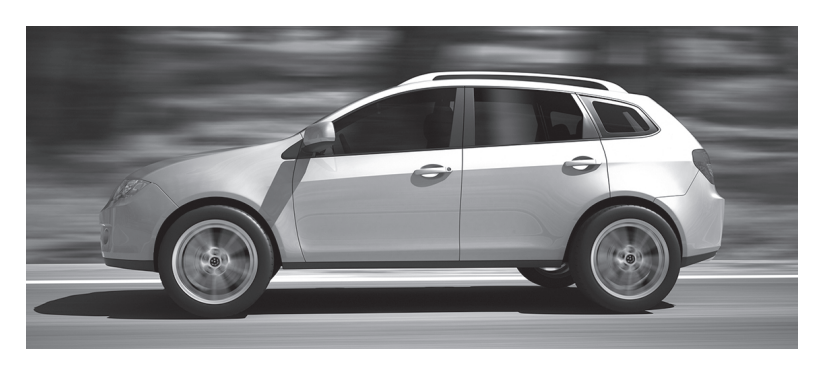
FIGURE 12 People going on a journey in an electric car.
FIGURE 12
The current in the electric motor of the car is 200 A.
The resistance of the motor is 1.75 Ω.
Calculate the power of the motor.
Use the equation:
The car travelled at a constant speed of 12.5 m/s for 600 seconds of the journey.
Calculate the distance travelled during this time.
Use the equation:
The car travelled from town P to town Q.
FIGURE 13 shows the route taken by the car.
FIGURE 13
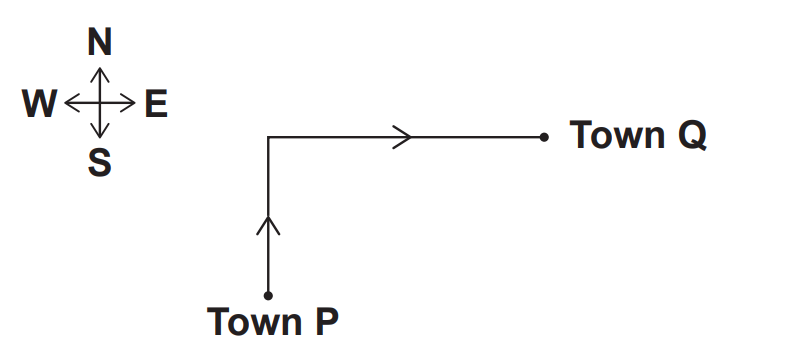
FIGURE 13 is drawn to a scale of 1 cm = 5 km.
Determine the distance in km travelled by the car as it moves from town P to town Q.
Use FIGURE 13.
The displacement of the car at the end of the journey is the straight-line distance and the direction from town P to town Q.
What is the angle of the displacement of the car from north at the end of the journey?
30°
60°
90°
Use the Physics Equations Sheet to answer this question.
Write down the equation which links acceleration (a), change in velocity (Δv) and time (t).
At the end of the journey, the car decelerates from a velocity of 24 m/s and stops.
The deceleration of the car was 4.0 m/s2.
Calculate the time taken for the car to decelerate and stop.
Was this exam question helpful?
The stopping distance of a vehicle depends on the thinking distance and the braking distance.
What is meant by ‘thinking distance’?
Tick (✓) one box.
The distance travelled before a vehicle stops.
The distance travelled while the driver reacts.
The time taken for a driver to react.
The time taken for the vehicle to stop.
What would increase the braking distance of a vehicle?
Tick (✓) one box.
Ice on the road surface
Sunny weather
Using a mobile phone while driving
What is the name of the force which causes the vehicle to decelerate when the brakes are applied?
Tick (✓) one box.
Friction
Upthrust
Weight
Figure 1 shows how the braking distance of two cars varies with speed.
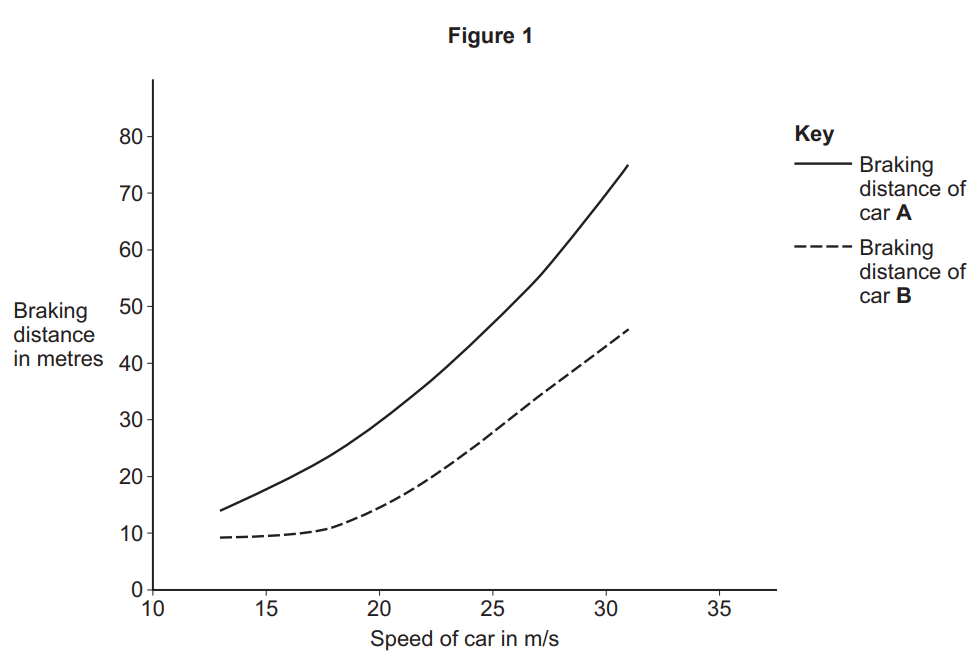
How does the braking distance of the two cars vary with speed?
Tick (✓) one box.
The braking distance decreases as speed increases.
The braking distance is not affected by speed.
The braking distance increases as speed increases.
Which two variables should be kept the same to make a fair comparison of the braking distance of the two cars?
Tick (✓) two boxes.
The age of the driver
The caffeine intake of the driver
The colour of the car
The number of people in the car
The type of road surface
The mass of each car was 850 kg.
At one speed the deceleration of one of the cars was 10.7 m/s².
Calculate the mean braking force on the car.
Use the equation:
Mean braking force = _________________N
Table 1 shows the braking force on each car at a speed of 31 m/s.
Table 1
Car | Braking force in N |
A | 5450 |
B | 8880 |
The braking distance of car A was longer than the braking distance of car B at a speed of 31 m/s.
Explain why.
Use data from Table 1.
Was this exam question helpful?
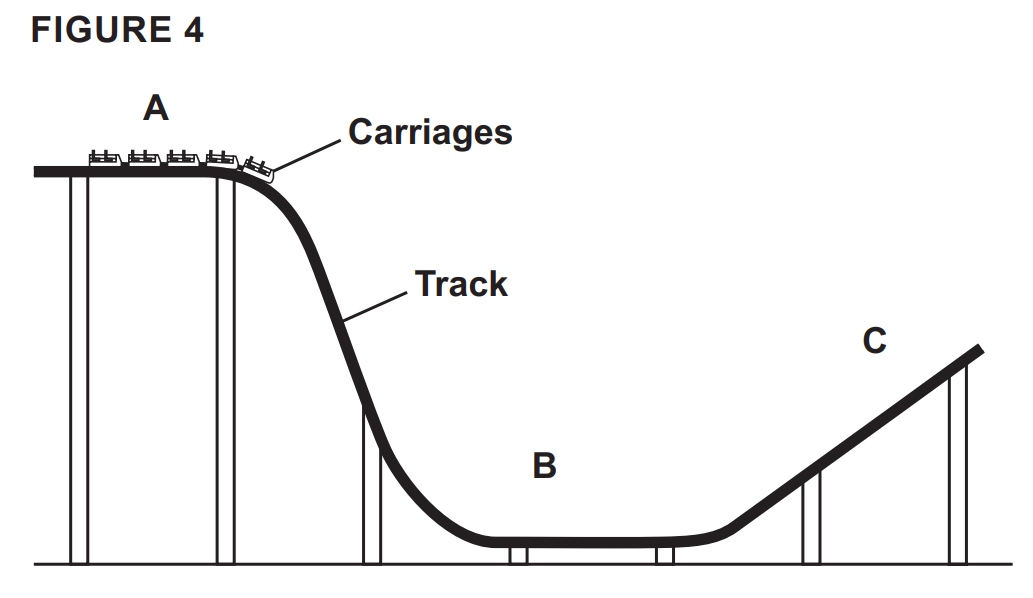
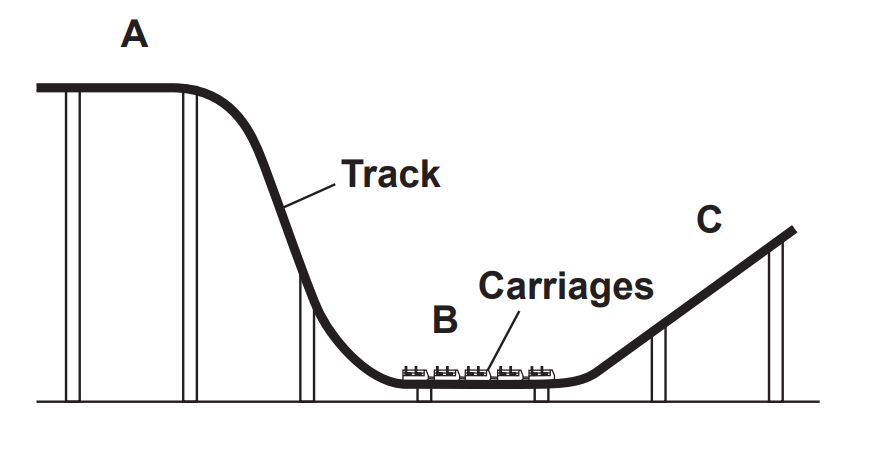
FIGURE 4 shows part of a roller coaster ride in a theme park.
The roller coaster carriages move along the track from position A to position C.
Use the Physics Equations Sheet to answer Questions 02.1 and 02.2.
Which equation links kinetic energy ($E_k$), mass ($m$) and speed ($v$)?
Tick (✓) ONE box.
FIGURE 5 shows how the speed of the carriages changed as the carriages moved along the track from position A to position B.
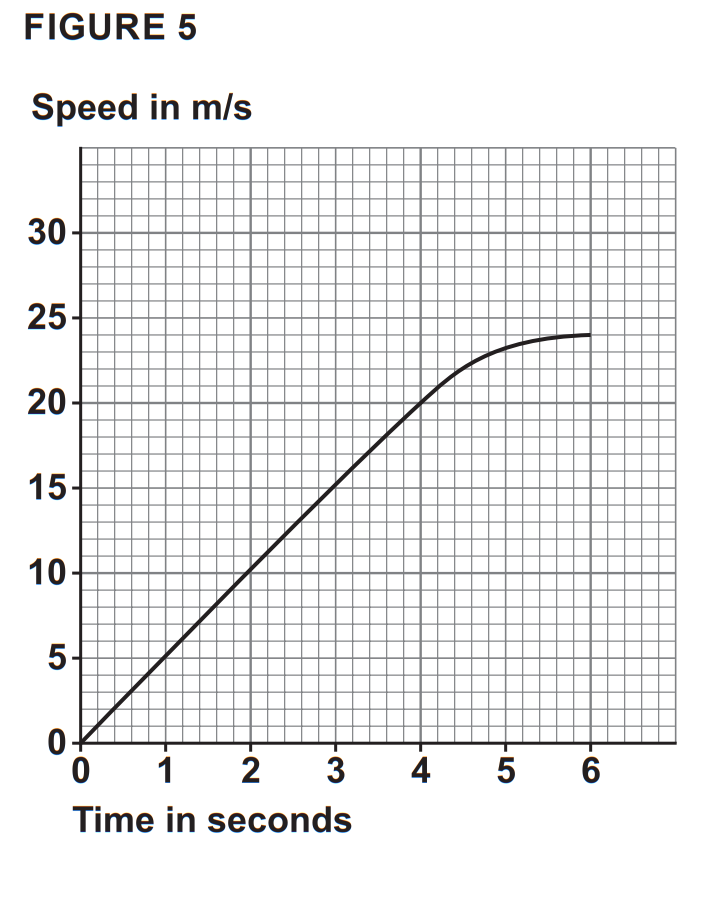
The kinetic energy of the carriages at 6.0 seconds was 900 000 J.
Calculate the mass of the carriages.
Mass = ______________________ kg
FIGURE 6 shows the carriages at position B on the track.
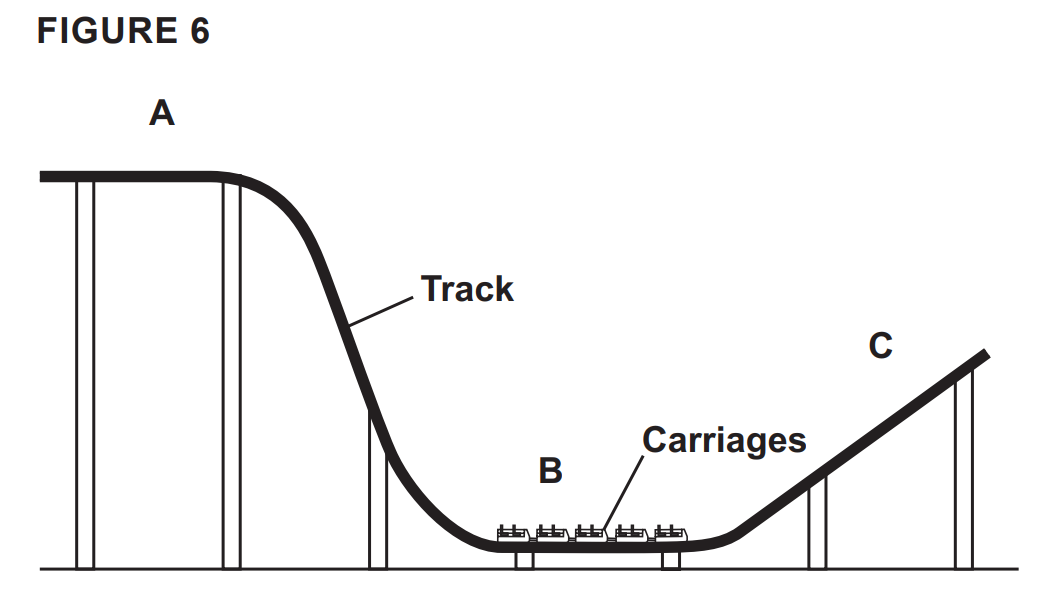
Why does the speed of the carriages decrease as they move along the track from position B to position C?
Tick (✓) ONE box.
Gravitational potential energy is transferred to kinetic energy.
Kinetic energy is transferred to gravitational potential energy.
Thermal energy is transferred from the surroundings to the carriages.
Brakes are used to stop the carriages at the end of the ride.
Explain why water on the brakes affects the distance the carriages travel after the brakes are applied.
Was this exam question helpful?
FIGURE 17 shows part of a roller coaster ride in a theme park.
FIGURE 17
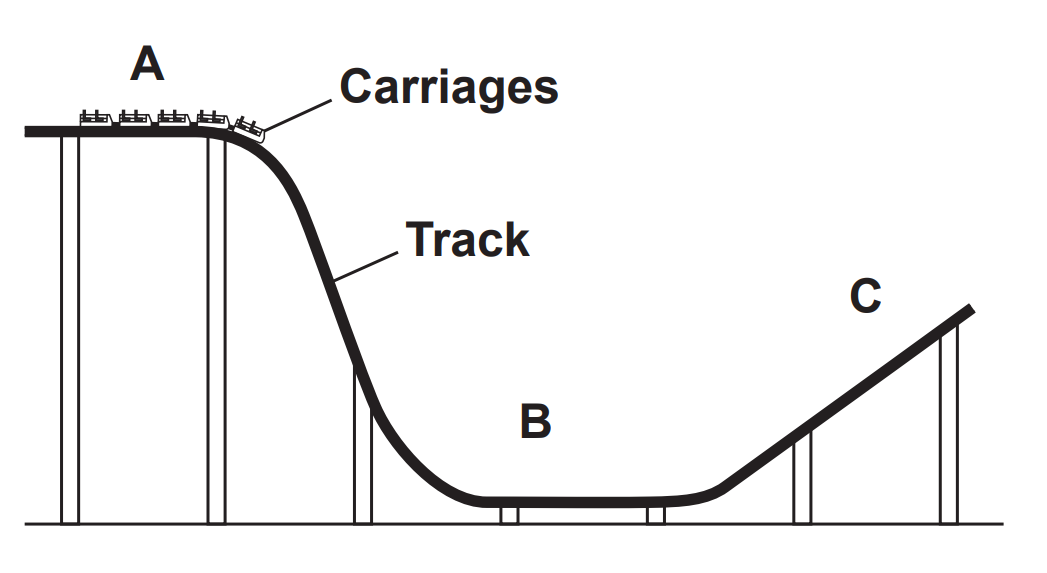
The roller coaster carriages move along the track from position A to position C.
Use the Physics Equations Sheet to answer this question.
Which equation links kinetic energy (Ek), mass (m) and speed (v)?
FIGURE 18 shows how the speed of the carriages changed as the carriages moved along the track from position A to position B.
FIGURE 18
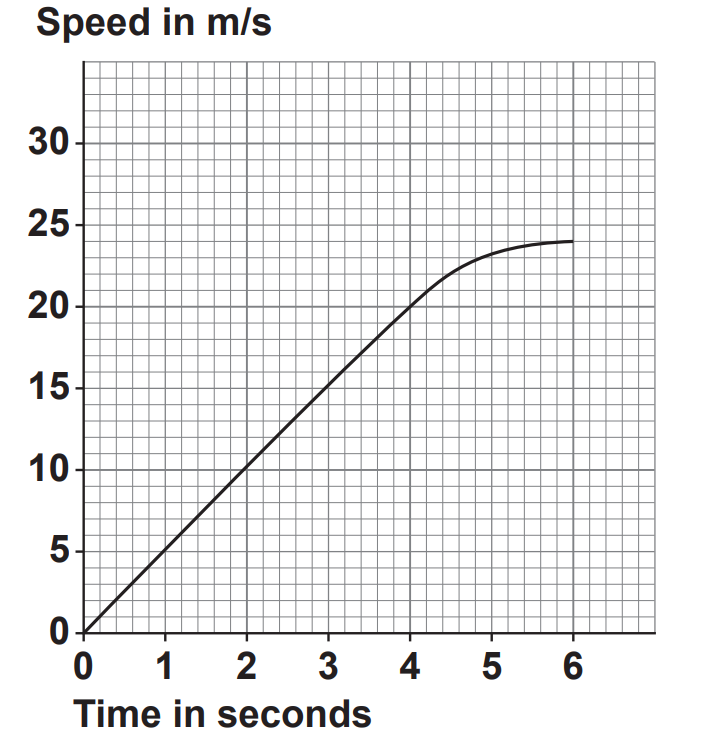
The kinetic energy of the carriages at 6.0 seconds was 900 000 J.
Calculate the mass of the carriages.
Use FIGURE 18.
Mass = ______________________ kg
FIGURE 19 shows the carriages at position B on the track.
FIGURE 19
Why does the speed of the carriages decrease as they move along the track from position B to position C?
Gravitational potential energy is transferred to kinetic energy.
Kinetic energy is transferred to gravitational potential energy.
Thermal energy is transferred from the surroundings to the carriages.
Brakes are used to stop the carriages at the end of the ride.
Explain why water on the brakes affects the distance the carriages travel after the brakes are applied.
The brakes are made of a material with a high thermal conductivity.
Explain what is meant by 'high thermal conductivity'.
Was this exam question helpful?
A student threw a ball vertically upwards into the air.
Figure 10 is a velocity-time graph of the ball’s motion after leaving the student’s hand until the ball reaches maximum height.
Air resistance has been ignored.
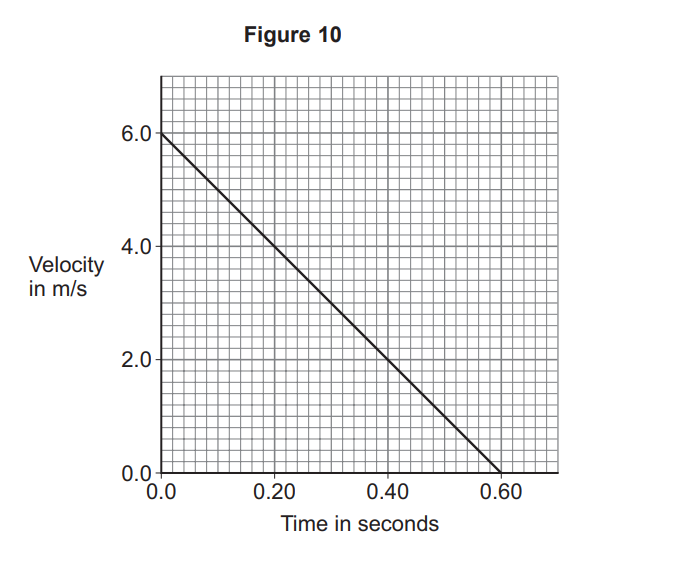
The maximum height is equal to the area between the line and the horizontal axis.
Calculate the maximum height reached by the ball.
Use Figure 10.
Maximum height = ______________m
Calculate the gradient of the line in Figure 10.
Use the equation:
Gradient = ______________
What does the gradient of the line in Figure 10 represent?
Tick (✓) one box.
The deceleration of the ball.
The distance travelled by the ball.
The speed of the ball.
In Figure 10 air resistance was ignored.
What would happen to the motion of the ball in Figure 10 if air resistance was included?
Tick (✓) two boxes.
The deceleration would be greater.
The final speed would be greater.
The initial kinetic energy would be less.
The initial velocity would be less.
The maximum height of the ball would be less.
The student threw a second ball vertically upwards into the air.
The maximum height reached by the second ball was 5.0 m.
The student caught the ball at the same height that the ball was thrown from.
The displacement of the ball is the straight-line distance between the start height and the end height.
What is the total distance the ball travels?
Tick (✓) one box.
0.0 m
5.0 m
10.0 m
What is the displacement of the ball when the student catches the ball?
Tick (✓) one box.
0.0 m
5.0 m
10.0 m
Was this exam question helpful?
FIGURE 12 shows people going on a journey in a car.
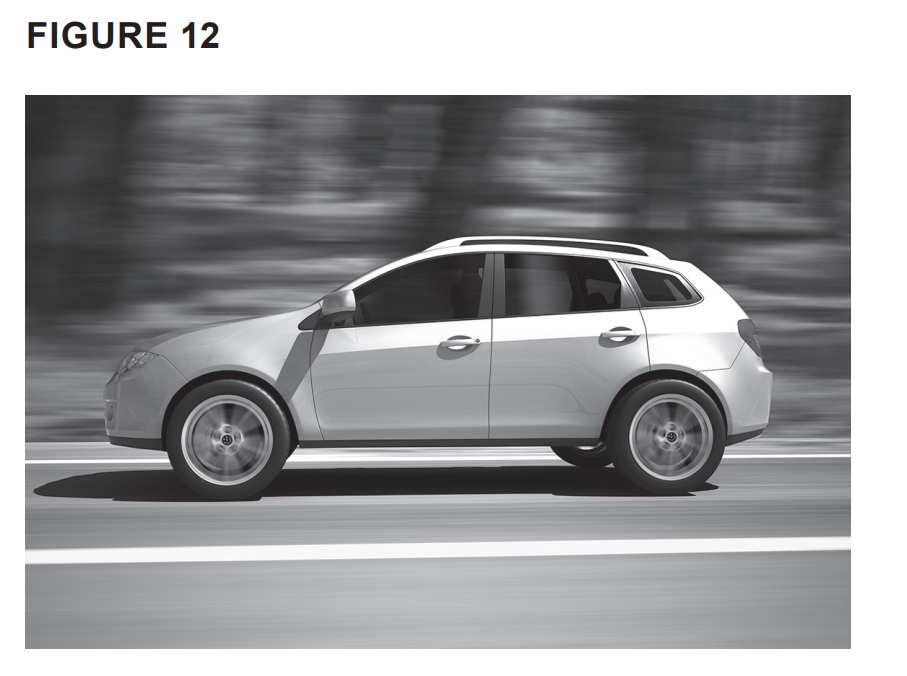
The distance the car travels is not the same as the displacement of the car from the start position.
Explain why.
Explain how wearing a seatbelt reduces the risk of injury if the car stops suddenly.
Include a reference to Newton's first law in your answer.
Airbags are a safety feature that are fitted to most cars.
FIGURE 13 shows a crash test dummy being used to test the safety of a car.
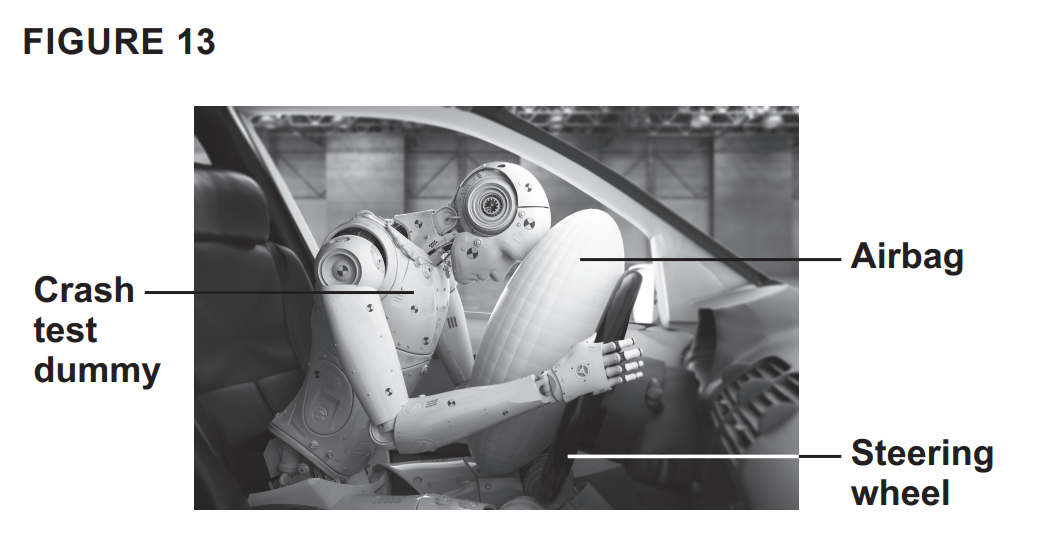
Two crash test dummies are travelling in a car which stops suddenly.
Both dummies continue to move forward when the car stops.
Dummy A: collides with an airbag and stops.
Dummy B: collides with the steering wheel and stops.
TABLE 1 shows the time taken for the two dummies to stop moving.
TABLE 1
DUMMY | TIME TAKEN FOR DUMMY TO STOP IN SECONDS |
A: collides with an airbag | 0.120 |
B: collides with the steering wheel | 0.040 |
Explain how the deceleration of dummy A compares with the deceleration of dummy B.
Was this exam question helpful?
A student throws a ball vertically upwards in the air and catches the ball as it returns.
FIGURE 18 is a velocity-time graph of the ball's motion after leaving the student's hand until the ball is caught.
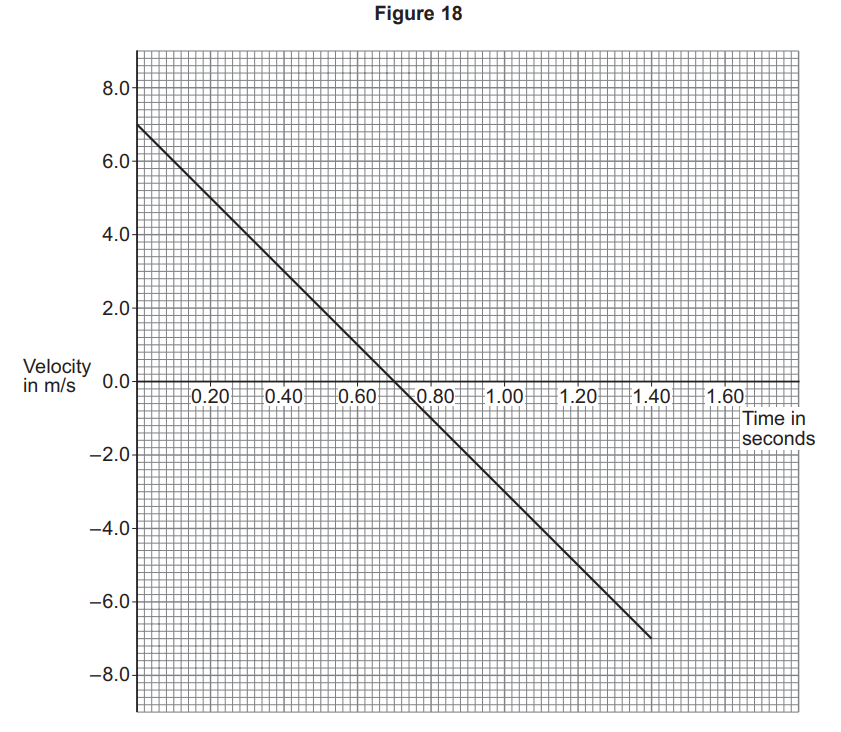
Determine the maximum height the ball reaches.
The distance the ball travels when moving upwards is equal to the distance the ball travels when moving downwards.
Explain how FIGURE 18 shows that the two distances are equal.
FIGURE 18 does not include the effect that air resistance would have on the ball when it is in motion.
The graph in FIGURE 18 is a straight line with a constant gradient.
Explain why the gradient is constant.
Describe two ways the graph would change between 0.0 and 0.70 seconds if the effect of air resistance had been included.
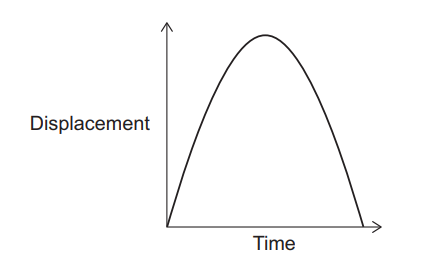
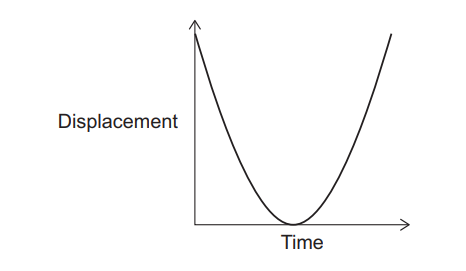
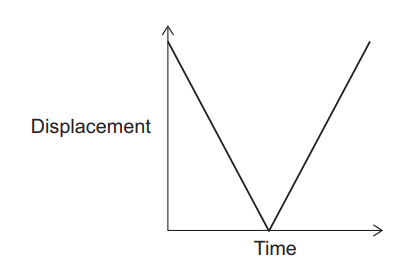
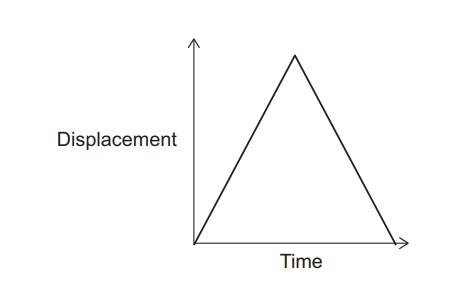
Which displacement-time graph represents the ball's motion after leaving the student's hand until the ball is caught?
Tick (✓) one box.
Was this exam question helpful?
FIGURE 10 shows a karate expert breaking a wooden board with one hand.
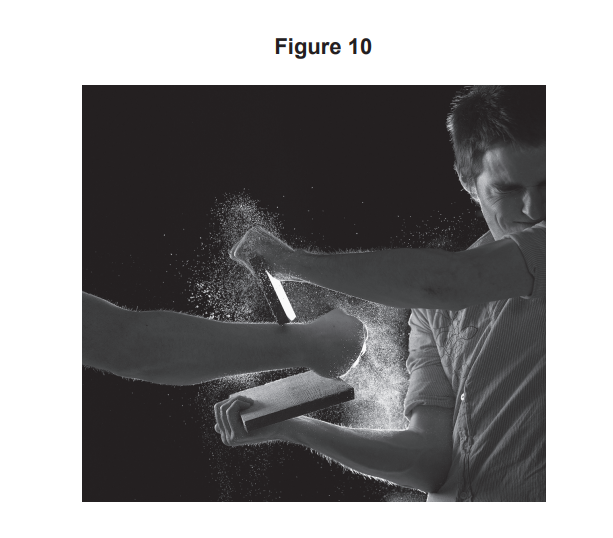
When the hand hits the wooden board, the initial velocity of the hand is 7.5 m/s.
The change in momentum of the hand is 5.0 kg m/s.
The mass of the hand is 0.80 kg.
Calculate the final velocity of the hand.
Use the Physics Equations Sheet.
As the hand exerts a force on the wooden board, the wooden board exerts a force on the hand.
Explain how Newton's third law applies to the hand hitting the wooden board.
FIGURE 11 shows the hand hitting the wooden board. When the hand hits the wooden board, the wooden board bends.
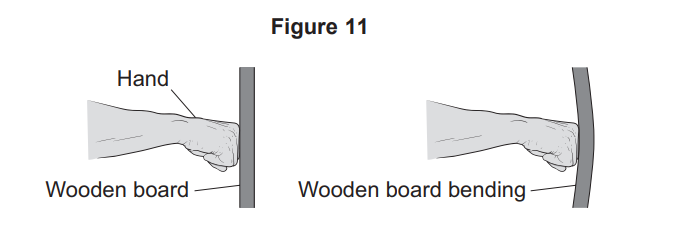
When the hand hits the wooden board, the hand moves through a distance of 1.2 cm while exerting a force on the wooden board.
The work done by the hand is 6.0 J.
Calculate the force the hand exerts on the wooden board.
Use the Physics Equations Sheet.
Was this exam question helpful?
Figure 1 shows two people wearing inflatable bodysuits.
The bodysuits are made of soft plastic and are inflated with air.
The inflatable bodysuits allow the two people to collide with each other safely.
Figure 1: Two people each wearing a large rounded inflatable bodysuit.
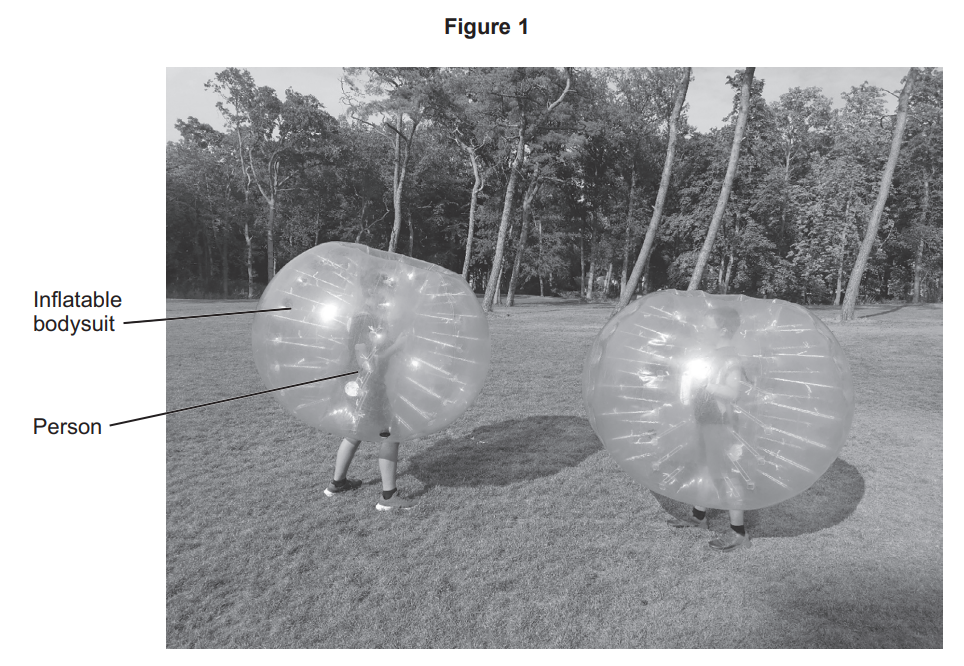
The two people run towards each other before colliding and coming to a stop.
People wearing bodysuits take more time to stop during a collision than people not wearing bodysuits.
How does wearing bodysuits affect the deceleration of the people during the collision?
Tick (✓) one box.
The deceleration is less.
The deceleration is the same.
The deceleration is greater.
How does wearing bodysuits affect the impact force experienced by each person during the collision?
Tick (✓) one box.
The impact force is less.
The impact force is the same.
The impact force is greater.
Figure 2 shows person A about to collide with person B.
Figure 2: Person A (mass 60 kg) moving towards Person B with a speed of 3.0 m/s.
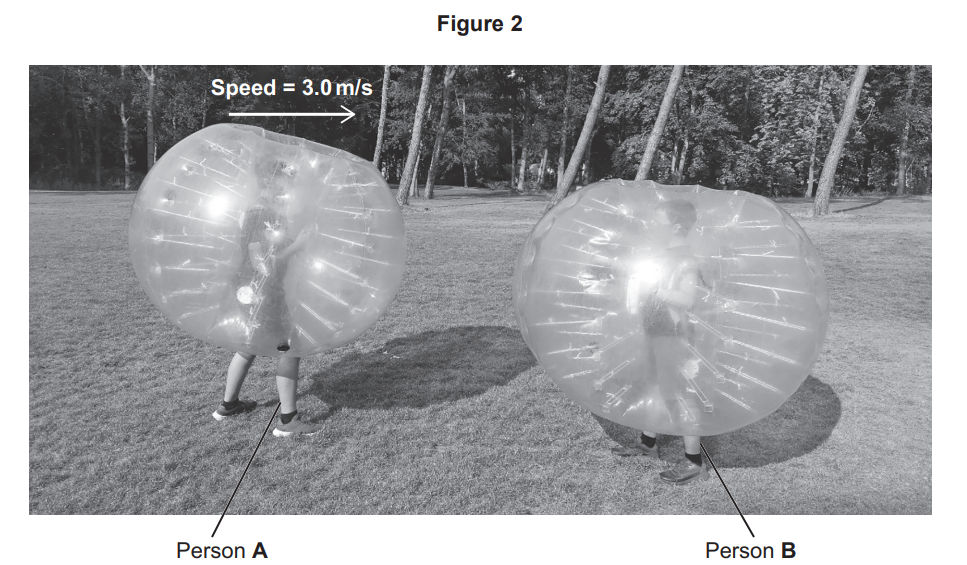
Person A has a mass of 60 kg.
Person A moves with a speed of 3.0 m/s.
Calculate the kinetic energy of person A.
Use the equation:
kinetic energy = 0.5 × mass × (speed)²
After the collision, person B has 45 J of kinetic energy.
Person B has a mass of 40 kg.
Calculate the speed of person B after the collision.
Use the equation:
speed = √((2 × kinetic energy) / mass)
Speed = _____________________m/s
Figure 3 shows a person in an inflatable sphere rolling down a hill.
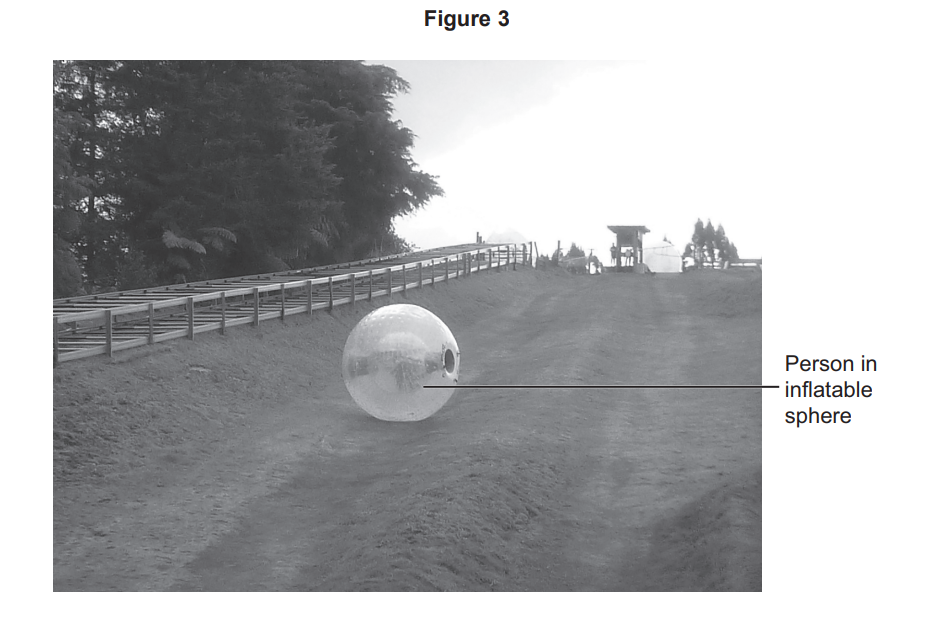
Describe how the gravitational potential energy and kinetic energy of the person vary as the sphere rolls down the hill.
Was this exam question helpful?
A skydiver jumped out of a helicopter.
Figure 4 shows a distance–time graph for the first 12 seconds of the skydiver's fall.
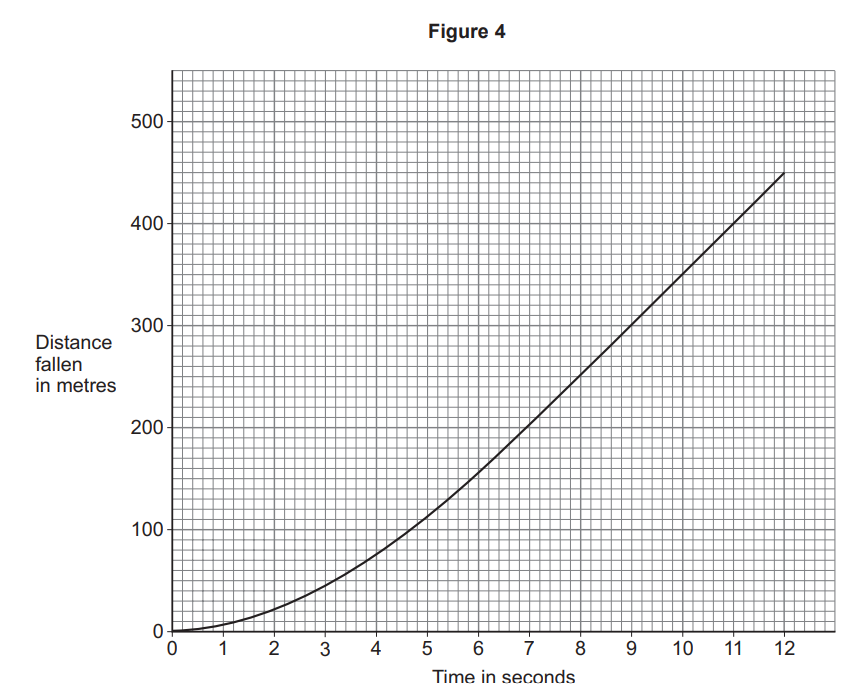
How does Figure 4 show that the speed of the skydiver increased between 1 second and 6 seconds?
Tick (✓) one box.
The gradient decreases
The gradient stays the same
The gradient increases
What happened to the speed of the skydiver between 8 seconds and 12 seconds?
Use Figure 4.
Tick (✓) one box.
The speed decreased
The speed stayed the same
The speed increased
Determine the mean speed of the skydiver between 0 seconds and 12 seconds.
Use Figure 4 and the equation:
Mean speed = __________________ m/s
What happened to the air resistance acting on the skydiver as the speed of the skydiver increased?
Tick (✓) one box.
Air resistance decreased
Air resistance stayed the same
Air resistance increased
The skydiver reached terminal velocity.
How did the forces acting on the skydiver compare at terminal velocity?
Tick (✓) one box.
Weight > air resistance
Weight = air resistance
Weight < air resistance
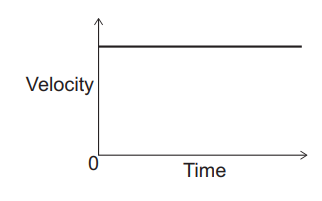
Which of the following shows the velocity–time graph for the skydiver falling at terminal velocity?
Tick (✓) one box.
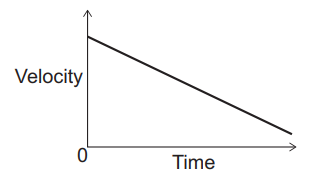
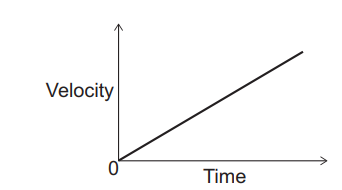
The skydiver decelerated when the parachute opened.
The initial resultant force on the skydiver was 960 N.
The mass of the skydiver was 64 kg.
Calculate the initial deceleration of the skydiver.
Use the equation:
Choose the unit from the box.
m/s | m/s² | s/m² |
Deceleration = _____________ Unit _____________
Was this exam question helpful?
Figure 14 shows a velocity–time graph for a remote-controlled car.
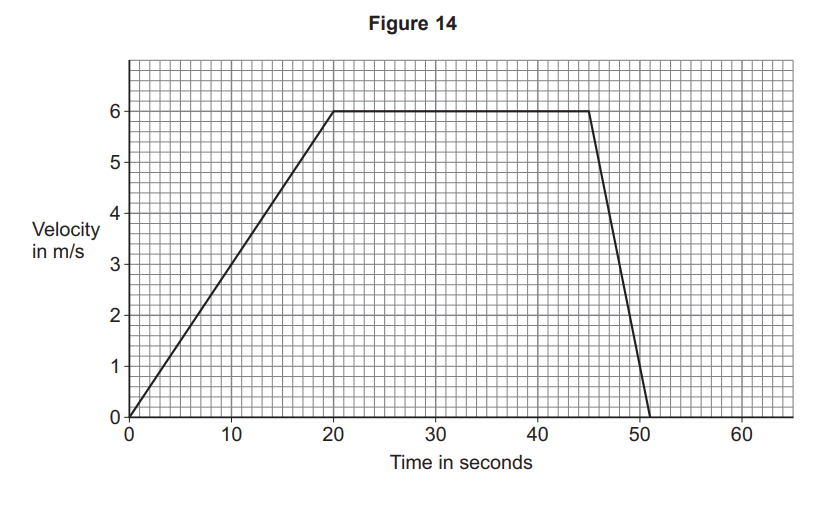
Determine the acceleration of the car between 0 and 20 seconds.
Use the Physics Equations Sheet.
Acceleration = _____________________ m/s2
Determine the distance travelled by the car between 20 seconds and 45 seconds.
Use the Physics Equations Sheet.
How does the deceleration of the car compare with the acceleration of the car?
Use Figure 14.
Give one reason for your answer.
Tick (✓) one box.
The deceleration was greater than the acceleration.
The deceleration was the same as the acceleration.
The deceleration was less than the acceleration.
Another remote-controlled car travelled a distance of 80 m while accelerating from 0 m/s to 16 m/s.
Calculate the acceleration of this car.
Use the Physics Equations Sheet.
Was this exam question helpful?
Figure 2 shows a velocity–time graph for a remote-controlled car.
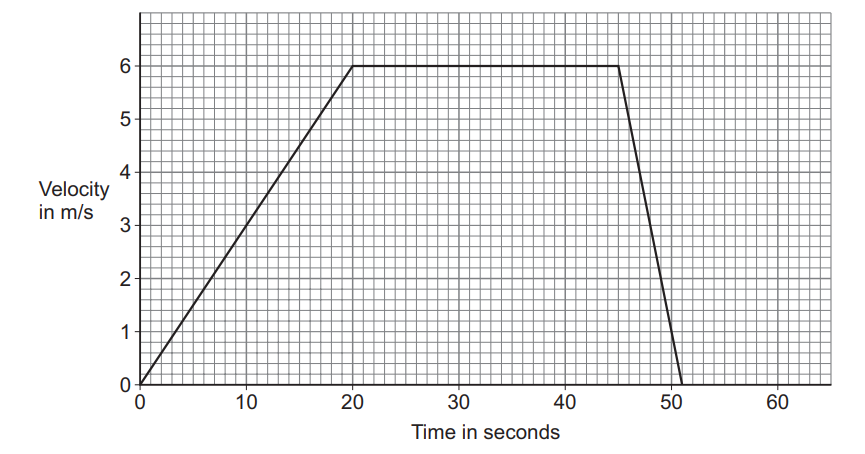
Determine the acceleration of the car between 0 and 20 seconds.
Use the Physics Equations Sheet.
Determine the distance travelled by the car between 20 seconds and 45 seconds.
Use the Physics Equations Sheet.
How does the deceleration of the car compare with the acceleration of the car?
Use Figure 2.
Give one reason for your answer.
Tick (✓) one box.
□ The deceleration was greater than the acceleration.
□ The deceleration was the same as the acceleration.
□ The deceleration was less than the acceleration.
Reason: ............
Another remote-controlled car travelled a distance of 80 m while accelerating from 0 m/s to 16 m/s.
Calculate the acceleration of this car.
Use the Physics Equations Sheet.
Was this exam question helpful?
Figure 7 shows two people wearing inflatable bodysuits.
The bodysuits are made of soft plastic and are inflated with air.
The bodysuits reduce the chance of injury in a collision.
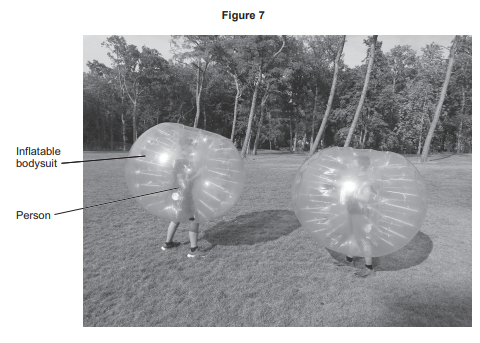
Explain how wearing a bodysuit reduces the chance of injury in a collision.
Figure 8 shows person A about to collide with person B.
Figure 8
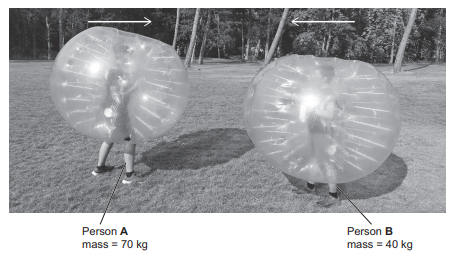
The velocity of person A is +2.0 m/s.
The two people collide and stop.
Calculate the velocity of person B before the collision.
Use the Physics Equations Sheet.
Figure 9 shows a person in an inflatable sphere rolling down a hill.
Figure 9
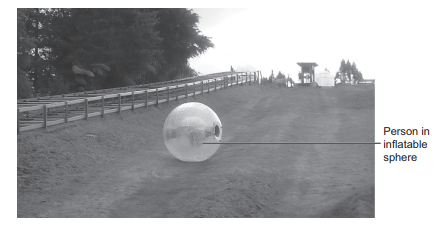
The total mass of the person and sphere is 80 kg.
The sphere moves through a vertical height of 6.4 m.
Gravitational field strength = 9.8 N/kg
Calculate the maximum possible speed of the sphere at the bottom of the hill.
Use the Physics Equations Sheet.
The actual speed of the sphere at the bottom of the hill is much less than the maximum possible speed.
Explain why.
Was this exam question helpful?
A skydiver jumped out of a helicopter.
Figure 8 shows a distance-time graph for the first 12 seconds after the skydiver jumped out of the helicopter.
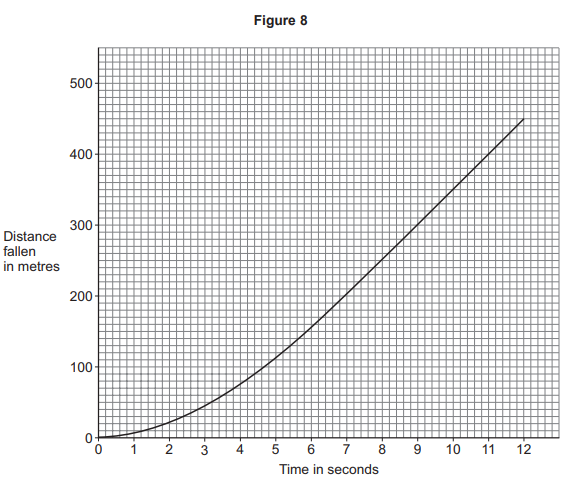
Determine the speed of the skydiver between 8 and 12 seconds.
Use the Physics Equations Sheet.
Describe how the motion of the skydiver changed between 0 and 12 seconds.
Explain why the resultant force on the skydiver changed as the skydiver fell.
Which of the velocity–time graphs shows how the velocity of the skydiver changed after the parachute was opened?
Tick (✓) one box.
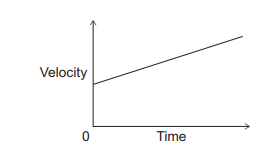
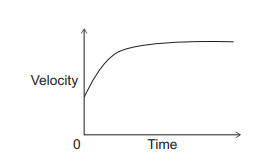
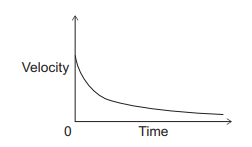
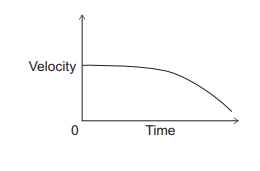
Was this exam question helpful?
This question is about speed.
What is a typical value for the speed of sound?
Tick (✓) one box.
3.3 m/s
3.3 × 10² m/s
3.3 × 10³ m/s
3.3 × 10⁶ m/s
Figure 2 shows a distance–time graph of a car
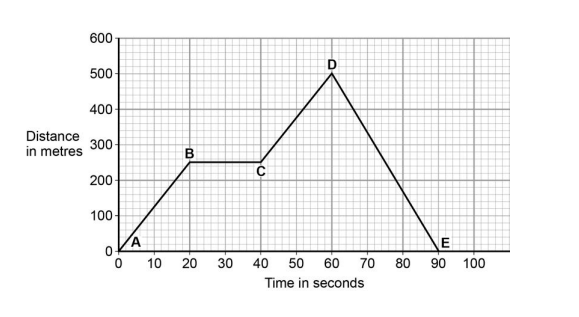
Explain what Figure 2 shows about the motion of the car between point A and point E.
You should use values from Figure 2 in your answer.
The kinetic energy of a moving car depends on the car's mass and speed.
Write down the equation that links kinetic energy, mass and speed.
A car has a mass of 1 650 kg.
Table 1 shows the kinetic energy of the car moving at 11 m/s.
Table 1
Mass of car in kg | Speed in m/s | Kinetic energy in J |
|---|---|---|
1 650 | 11 | 99 825 |
1 650 | 30 | ? |
Calculate the missing value in Table 1.
Give your answer in kilojoules (kJ).
Kinetic energy = __________ kJ
A man is driving his car at a constant speed on a wet road.
He sees a fallen tree on the wet road and tries to stop quickly to prevent an accident.
Figure 3 shows the scenario (image of a road blocked by a fallen tree not reproduced here due to third party copyright restrictions).
Explain why the man may not be able to stop in time.
Was this exam question helpful?
Figure 4 shows an ice skater standing on the ice.
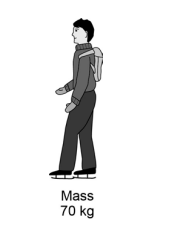
Write down the equation that links acceleration, change in velocity and time.
As the skater pushes away across the ice there is a small frictional force.
After pushing, the skater starts to move with a velocity of 5 m/s.
He slows to 3 m/s in 6 seconds.
Calculate the acceleration of the skater.
Acceleration = ___________m/s²
Write down the equation that links acceleration, force and mass.
Friction reduces the speed of the skater.
(Take the mass of the skater to be 70 kg.)
Calculate the frictional force acting on the skater to slow him down.
Frictional force = __________ N
The skater stands still on the ice.
He throws his bag to a friend.
As he throws his bag forwards, the skater moves backwards across the ice.
Use the idea of conservation of momentum to explain why he moves backwards.
Was this exam question helpful?
This question is about forces, quantities and vectors.
Write down the equation that links gravitational field strength, mass and weight.
A white ball with mass 143 g is moving at a velocity of 7.9 m/s.
It collides with a red ball with mass of 150 g.
The red ball is stationary before the collision. The white ball stops after the collision.
Calculate the velocity of the red ball after the collision.
Give your answer to two significant figures.
Velocity of red ball = __________m/s
The white ball is thrown high into the air.
After it is released the ball moves up and then back down in a vertical line.
The free body force diagram in Figure 6 shows the forces on the ball at one point in its flight.
The force arrows are drawn to scale.
Figure 6
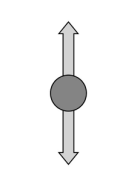
Explain what is happening to the ball at this point in its flight.
Was this exam question helpful?