Diagram Skills (AQA A Level Economics): Revision Note
Exam code: 7136

Why diagrams matter
Diagrams are one of the main ways economists explain cause and effect
A good diagram shows the change and its impact at a glance
Diagrams in 9-mark questions
Diagrams matter most in the 9-mark questions on Papers 1 and 2
Every 9-mark question asks you to answer "With the help of a diagram" (occasionally "a suitable diagram")
AQA's mark scheme expects a Level 3 answer to include a relevant diagram that will, at the top of this level, be accurate and used appropriately
At Level 1, a diagram that is not used and/or is inaccurate is a sign of a weak answer
Diagrams in 15-mark and 25-mark questions
In 15-mark and 25-mark questions, a diagram is not required, but it is rewarded
The mark schemes state that "the use of relevant diagrams to support analysis should be taken into account when assessing the quality of a candidate's response"
Examiners note that although a diagram is not necessary for full marks, most of the better responses successfully integrated an accurate diagram which helped to develop the analysis further
So aim to include at least one relevant diagram whenever the topic lends itself to it
An unused diagram still shows some application, but it adds little to your answer
A diagram you explain and refer to becomes part of your analysis and lifts your mark
Diagrams in Paper 3 multiple-choice questions (MCQs)
In Paper 3 multiple-choice questions, you will often need to read a diagram, or choose between four diagrams
The diagrams you are most likely to need
Paper 1 (micro)
Demand and supply, including shifts and price controls
Externalities marginal social cost (MSC)/ marginal private cost (MPC), marginal social benefit (MSB)/marginal private benefit (MPB) and welfare loss
Indirect taxes and subsidies
Cost and revenue curves for perfect competition, monopoly and monopolistic competition
Kinked demand curve (oligopoly)
Labour markets, including monopsony, trade unions and the minimum wage
Lorenz curve
Production possibility curve
Paper 2 (macro)
Aggregate demand (AD)/aggregate supply (AS), including shifts in AD, short-run aggregate supply (SRAS) and long-run aggregate supply (LRAS)
Keynesian AS curve
The economic cycle and output gaps
Phillips curves (short run and long run)
Currency market (exchange rate) diagram
Tariffs and other trade restrictions
Drawing accurate diagrams
Use a pencil and a ruler, and draw the diagram large enough to read, e.g. about a third of a page
Every diagram should include:
Feature | Example |
|---|---|
both axes labelled | "Price level" and "Real national output"; "Price (£)" and "Quantity" |
every curve labelled | AD, SRAS, LRAS; D, S, MSC, MPC |
the original position | AD1, equilibrium at P1 and Y1 |
the new position | AD2, equilibrium at P2 and Y2 |
arrows showing the direction of any shift | an arrow from AD1 to AD2 |
dotted lines from each equilibrium to both axes | showing the values P1, P2, Y1, Y2 |
any area you refer to, shaded and labelled | welfare loss, tax revenue, supernormal profit |
Make sure the diagram matches the question
e.g. a question about long-run growth needs LRAS to shift, not just AD
Examiner Tips and Tricks
Accuracy matters more than artistry. A small, neat, fully labelled diagram scores better than a large one with a missing label or a curve that shifts the wrong way.
Using your diagram in your answer
A diagram only earns full credit if it is used
Refer to it directly in your writing, using the labels you have drawn
Explain what causes the curve to shift, then what happens as a result
Worked Example
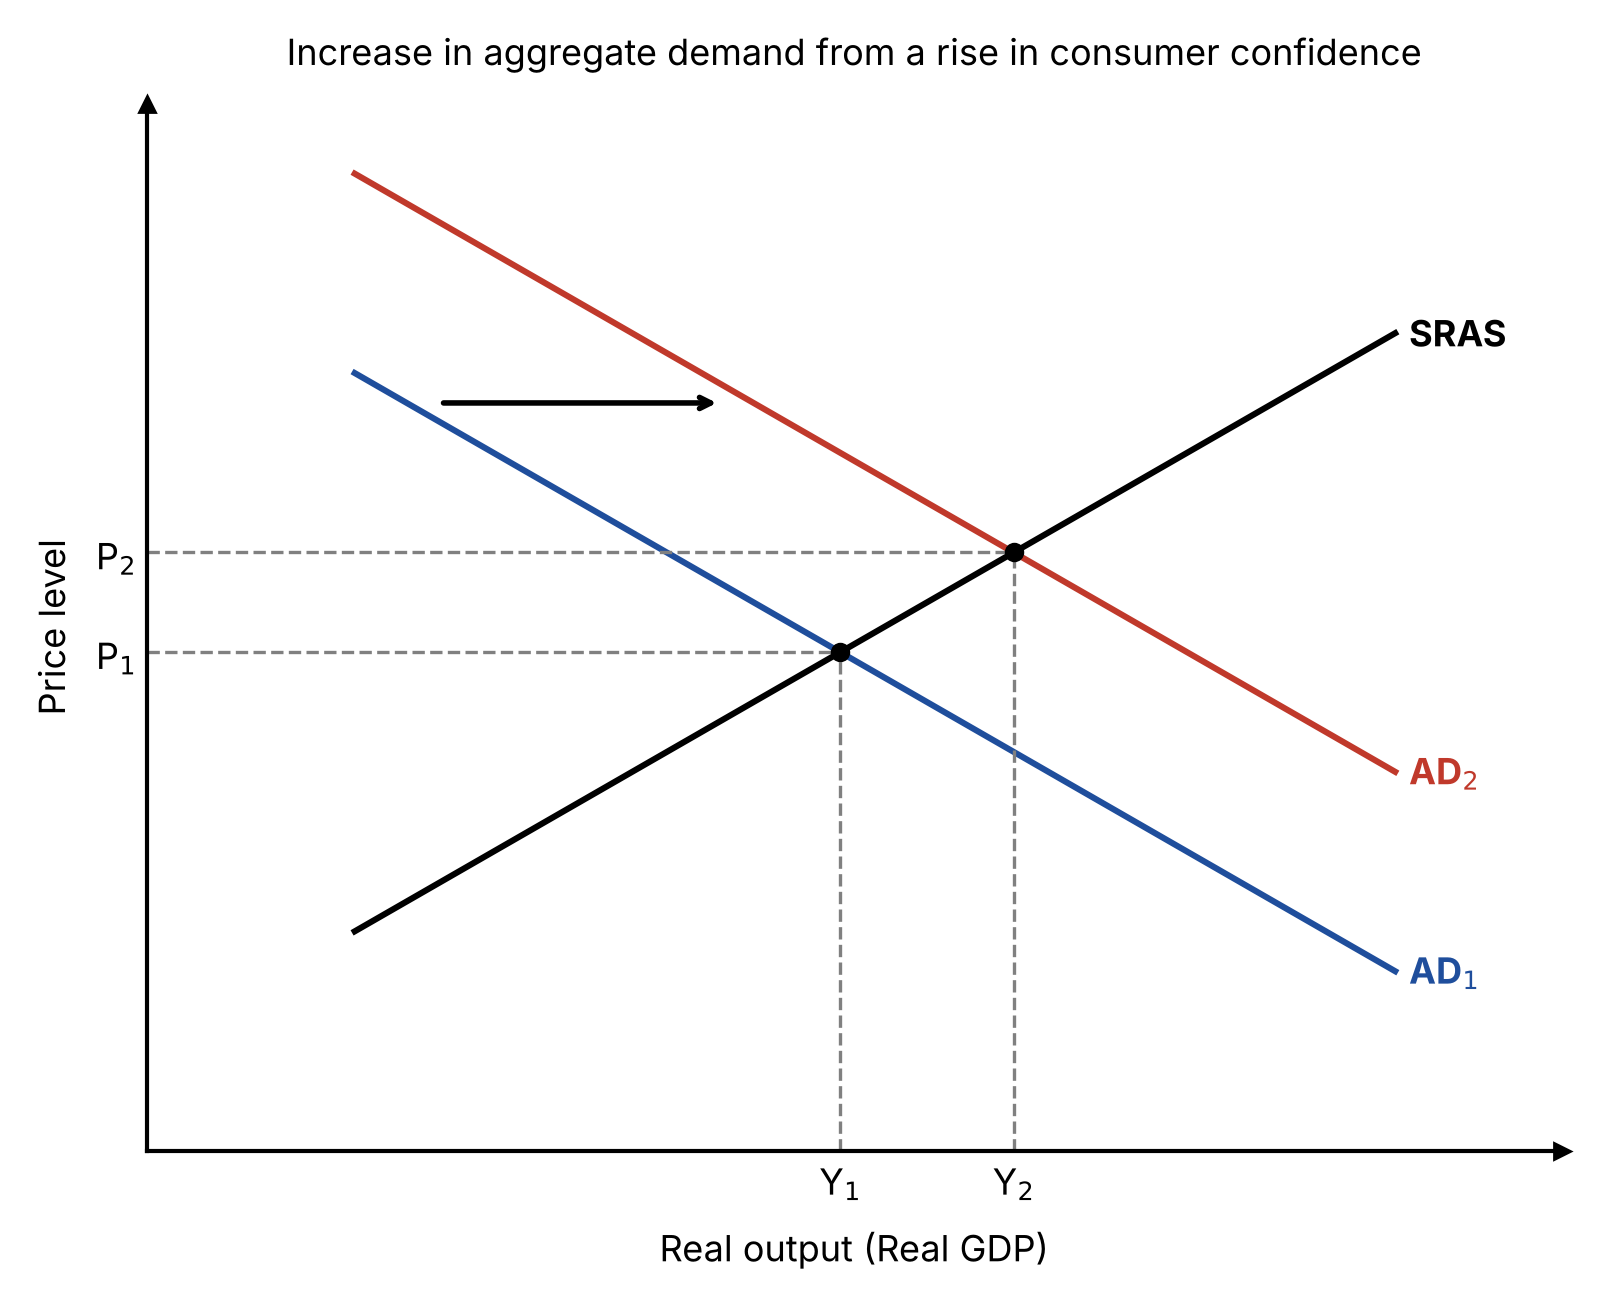
A rise in consumer confidence increases consumption, so aggregate demand shifts to the right from AD1 to AD2. As shown on the diagram, the economy moves to a new equilibrium where real output rises from Y1 to Y2 and the price level rises from P1 to P2.
Why does this work well?
This links the diagram to the explanation by naming the curves and the changes in price level and output, using the labels on the diagram
In longer answers, draw the diagram next to the paragraph that uses it, not at the end of the answer
One well-used diagram is better than several diagrams that are never mentioned
Common diagram mistakes
Unlabelled axes or curves
The examiner cannot tell what the diagram shows
Shifting the wrong curve
e.g. shifting demand when a change in costs affects supply
Confusing a shift with a movement along a curve
A change in the good's own price causes a movement along the curve, not a shift
No new equilibrium
The diagram shows a shift but not its effect on price and quantity
Using the wrong diagram for the question
Examiners regularly report students using a macro diagram where a micro one is needed, or the reverse
Not referring to the diagram
A diagram that is not explained in the text adds little to your answer
Spending too long drawing
Aim for a neat diagram drawn in 2–3 minutes
Practise the key diagrams until you can draw them quickly
Examiner Tips and Tricks
Practise drawing every key diagram from memory before the exam. In the exam, you should be deciding what the diagram needs to show, not trying to remember how to draw it.

Unlock more, it's free!
Join the 100,000+ Students that ❤️ Save My Exams
the (exam) results speak for themselves:

Was this revision note helpful?