Answering 10-Mark To What Extent Questions (AQA A Level Economics): Revision Note
Exam code: 7136

How 10-mark data questions work
The 10-mark question only appears on Paper 3
It usually follows this pattern:
"To what extent, if at all, do the data suggest that… ? You must use the data in Extract B to support your assessment."
The claim in the question is a judgement about a trend or a comparison
e.g. that an industry has declined, or that people in one region are better off than in another
It rewards all four skills, including evaluation (AO4)
It is the only question below 25 marks that rewards evaluation
Most of your evidence should come from the data extract, but you can also be rewarded for using the other extracts and your own knowledge
Aim for up to about 275 words, in about 13 minutes
How the marks are awarded
Question 31 is marked using three levels
What is assessed | Level 3 (8–10 marks): a good response that |
|---|---|
Issues | is well organised and includes at least three relevant, well-developed issues |
Use of data | makes effective use of the numerical/statistical data in Extract B |
Limitations of the data | shows some appreciation of the limitations of the data |
Judgement | includes a supported final judgement concerning the extent to which the data support the view that [the claim in the question] |
To reach Level 3 you need all four of these:
at least three well-developed issues
effective use of the data
the limitations of the data
a supported final judgement
Structuring your 10-mark answer
Use the following structure to help you reach Level 3
[K] → [Ap + An + E] × 3 → [Ev]: five paragraphs, with evaluation in every data paragraph
Key: K = knowledge · Ap = application · An = analysis · Ev = evaluation
Paragraph | Skill | What to write | Approx. words |
|---|---|---|---|
1 | K | set the criteria: in one sentence, say how the claim could be judged and which measures would show it | 25 |
2 | Ap + An + Ev | issue 1: quote and manipulate the data, e.g. calculate a change or a percentage change, explain what it shows about the claim, then qualify it with a limitation of the data or another explanation | 60–65 |
3 | Ap + An + Ev | issue 2: a different measure, built the same way | 60–65 |
4 | Ap + An + Ev | issue 3: a third measure, built the same way | 60–65 |
5 | Ev | judgement: answer "to what extent", weighing the evidence from all three paragraphs | 60 |
This is different from a 25-mark answer: in a 10-mark answer, the evaluation sits inside each data paragraph rather than in a separate paragraph
Check your answer against Level 3
Level 3 needs… | Where it goes in your answer |
|---|---|
At least three well-developed issues | paragraphs 2, 3 and 4: one measure each |
Effective use of the data | a calculation or comparison in every data paragraph, not just copied figures |
The limitations of the data | the Ev part of at least one data paragraph must name a limitation of the data itself, e.g. missing years or figures not adjusted for inflation |
A supported final judgement | paragraph 5, based on the strongest evidence |
An alternative explanation, e.g. "the share would also fall if other sectors grew faster", is good evaluation, but it is not a limitation of the data
Make sure at least one of your three "However…" sentences questions the data itself
Limitations to look for
Missing years or a short time period
Unusual years, such as the pandemic, that distort a trend
Nominal (current price) figures that have not been adjusted for inflation
Averages that hide differences between groups
Missing measures: the data may not show everything needed to judge the claim
Examiner Tips and Tricks
Make sure your final judgement matches your discussion. If your paragraphs show the evidence is mixed, conclude that the data partly support the claim, and say which evidence carries the most weight.
Worked Example
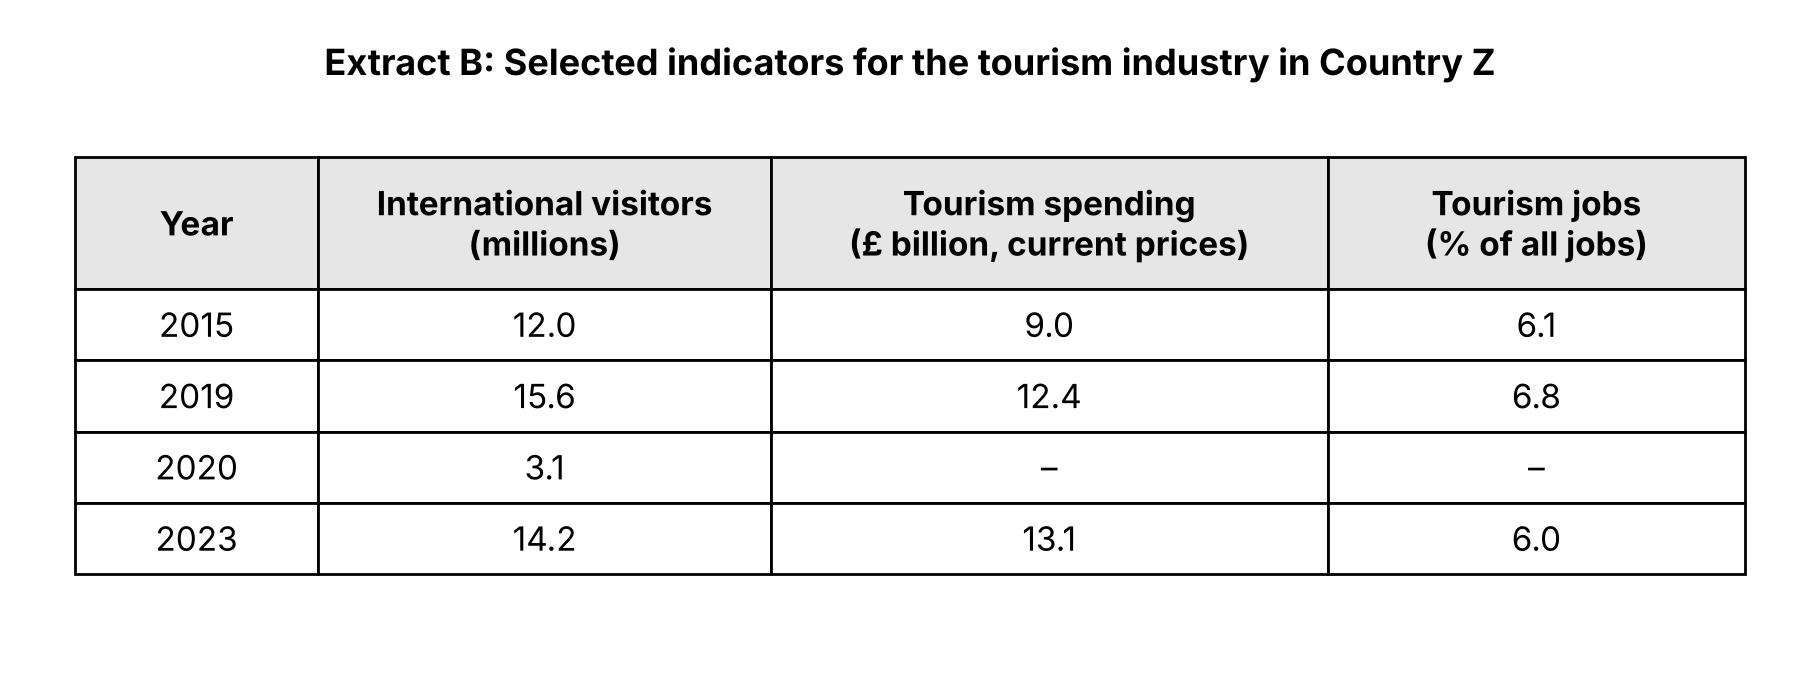
To what extent, if at all, do the data suggest that the tourism industry in Country Z has fully recovered from the pandemic? You must use the data in Extract B to support your assessment.
[10 marks]
Model answer
[K] A full recovery would mean the tourism industry returning to at least its 2019, pre-pandemic level on measures such as visitor numbers, spending and the number of jobs it supports.
[Ap] Visitor numbers fell by around 80%, from 15.6 million in 2019 to 3.1 million in 2020, and had recovered to 14.2 million by 2023. [An] The 2020 collapse reflects travel restrictions, so the 2023 figure is the better test: it is still about 9% below 2019, so on this measure the recovery is incomplete. [Ev] However, the data stop in 2023, so visitor numbers may have continued to rise since, and the missing years make the speed of recovery unclear.
[Ap] Tourism spending of £13.1 billion in 2023 was about 6% higher than in 2019, [An] which suggests the industry earns more than before the pandemic, perhaps because visitors are staying longer or spending more each day. [Ev] However, spending is measured at current prices. Prices have risen since 2019, so after inflation, real spending may not have recovered at all.
[Ap] Tourism's share of jobs fell from 6.8% in 2019 to 6.0% in 2023, [An] below even its 2015 level, suggesting the industry is now relatively less important as an employer. [Ev] However, a falling share does not mean fewer tourism jobs: the share would also fall if jobs in other sectors, such as finance or construction, grew faster.
[Ev] Overall, the data suggest a strong but incomplete recovery from the pandemic. Visitor numbers remain below their 2019 level and the rise in spending may reflect higher prices rather than more tourism, so the industry has not yet fully recovered, although it may be close to doing so once more recent data are available.
Why this answer would reach Level 3
It opens by setting out how a full recovery could be judged
It develops three issues, each using a different measure and a calculation
Each data paragraph ends by qualifying its own evidence, so evaluation runs throughout
Two of those qualifications are limitations of the data itself: missing years after 2023, and spending at current prices
It reaches a clear judgement that follows from the evidence

Unlock more, it's free!
Join the 100,000+ Students that ❤️ Save My Exams
the (exam) results speak for themselves:

Was this revision note helpful?