Answering 9-Mark Explain With A Diagram Questions (AQA A Level Economics): Revision Note
Exam code: 7136

How 9-mark diagram questions work
9-mark questions follow a fixed pattern:
A quotation from one of the written extracts, with its line numbers
Then the instruction "With the help of a diagram, explain…"
Occasionally the wording is "a suitable diagram", or "analyse" instead of "explain"
They reward three skills:
AO1 knowledge and understanding
AO2 application to the context
AO3 analysis
They do not reward evaluation, so do not include it
Aim for up to about 150 words, plus your diagram, in about 12 minutes
How the marks are awarded
9-mark questions are marked using levels of response
The examiner reads the whole answer and decides which level it best fits
What is assessed | Level 3 (7–9 marks) |
|---|---|
Organisation and focus | is well organised and develops one or more of the key issues that are relevant to the question |
Knowledge (AO1) | shows sound knowledge and understanding of relevant economic terminology, concepts and principles |
Application (AO2) | includes good application of relevant economic principles and/or good use of data to support the response |
Analysis (AO3) | includes well-focused analysis with a clear, logical chain of reasoning |
Diagram | includes a relevant diagram that will, at the top of this level, be accurate and used appropriately |
Notice the wording at Level 3: "one or more of the key issues"
One issue explained in depth, with an accurate diagram, can reach full marks
Other appropriate diagrams are given credit, so you will not lose marks for choosing a different valid diagram from the one the examiner expected
Structuring your 9-mark answer
Key: K = knowledge · Ap = application · An = analysis · KAA = knowledge, application and analysis
Use the following structure to score full marks
[K + Ap] → [KAA + diagram]
Paragraph | Skill | What to write | Approx. words |
|---|---|---|---|
1 | K + Ap | define the key term or concept in the question and link it to the quotation | 30 |
2 | KAA + diagram | draw an accurate, fully labelled diagram. Explain what causes the change and what happens next, step by step, using the labels on your diagram, and link it back to the extract | 110 |
3 (optional) | KAA | a second, shorter chain of reasoning if another issue is relevant | – |
There is no evaluation and no conclusion in a 9-mark answer
One issue, explained in depth with an accurate diagram, can reach full marks
Examiner Tips and Tricks
The question asks you to explain with the help of a diagram, so your written answer must use it. Refer to the curves and points by their labels; a diagram that is never mentioned does little to lift your mark.
Worked Example
Extract C (lines 6–7) states that 'the tax on sugary drinks has encouraged many consumers to switch to healthier alternatives'.
With the help of a diagram, explain how an indirect tax can reduce the overconsumption of sugary drinks.
[9 marks]
Model answer
[K] An indirect tax is a tax on spending, paid to the government by producers. Sugary drinks are overconsumed because they create negative consumption externalities, [Ap] such as NHS spending on treating obesity. Extract C suggests the tax has reduced this overconsumption.
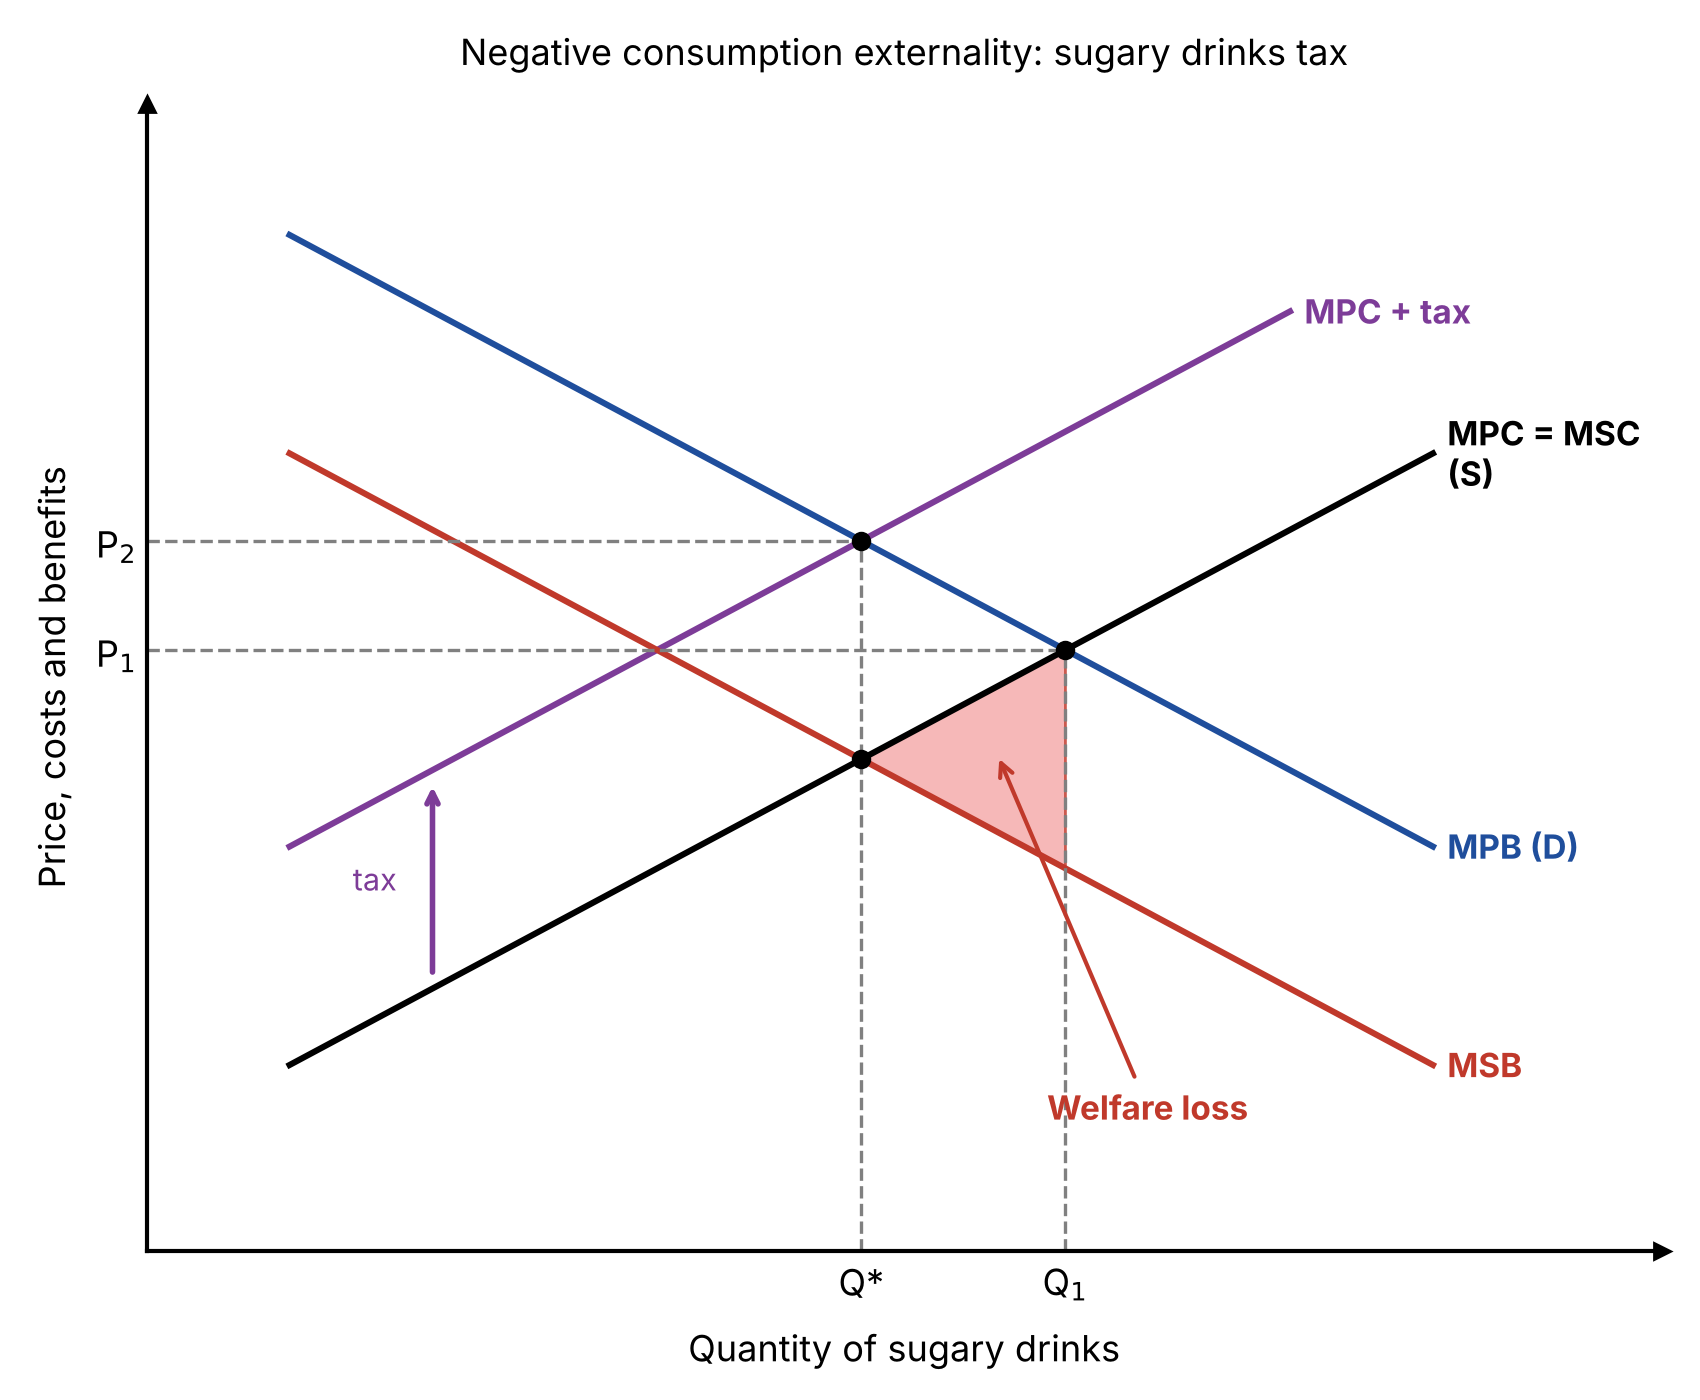
[K] Because of these external costs, the marginal social benefit (MSB) of sugary drinks is lower than the marginal private benefit (MPB). [An] In a free market, consumers ignore external costs and buy Q1, where MPB = MPC, above the socially optimal level Q*, where MSB = MPC. [Ap] Extract C shows that consumers have healthier alternatives to switch to. [An] So when the tax raises producers' costs and supply shifts left from MPC to MPC + tax, the price rises from P1 to P2 and consumers switch away, cutting consumption from Q1 to Q*, as the diagram shows. If the tax equals the external cost, the welfare loss is removed.
Why this answer would reach Level 3
It defines the key concepts: negative consumption externalities and indirect tax
The diagram is accurate, fully labelled and used in the explanation
It develops one clear chain of reasoning, from the tax to higher prices, lower consumption and a smaller welfare loss
It applies the explanation to the quotation from Extract C, setting up the context before the analysis

Unlock more, it's free!
Join the 100,000+ Students that ❤️ Save My Exams
the (exam) results speak for themselves:

Was this revision note helpful?