Practical Skills I: Processing Results (Edexcel International A Level (IAL) Physics): Structured Questions

Exam code: YPH11

2 hours10 questions
1a
2 marks

A student investigated the forces acting on a bracket.

The bracket of weight W was attached to a vertical wall with a hinge at point C. The bracket was held horizontally by a wire attached to the bracket at point A and to the wall at point B. The wire was at an angle θ to the bracket and exerted a force F on the bracket.

The student hung a mass from the bracket at a distance x from the hinge, as shown.

q3-wph13-03-jan-2022-edexcel-int-as-a-level-phy

Describe how the student could determine θ using a metre rule.

1b
1 mark

Describe how the student could check that the bracket was horizontal.

1c
3 marks

The student adjusted the position of the mass and measured x. For each value of x the student made corresponding measurements of F using a force meter.

The results are shown in the table.

x / cm

Mean F / N

5

2

10

2.6

15

3.3

20

4.4

25

5.3

30

6.2

35

7

40

8.1

45

8.8

 Criticise the recording of these results.

1d
5 marks

The student plotted a graph of F against x, as shown.

q3d-wph13-03-jan-2022-edexcel-int-as-a-level-phy

i) The relationship between F and x is

F = mgxl sin θ + W2 sin θ

where

l is the length of the bracket

m is the mass hung from the bracket.

Determine a value for W using the graph.

θ = 42°

W = ................................ N(3)

ii) The value of g obtained from the graph is 9.64 m s–2.

The student concluded that the value of g obtained is accurate.

Evaluate the student’s conclusion.

(2)

2a
2 marks

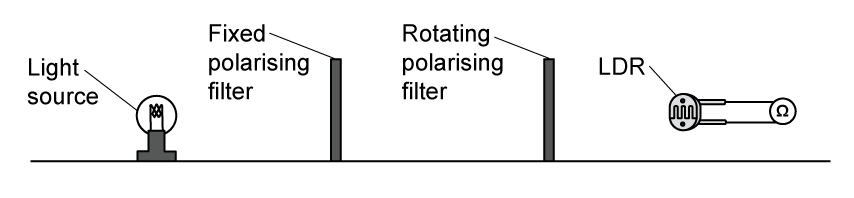
A student investigated how the resistance of a light-dependent resistor (LDR) varied with the angle between the transmission axes of two polarising filters, using the apparatus shown.

From left to right: a light source, a fixed polarising filter, a rotating polarising filter, and an LDR connected to an ohmmeter.

Light is incident on the LDR after passing through the two polarising filters. The student rotated the second filter by different angles θ and measured the resistance R of the LDR using an ohmmeter.

The relationship between R and θ is given by

1R=1R0cos2θ

where R0 is the resistance of the LDR measured with the transmission axes of the two filters parallel.

Explain why a graph of 1R against cos2θ should be a straight line through the origin.

2b
2 marks

The student's results are shown in the table.

1R / kΩ-1

θ / °

‎ ‎ ‎ ‎ ‎ ‎ ‎ ‎ ‎ ‎ ‎ ‎ ‎ ‎ ‎ ‎ ‎ ‎ ‎ ‎ ‎ ‎ ‎ ‎ ‎ ‎ ‎ ‎ ‎ ‎ ‎ ‎ ‎ ‎ ‎ ‎ ‎ ‎ ‎ ‎ ‎ ‎ ‎ ‎ ‎ ‎ ‎ ‎ ‎ ‎ ‎ ‎ ‎

0.780

30.0

‎ ‎ ‎ ‎ ‎ ‎ ‎ ‎ ‎ ‎ ‎ ‎ ‎ ‎ ‎ ‎ ‎ ‎ ‎ ‎ ‎ ‎ ‎ ‎ ‎ ‎ ‎ ‎ ‎ ‎ ‎ ‎ ‎ ‎ ‎ ‎ ‎ ‎ ‎ ‎ ‎ ‎ ‎ ‎ ‎ ‎ ‎ ‎ ‎ ‎ ‎ ‎ ‎

0.709

35.0

‎ ‎ ‎ ‎ ‎ ‎ ‎ ‎ ‎ ‎ ‎ ‎ ‎ ‎ ‎ ‎ ‎ ‎ ‎ ‎ ‎ ‎ ‎ ‎ ‎ ‎ ‎ ‎ ‎ ‎ ‎ ‎ ‎ ‎ ‎ ‎ ‎ ‎ ‎ ‎ ‎ ‎ ‎ ‎ ‎ ‎ ‎ ‎ ‎ ‎ ‎ ‎ ‎

0.623

40.0

‎ ‎ ‎ ‎ ‎ ‎ ‎ ‎ ‎ ‎ ‎ ‎ ‎ ‎ ‎ ‎ ‎ ‎ ‎ ‎ ‎ ‎ ‎ ‎ ‎ ‎ ‎ ‎ ‎ ‎ ‎ ‎ ‎ ‎ ‎ ‎ ‎ ‎ ‎ ‎ ‎ ‎ ‎ ‎ ‎ ‎ ‎ ‎ ‎ ‎ ‎ ‎ ‎

0.456

50.0

‎ ‎ ‎ ‎ ‎ ‎ ‎ ‎ ‎ ‎ ‎ ‎ ‎ ‎ ‎ ‎ ‎ ‎ ‎ ‎ ‎ ‎ ‎ ‎ ‎ ‎ ‎ ‎ ‎ ‎ ‎ ‎ ‎ ‎ ‎ ‎ ‎ ‎ ‎ ‎ ‎ ‎ ‎ ‎ ‎ ‎ ‎ ‎ ‎ ‎ ‎ ‎ ‎

0.305

60.0

‎ ‎ ‎ ‎ ‎ ‎ ‎ ‎ ‎ ‎ ‎ ‎ ‎ ‎ ‎ ‎ ‎ ‎ ‎ ‎ ‎ ‎ ‎ ‎ ‎ ‎ ‎ ‎ ‎ ‎ ‎ ‎ ‎ ‎ ‎ ‎ ‎ ‎ ‎ ‎ ‎ ‎ ‎ ‎ ‎ ‎ ‎ ‎ ‎ ‎ ‎ ‎ ‎

0.170

70.0

‎ ‎ ‎ ‎ ‎ ‎ ‎ ‎ ‎ ‎ ‎ ‎ ‎ ‎ ‎ ‎ ‎ ‎ ‎ ‎ ‎ ‎ ‎ ‎ ‎ ‎ ‎ ‎ ‎ ‎ ‎ ‎ ‎ ‎ ‎ ‎ ‎ ‎ ‎ ‎ ‎ ‎ ‎ ‎ ‎ ‎ ‎ ‎ ‎ ‎ ‎ ‎ ‎

Complete the table with corresponding values of cos2θ.

2c
5 marks

Plot a graph of 1R on the y-axis against cos2θ on the x-axis on the grid.

Blank graph grid for plotting. 12 by 8 large squares containing 10 by 10 small squares.
2d
3 marks

Determine the gradient of the graph.

2e
2 marks

The student expected the line to pass through the origin.

Explain why the line has a small positive intercept, and how the student could reduce this effect.

2f
2 marks

In a preliminary experiment, the student set the transmission axes of the two filters parallel and determined the resistance of the LDR as R0=1.02 kΩ.

The student estimated the percentage uncertainty in the gradient to be 4%.

Determine whether the gradient of the graph is consistent with the value of R0 from the preliminary experiment.

3a
9 marks

A student investigated the resistance of some thin slices of silicon.

Each silicon slice had

  • the same length L

  • the same thickness t

  • a different width w

Conducting strips were fitted to opposite ends of each silicon slice and connected to an ohmmeter, as shown.

The student measured values of w and corresponding values of resistance R.

q4-wph13-03-jan-2022-edexcel-int-as-a-level-phy

The table shows the student's measurements.

w / mm

 R / MΩ


14

33.6


18

26.1


26

17.2


37

13.3


53

8.7


The relationship between R and w is

R = ρLwt

where ρ is the resistivity of silicon.

i) Plot a graph of R on the y-axis against 1 / w on the x-axis. Use the additional column of the table for your processed data.

q4ai-wph13-03-jan-2022-edexcel-int-as-a-level-phy

(6)

ii) Determine t using data from the graph.

ρ = 4.0 × 10³ Ω m

L = 10.0 cm

(3)

3b
4 marks

The student determined a value for t. She decided to measure the thickness of several silicon slices stacked together. She measured this thickness using a micrometer.

i) Explain why this method gives a value for t with low uncertainty.

(2)

ii) The value of t obtained using this method was 0.80 mm with an uncertainty of 2%.

Deduce whether this value is consistent with the value of t obtained from the graph.

(2)

4a
7 marks

A student carried out an experiment to compare the speed of sound in air and the speed of sound in wood. The student used a long piece of wood, a hammer and two microphones, as shown.

q5-wph13-03-jan-2022-edexcel-int-as-a-level-phy

The microphones were connected to a 2-beam oscilloscope. The student hit the wood with a metal hammer producing a sharp sound that travelled through the air. The oscilloscope traces produced by the microphones and the time per division dial are shown.

q5-1-wph13-03-jan-2022-edexcel-int-as-a-level-phy

i) Determine the speed of sound in air.

distance between microphones = 1.25 m

Speed of sound = ................................ m s–1(4)

ii) The student then attached the microphones to the piece of wood so they detected the sound passing along the wood. The distance between the microphones was 1.25 m.

The student adjusted the dial on the oscilloscope to 20 μs per division to display the traces from the microphones. A teacher commented that this was not the correct setting.

Justify the teacher’s comment.

The piece of wood is made of oak. The speed of sound in oak is approximately 4000 m s–1.

(3)

4b
2 marks

The student tried the same experiment using a rubber hammer. The rubber hammer compressed as it hit the wood making a sound that lasted for a longer time.

Explain the effect that using the rubber hammer had on the accuracy of the time determined.

4c
2 marks

The student was given the following equation and data to find a value for the speed of sound in oak.

                  v=Eρ

Young modulus E of oak = 11.2 GPa ± 0.5 GPa

Density ρ of oak = 650 kg m–3 with an uncertainty of 3%

Assess which of these values was the more significant source of uncertainty in the value of the speed of sound.

5a
2 marks

A student determined the speed of sound in air using a standing wave.

The student used a tuning fork to create a sound wave in the column of air inside a plastic tube.

He placed the plastic tube into a measuring cylinder of water so he could adjust the length l of the column of air.

q2-wph13-03-june-2021-edexcel-int-as-a-level-phy

The student adjusted l until the loudest sound was heard, indicating that a standing wave had formed. He marked the water level on the plastic tube and measured l.

He repeated this process several times and recorded the results.

l / cm

18.4

18.0

19.2

19.4

19.2

Suggest two reasons for the variation in the lengths the student measured.

5b
4 marks

i) Calculate the mean value of l.

Mean value of l = ...........................(2)

ii) Calculate the percentage uncertainty in l.

Percentage uncertainty = ...........................(2)

5c
2 marks

The frequency of the tuning fork was 440 Hz. The standing wave produced had a wavelength 4l.

Calculate the speed of sound in air.

Speed of sound = ..........................

5d
2 marks

The percentage uncertainty in the student’s value for the speed of sound is equal to the percentage uncertainty in l.

The accepted value for the speed of sound in air is 343 m s−1.

Comment on whether the student’s value is consistent with the accepted value for the speed of sound in air.

6a
3 marks

A student determined the viscosity of a liquid. The student measured the force required to pull a small sphere upwards through the liquid at a constant speed.

q3-wph13-03-june-2021-edexcel-int-as-a-level-phy

The student measured the diameter of the sphere using a micrometer.

q3a-wph13-03-june-2021-edexcel-int-as-a-level-phy

Calculate the percentage uncertainty in the diameter of the sphere shown on the micrometer.

Percentage uncertainty = .............................

6b
1 mark

State one precaution that should be taken before using a micrometer.

6c
6 marks

The student measured the value of force when the sphere was suspended and stationary in the liquid. The force meter used is shown in the photograph.

q3c-wph13-03-june-2021-edexcel-int-as-a-level-phy

When the sphere was stationary the reading on the force meter was 0.20 N.

The student then moved the force meter upwards so that the sphere moved at a constant speed of 0.32 m s−1. The reading on the force meter was 0.29 N.

i) Explain why it was necessary to measure the force when the sphere was stationary and the force when the sphere was moving at constant speed.

(3)

ii) Calculate the viscosity η of the liquid.

η = ................................. Pa s(3)

6d
4 marks

The resolution of the force meter was 0.01 N.

The distance moved between the rubber bands was 25.0 cm.

The time measured was 0.78 s.

The percentage uncertainty in the measurement of the diameter was negligible.

Assess which of these measurements was the most significant source of uncertainty in the value of viscosity.

7a
3 marks

The activation potential difference (p.d.) is the minimum p.d for photons to be emitted from a light emitting diode (LED). A student measured the activation p.d. for different LEDs.

The relationship between activation p.d. and wavelength is given by the equation

eVa=hcλ+W

where

Va is the activation p.d.

λ is the wavelength of the photons emitted by the LED

W is a constant representing the work done by an electron passing through an LED.

Explain why a graph of Va against 1/λ should give a straight line.

7b
12 marks

The student recorded his values of activation p.d. and the manufacturer’s corresponding values of wavelength.

λ / 10−7 m

Va / V


6.60

1.82


6.12

1.97


5.92

2.02


5.85

2.07


5.30

2.31


4.70

2.58


   i) Complete the table with the corresponding values of 1/λ.

(2)

ii) Plot a graph of Va on the y-axis against 1/λ on the x-axis.

q4bii-wph13-03-june-2021-edexcel-int-as-a-level-phy

(5)

iii) Determine the value of the Planck constant given by the student’s data.

Planck constant = ................................(3)

iv) The student states that the value for the Planck constant obtained from the graph is accurate.

Evaluate the student’s statement.

(2)

7c
4 marks

Each LED in the investigation emits a narrow range of wavelengths.

The wavelength value stated by the manufacturer is the wavelength of light that is emitted with maximum intensity when the LED is at normal brightness.

The wavelength emitted at the activation p.d. is not equal to the manufacturer’s value.

Discuss whether this affects the accuracy of the value of the Planck constant obtained.

8a
7 marks

A student slid a small metal cube down a frictionless ramp. The cube collided with a fixed metal block at the bottom of the ramp.

The student released the cube from position X as shown in the diagram. After the collision, the cube rebounded to position Y.

q4-wph13-03-oct-2021-edexcel-int-as-and-a-level-phy

The student measured heights h and r. He then repeated the experiment using several different starting positions.

The student recorded his results in the table below.

h / m

r / m

0.20

0.11

0.25

0.137

0.30

0.16

0.35

0.19

0.40

0.217

0.45

0.24

i) Criticise these results.

(2)

ii) Plot a graph of r on the y-axis and h on the x-axis.

q4aii-wph13-03-oct-2021-edexcel-int-as-and-a-level-phy

(5)

8b
5 marks

i) Show that the velocity u of the cube immediately before the collision is given by  

u=2gh

(2)

ii) The coefficient of restitution e is given by the equation  

e = vu  

where v is the velocity of the cube immediately after the collision.  

Explain why the gradient of the graph is e2.

(3)

8c
3 marks

The student researched the range of values for the coefficients of restitution e of different metals.

stainless steel         0.63 < e < 0.93    

cast iron                    0.3 < e < 0.6

Determine which of these metals the cube could be made from.

8d
2 marks

Explain how friction between the cube and the surface of the ramp would affect the value obtained for e.

9a
2 marks

A student investigated the behaviour of a thermistor using the circuit shown in the diagram.

q1-wph13-03-oct-2021-edexcel-int-as-and-a-level-phy

She heated the thermistor to 100°C and measured the potential difference V across it.

She decreased the temperature θ and recorded further measurements of V and θ until the temperature reached 10°C.

Describe how the student was able to vary the temperature θ of the thermistor for this investigation.

9b
2 marks

The photograph shows the steady reading of V on the voltmeter when the thermistor was at room temperature.

q1b-wph13-03-oct-2021-edexcel-int-as-and-a-level-phy

Calculate the percentage uncertainty in the value of V shown.

Percentage uncertainty = ..........................................

9c
5 marks

The student plotted a graph of her measurements of V and θ.

q1c-wph13-03-oct-2021-edexcel-int-as-and-a-level-phy

i) Estimate the value of V for a temperature of 0°C.

(2)

ii) Calculate the resistance of the thermistor at a temperature of 0°C.

Resistance = ......................................................(3)

9d
2 marks

The student suggested that V is inversely proportional to temperature measured in kelvin.

Determine whether she is correct.

10a
3 marks

A student determined a value for the density of the metal in a small rectangular plate.

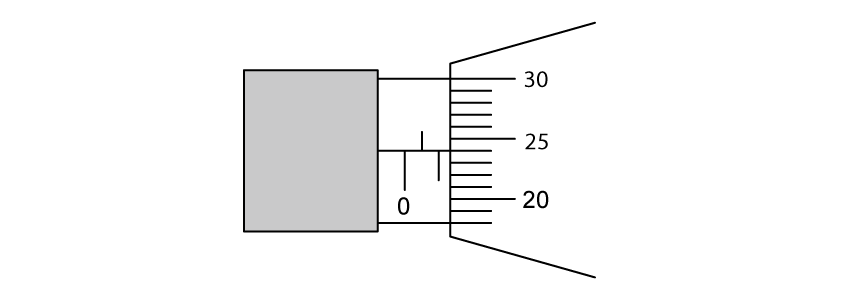
She measured the thickness t of the plate using a micrometer screw gauge. The diagram shows the reading on the micrometer.

Close-up of a micrometer screw gauge sleeve and thimble. On the sleeve, whole-millimetre marks sit above the horizontal datum line and are numbered 0 and 1, and half-millimetre marks sit below the line, one of them midway between 0 and 1. Two sleeve marks are uncovered beyond 0 — the half-millimetre mark and the 1 mark — and the next sleeve mark is hidden by the edge of the thimble. The thimble scale is numbered 20, 25 and 30, with five divisions from one number to the next. The thimble division level with the datum line is the first one below 25.

(i) State the value of t shown on the micrometer.

[1]

(ii) Calculate the percentage uncertainty in this measurement of t.

[2]

10b
2 marks

Explain one technique the student should use to ensure the value of t is accurate.

10c
4 marks

The student measured the length of the plate as 49.2 mm and the width as 31.4 mm using vernier calipers. She measured the mass of the plate as 5.32 g using a balance.

Show that the density of the metal in the plate is about 2800 kg m−3.

10d
3 marks

The student wants to determine whether the plate is made from pure aluminium or one of its alloys, duralumin or magnalium.

The table shows the densities of these metals.

Metal

Density / kg m-3

pure aluminium

2710

duralumin

2790

magnalium

2640

The student estimated the percentage uncertainty in her value of density to be 1%.

Deduce which metal the plate is made from.