11 mark
Which of the following is an example of a scalar quantity?
displacement
energy
momentum
velocity
Was this exam question helpful?
Exam code: 9PH0
Which of the following is an example of a scalar quantity?
displacement
energy
momentum
velocity
Was this exam question helpful?
A physical quantity may be a scalar or a vector.
Which row of the table is correct for momentum, weight, and work done?
Momentum | Weight | Work done | |
|---|---|---|---|
A | vector | vector | scalar |
B | vector | scalar | scalar |
C | scalar | vector | vector |
D | vector | vector | vector |
Was this exam question helpful?
A ball was dropped from rest, from a height above the ground. The ball bounced back up to about half its initial height.
Which graph shows how the velocity v of the ball varied with time t ?

Was this exam question helpful?
A trapdoor is fixed to a vertical wall with a hinge. A wire is attached to the other end of the trapdoor and inclined at an angle of 60°, as shown. The wire holds the trapdoor horizontal.

Which of the following shows the free-body force diagram for the trapdoor?

Was this exam question helpful?
A ball is thrown vertically upward. Assume air resistance is negligible.
Which of the following graphs shows how the vertical component of the velocity varies with time from when the ball is thrown to just before it hits the ground?

Was this exam question helpful?
A boat moves in a straight line for 8 seconds. The velocity–time graph for the boat is shown.
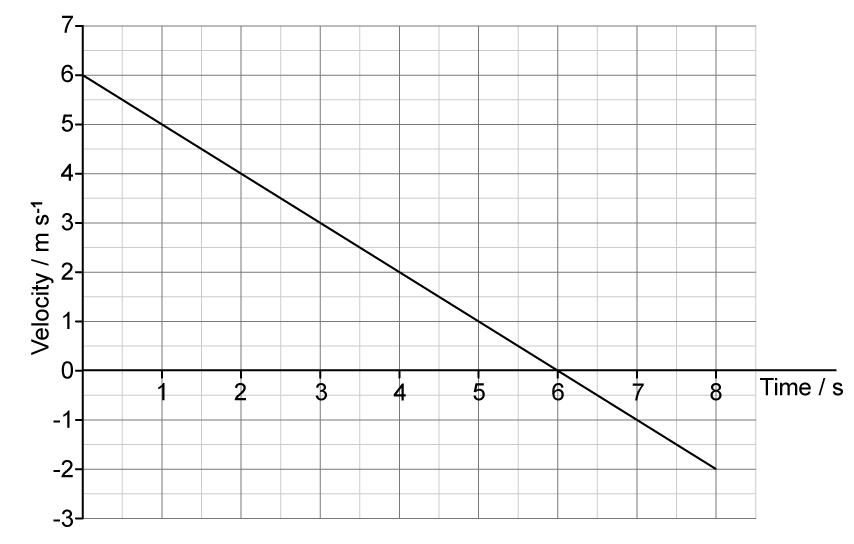
Which row of the table shows the final displacement and velocity of the boat?
Displacement / m | Velocity / m s-1 | |
|---|---|---|
A | 16 | -2.0 |
B | 18 | -2.0 |
C | 20 | -8.0 |
D | 18 | -8.0 |
Was this exam question helpful?