1a1 mark
Data now plays an important role in sport.
Define qualitative data.
1b2 marks
State two methods of collecting qualitative data.
Was this exam question helpful?
Exam code: 8582
Data now plays an important role in sport.
Define qualitative data.
State two methods of collecting qualitative data.
Was this exam question helpful?
A sprinter completes the 30 Metre Sprint Test before and after a six-week speed training programme.
Test | Sprint time |
|---|---|
Week 1 | 5.8 seconds |
Week 6 | 5.3 seconds |
Identify whether the sprint times are qualitative or quantitative data, and give a reason for your choice.
Calculate the improvement in the sprinter's time from Week 1 to Week 6.
Explain why the Week 6 result suggests that the sprinter's performance has improved.
Was this exam question helpful?
A PE teacher wants to find out how many Year 10 students complete at least 60 minutes of physical activity each day.
Identify a suitable method for collecting this data from the whole year group.
Write one suitable question the teacher could ask to collect numerical data.
Explain why the data collected would be quantitative.
Was this exam question helpful?
A diving coach gives two performers feedback after training.
Performer | Judge score | Coach observation |
|---|---|---|
A | 7.5/10 | Straight entry but knees bent during flight |
B | 7.0/10 | Good body tension but splash on entry |
Identify one piece of quantitative data from the table.
Identify one piece of qualitative data from the table.
Explain how the coach could use the qualitative data to improve one performer's technique.
Was this exam question helpful?
A rugby coach records the number of successful tackles made by four different players during a match.
Player | Successful tackles |
|---|---|
A | 18 |
B | 21 |
C | 26 |
D | 24 |
Identify a suitable graph to present this data.
State what should be labelled on the x-axis and y-axis.
Describe the trend shown in the data.
Was this exam question helpful?
A leisure centre surveys its members to find out their main reasons for exercising. The results are presented in Figure 1.
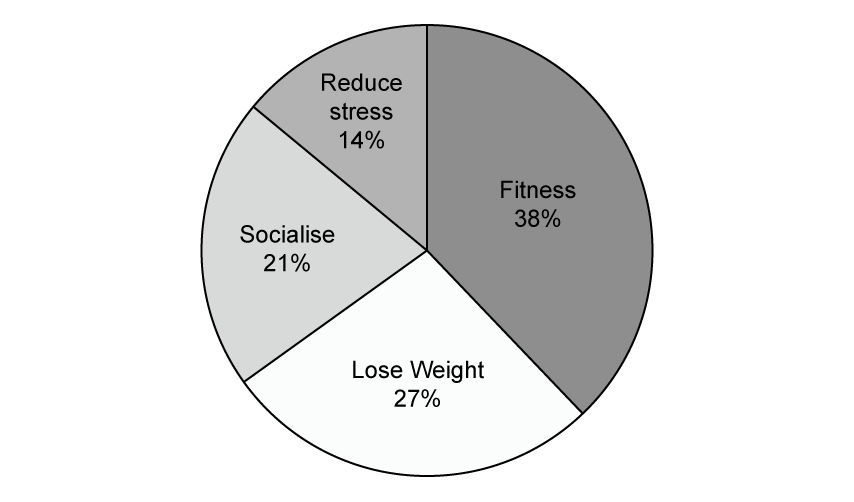
Using Figure 1, identify the most popular reason for members exercising.
Calculate the combined percentage of members who exercise to 'Socialise' or 'Reduce stress'.
Explain why a pie chart is a suitable method for the leisure centre to present this data.
Was this exam question helpful?
Table 2 shows the heart rates recorded by a 20-year-old athlete. Heart rates have been recorded every two minutes.
Plot the information shown in Table 2 on the graph paper below to show how heart rate has changed over time. Label the axes and join up the points to make a line graph.
Table 2 – heart rates recorded by a 20-year-old athlete
Time (minutes) | 2 | 4 | 6 | 8 | 10 | 12 | 14 |
Heart rate (bpm) | 80 | 85 | 110 | 115 | 115 | 115 | 85 |
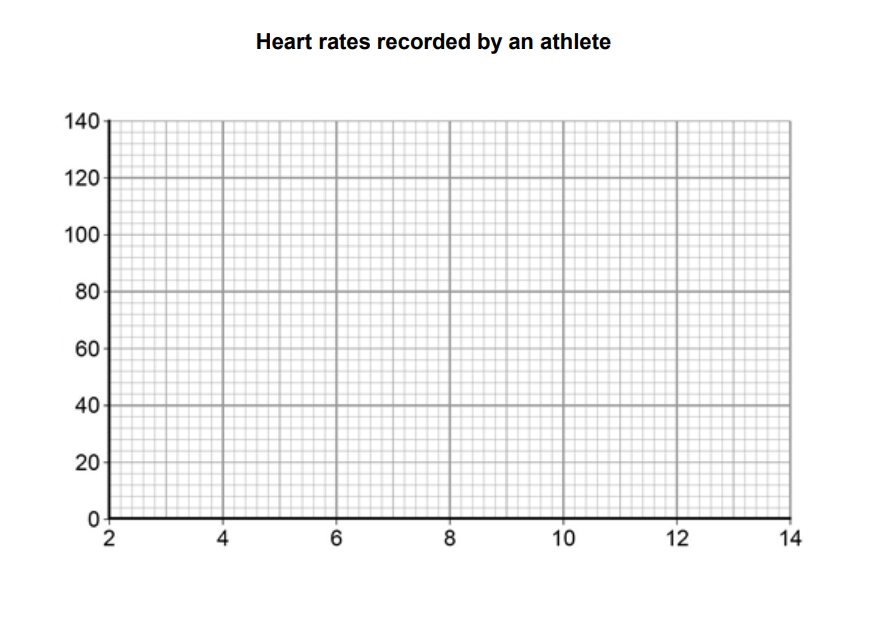
Analyse the data shown in Table 2. Consider what has happened to the athlete between:
4 and 6 minutes
6 and 12 minutes.
Was this exam question helpful?
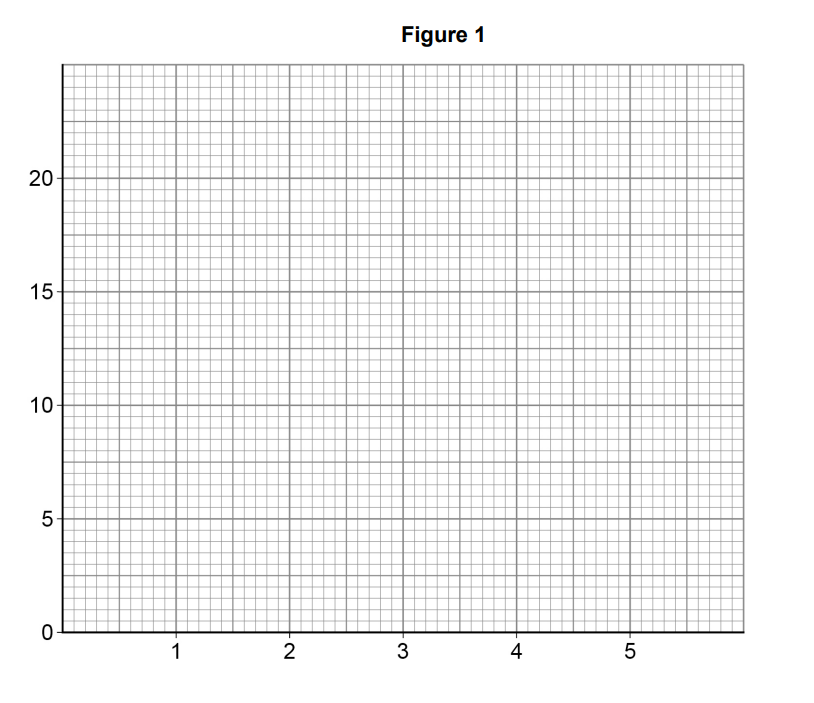
Nick has been a coach of a rugby team for four seasons. Each season consists of 24 matches. Nick has been asked by the club committee to set a target number of wins for season 5.
Table 2 shows the number of wins in Nick’s first four seasons and his target for season 5.
Season 1 | Season 2 | Season 3 | Season 4 | Season 5 | |
Target Number of wins | 10 | 14 | 11 | 15 | 18 |
Plot the data from Table 2 on Figure 1.
Label the axes and join up the points to make a line graph.
Was this exam question helpful?
Chris is an experienced 25-year-old 800m runner.
Table 1 shows Chris’s heart rate in beats per minute (bpm) at the start and during an 800m race.
Table 1
Distance (m) | Heart rate (bpm) |
0 | 80 |
200 | 130 |
400 | 140 |
600 | 160 |
800 | 200 |
Draw a line graph on the graph paper below to show Chris’s heart rate at the start and during an 800m race.
Label the axes.

Was this exam question helpful?
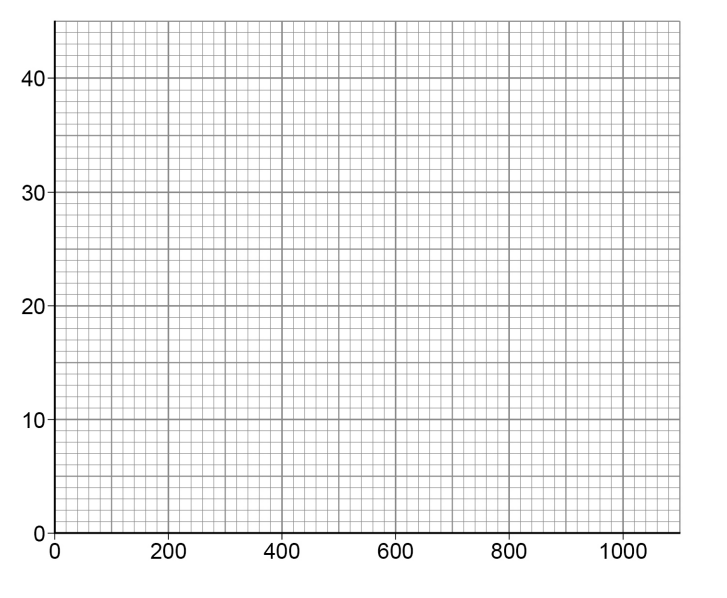
Milo is competing in a 1000m rowing race.
Table 1 shows his cardiac output in litres per minute (l/min) at rest and during the 1000m race.
Table 1
Distance (m) | Cardiac output (l/min) |
0 | 5 |
200 | 9 |
400 | 16 |
600 | 25 |
800 | 27 |
1000 | 32 |
Using the graph paper below:
Draw a line graph to show Milo’s cardiac output in litres per minute (l/min) at the start and during the 1000m rowing race.
Label the axes.
Was this exam question helpful?
A netball coach is selecting a starting centre. The coach collects the following data from the last match.
Player | Successful passes | Interceptions | Coach observation |
|---|---|---|---|
A | 28 | 2 | Sometimes slow to make decisions under pressure |
B | 22 | 5 | Communicates clearly and reacts quickly to changes in play |
Identify one strength of Player A using the quantitative data.
Identify one strength of Player B using both the quantitative and qualitative data.
Justify which player the coach should select as the starting centre. Use evidence from the table in your answer.
Was this exam question helpful?
A PE department records the number of students attending after-school badminton club over six weeks.
Week | Attendance |
|---|---|
1 | 14 |
2 | 18 |
3 | 17 |
4 | 22 |
5 | 25 |
6 | 31 |
Plot this data as a line graph. You should label both axes and join the points with straight lines.
Analyse the attendance trend shown in the data.
Was this exam question helpful?
A hockey coach tests four players using the Multi Stage Fitness Test. The coach compares the scores with the squad average of Level 8.
Player | Multi Stage Fitness Test score |
|---|---|
A | Level 7 |
B | Level 9 |
C | Level 8 |
D | Level 8 |
Identify which player scored below the squad average.
Identify which player scored above the squad average.
Explain two ways the coach could use this data to adapt training for the squad.
Was this exam question helpful?
A tennis coach records a player's first-serve percentage and unforced errors over four matches.
Match | First serves in | Unforced errors |
|---|---|---|
1 | 48% | 22 |
2 | 55% | 19 |
3 | 62% | 14 |
4 | 60% | 12 |
Describe the trend in the player's first-serve percentage.
Describe the trend in the player's unforced errors.
Explain what the coach could conclude about the player's performance across the four matches.
Was this exam question helpful?
A basketball coach is deciding which player should start at guard in a final. The coach has quantitative match data and qualitative observation notes.
Player | Points scored | Turnovers | Coach observation |
|---|---|---|---|
A | 18 | 7 | Creates scoring chances but often forces passes under pressure |
B | 12 | 2 | Communicates well and keeps possession when pressed |
C | 15 | 4 | Works hard defensively but becomes tired late in the game |
Evaluate how useful the quantitative and qualitative data is for helping the coach select a starting player.
Was this exam question helpful?
A hockey coach tests a player at the start and end of a six-week training programme. The coach also records match data from the same period.
Data collected | Week 1 | Week 6 |
|---|---|---|
30 Metre Sprint Test | 5.4 seconds | 5.0 seconds |
Multi Stage Fitness Test | Level 7.8 | Level 7.5 |
Successful tackles in match | 9 | 13 |
Successful passes in match | 31 | 24 |
Analyse the data and evaluate whether the training programme has improved the player's overall performance in hockey.
Was this exam question helpful?
A school wants to find out whether its new lunchtime sports programme has improved students' attitudes towards physical activity. The PE department collects the following data:
A survey asking 200 students to rate their enjoyment of sport from 1–10
Interviews with 12 students about why they do or do not enjoy sport
Teacher observations of participation during lunchtime sessions
Evaluate the strengths and limitations of the PE department's methods of collecting data.
Was this exam question helpful?
A school records the number of students choosing each lunchtime activity. The PE department wants to present the data clearly to decide which activities should be offered more often.
Lunchtime activity | Number of students |
|---|---|
Football | 42 |
Dance | 18 |
Badminton | 24 |
Fitness suite | 30 |
Table tennis | 16 |
Evaluate how the PE department should present and interpret this data to help plan future lunchtime activities.
Was this exam question helpful?
A swimming coach records a performer's 100 m freestyle data over three races.
Race | Time | Stroke count | Coach observation |
|---|---|---|---|
1 | 78 seconds | 66 | Breathing becomes uneven in the final 25 m |
2 | 75 seconds | 62 | Better rhythm but still lifts head too high |
3 | 73 seconds | 59 | Smoother breathing and stronger body position |
Analyse how both quantitative and qualitative data show whether the swimmer's performance has improved.
Was this exam question helpful?