Data Handling: Types, Interpretation & Display of Data (AQA GCSE Psychology): Exam Questions

Exam code: 8182

45 mins11 questions
1
2 marks

Read the following information.

In a study into false memory, a researcher asked adult participants to discuss different events from their childhood. The participants’ families gave the researcher information about these events.

One of the events was fake and involved a made-up family wedding where red wine had been spilled on the bride’s dress.

The researcher wrote down every word that the adults recalled.

He found that two fifths of the participants described details of the wedding, even though the story was made up.

The researcher claimed that his report on the study contained qualitative data.

Use the description of the study to justify the researcher’s claim

2
2 marks

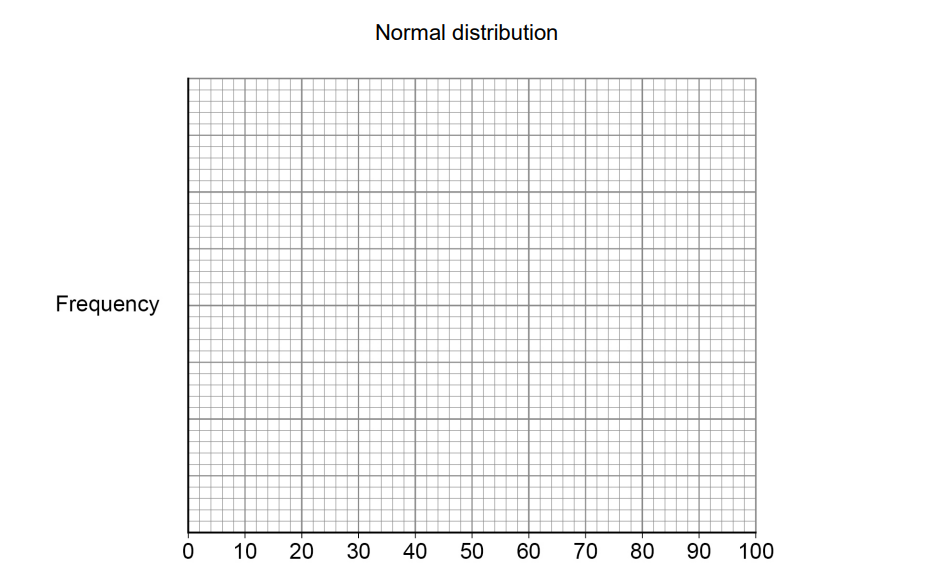
Sketch the shape of a normal distribution on the graph paper.

Clearly label where the mean score would be on your sketch.

Graph
3a
1 mark

Read the following information.

Watch out – dinosaurs about!

A mobile phone company produced an app called DinoCatch to encourage people to exercise and enjoy more time outdoors. Someone playing DinoCatch would ‘catch’ digital dinosaurs on their mobile phone. These dinosaurs appeared on their screen when the player arrived at outdoor locations such as parks.

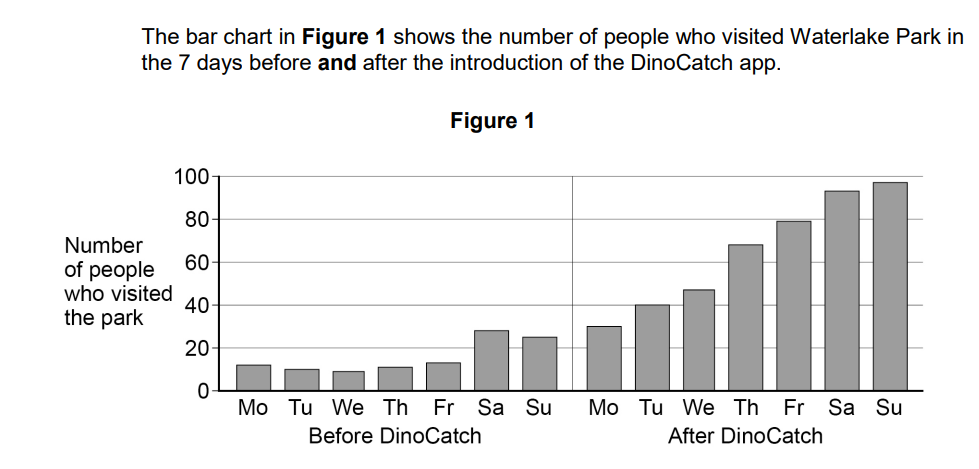
A researcher wanted to assess the impact of DinoCatch in the town of Waterlake. She counted the number of visitors to Waterlake Park between 1–2 pm during each of the 7 days before DinoCatch was introduced and at the same time during each of the 7 days afterwards.

Bar chart of the number of people who visited Waterlake Park between 1 and 2 pm, for the 7 days before and the 7 days after DinoCatch was introduced. Before DinoCatch — Monday about 12, Tuesday about 10, Wednesday about 8, Thursday about 11, Friday about 14, Saturday about 28, Sunday about 24. After DinoCatch — Monday about 30, Tuesday 40, Wednesday about 48, Thursday about 67, Friday about 78, Saturday about 92, Sunday about 96. Visitor numbers are much higher after the app than before, rising across the week and peaking on the Sunday after.

State the number of people who visited the park on the Tuesday (Tu) after the DinoCatch app was introduced.

3b
2 marks

Outline two conclusions that can be drawn from the data in the bar chart.

4a
1 mark

Read the following article.

In a study investigating perceptual set, 40 participants were asked to place their hand in a bucket of water for 10 seconds whilst listening to music. The temperature of the water was the same for each participant.

They were asked to give a number between 1 and 50 to report how warm they thought the water was.

A score of 1 meant the water felt extremely cold. A score of 50 meant that the water felt extremely hot.

There were two conditions of the experiment. All participants completed both conditions.

In Condition A, participants listened to a famous song that is associated with winter and Christmas.

In Condition B , participants listened to a famous song that is associated with summer and the sunshine.

Table 1 shows the frequency of reported temperature scores for Condition A. One of the scores is missing.

Table 1

Reported temperature score

Frequency

1–5

6

6–10

11–15

16

16–20

1

21–25

2

26–30

0

31–35

2

36–40

1

41–45

0

46–50

1

Name the type of data that is shown in Table 1.

4b
2 marks

Calculate the number of participants who reported a temperature score between 6 and 10.

Show your workings.

4c
4 marks

Sketch a histogram to show the results in Table 1.

Include the number of participants you wrote in answer to Question 10.2.

Provide a suitable title and labels for your histogram.

5
3 marks

Explain one difference between primary and secondary data.

6
2 marks
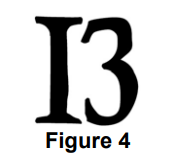
An ambiguous figure resembling both a capital letter B and the number 13.

A researcher conducted a study into perception. In condition A, participants were shown a series of letters. Then they were asked to identify the image shown in Figure 4.

In condition B, participants were shown a series of numbers. Then they were also asked to identify the image shown in Figure 4.

The researcher recorded whether the image was identified as a number or a letter.

Table 1: The percentage of participants who identified the image as a number or a letter.

Condition A

Condition B

Image identified as a number

27%

82%

Image identified as a letter

73%

18%

Use your knowledge of types of data to explain why the data collected in this study is an example of primary data.

7a
4 marks

Read the item and then answer the questions that follow.

A teacher asked her students to record how long they spent on social media and how long they spent reading for pleasure over a 14 day period. This is what she found.

Table 3: Table to show the time spent on social media and the time spent reading for pleasure

Participant number

Variable A (hours on social media)

Variable B (hours reading for pleasure)

1

2

18

2

16

7

3

14

9

4

6

17

5

10

11

6

20

3

7

9

13

8

12

10

9

17

5

10

7

15

Sketch a scatter diagram of the results shown in Table 3. Provide a suitable title and labels for your diagram.

7b
3 marks

Outline what is meant by qualitative and quantitative methods in psychology and explain one difference between these methods.

8
4 marks

Table 3 shows the results from the study.

Table 3: Mean psychology test scores for participants who ate chocolate and those who ate no chocolate

Eating chocolate before the test (Condition A)

No chocolate before the test (Condition B)

72

66

Draw a suitable bar chart to display the mean exam scores for each condition.

Include a suitable title and label both axes.

9
2 marks

Read the following information.

A memory researcher investigated the capacity of short-term memory using an eight-item digit span test.

There were 10 participants in total.


Three participants recalled fewer than five digits, while seven participants recalled five or more digits.


The ratio of participants recalling fewer than five digits to those recalling five or more digits was 3 : 7.

The number of digits correctly recalled by each participant was 3, 3, 4, 5, 6, 6, 7, 7, 8, 7

The researcher claimed that their report only contained quantitative data.

Use the description of the study to justify the researcher’s claim.

10a
4 marks

At the end of the 14-day study, the researcher interviewed 10 participants about their experiences of using the DinoCatch app. She wanted to find out if there was a correlation between time spent outdoors and improvement of mood.

She asked the participants how many hours they had spent outdoors playing DinoCatch during the 7-day period after the app was released. She also asked participants to rate how much their mood had improved on a scale of 0–10.

A rating of 0 meant that their mood had not improved at all.

A rating of 10 meant that their mood had improved a lot.

The results are shown in Table 3.

Table 3 Number of hours playing DinoCatch and mood improvement rating

Participant

Hours spent outdoors playing DinoCatch

Mood improvement rating

1

7

5

2

3

5

3

12

6

4

15

7

5

4

4

6

24

10

7

27

9

8

2

2

9

22

10

10

12

7

Sketch a scatter diagram to display the results shown in Table 3.

You must include:

  • a suitable title for your scattergram

  • a label for the x-axis.

10b
1 mark

Estimate the mood improvement rating for someone who played the app for 20 hours.

Use the results from the study to help you.

10c
2 marks

The researcher concluded that playing DinoCatch caused participants' mood to improve.

Suggest why the researcher is not correct to draw this conclusion.

11a
1 mark

Read the following information.

A neuroscientist studied language difficulties and anxiety levels in people who have had a stroke.

Damage to the language areas of the brain can result in difficulties with speech, reading, writing and understanding what others are saying.

The neuroscientist asked 10 participants from a stroke rehabilitation centre to take part in the study. The participants were ranked on the level of language difficulties they were experiencing (1 = least difficulty; 10 = most difficulty).

Each day for 30 days, the participants recorded a daily anxiety score using the scale shown in Table 2.

Table 2 Daily anxiety scale

Very low

Low

Medium

High

Very high

Today my anxiety level is...

1

2

3

4

5

At the end of the 30 days, the neuroscientist added up the daily scores for each participant. The results are shown in Table 3.

Table 3 Each participant’s ranking of the level of language difficulties and each participant’s total anxiety scores for 30 days

Participant’s identifying number

Ranking of the level of language difficulties experienced

Total anxiety scores for 30 days

001

5

119

002

2

100

003

10

143

004

3

109

005

7

127

006

9

138

007

8

135

008

1

97

009

4

114

010

6

120

What is the median for the total anxiety scores for 30 days?

11b
2 marks

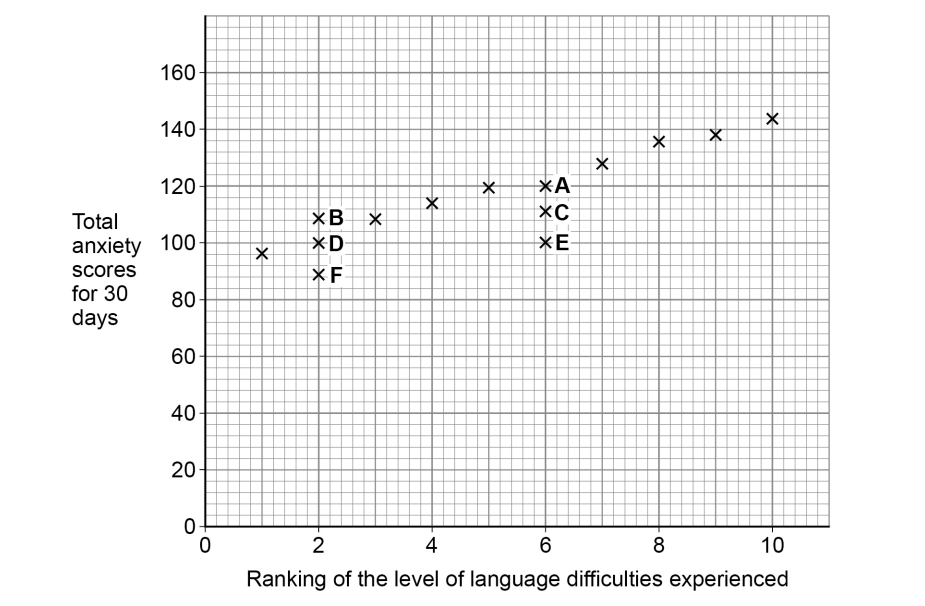
The following scatter diagram also shows the results found by the neuroscientist.

The possible locations of two of the participants’ results are shown by the letters A–F.

Scatter diagram of total anxiety score over 30 days (y-axis) against each participant's ranking of language difficulty from 1 to 10 (x-axis). Six possible locations are marked A to F: A at ranking 6, anxiety score 120; B at ranking 2, anxiety score 108; C at ranking 6, anxiety score 112; D at ranking 2, anxiety score 100; E at ranking 6, anxiety score 100; F at ranking 2, anxiety score 88.

Identify the correct locations on the scatter diagram for the results of participant 002 and participant 010.

Choose two choices: A, B, C, D, E or F.

11c
1 mark

Name the type of correlation the neuroscientist has found between language difficulties and anxiety levels.

11d
2 marks

When the neuroscientist saw the results, she claimed to have found the cause of anxiety in people who have had a stroke.

Explain why the results do not show that language difficulties cause anxiety