12 marks
Describe one result from Gilchrist and Nesberg’s study into the effects of motivation on perception.
Was this exam question helpful?
Exam code: 8182
Describe one result from Gilchrist and Nesberg’s study into the effects of motivation on perception.
Was this exam question helpful?
Outline one strength and one weakness of Gilchrist and Nesberg’s study into the effects of motivation on perception.
Was this exam question helpful?
Read the following article.
In a study investigating perceptual set, 40 participants were asked to place their hand in a bucket of water for 10 seconds whilst listening to music. The temperature of the water was the same for each participant. They were asked to give a number between 1 and 50 to report how warm they thought the water was. A score of 1 meant the water felt extremely cold. A score of 50 meant that the water felt extremely hot. There were two conditions of the experiment. All participants completed both conditions. In Condition A, participants listened to a famous song that is associated with winter and Christmas. In Condition B, participants listened to a famous song that is associated with summer and the sunshine. |
Table 1 shows the frequency of reported temperature scores for Condition A. One of the scores is missing.
Table 1
Reported temperature score | Frequency |
|---|---|
1–5 | 6 |
6–10 | - |
11–15 | 16 |
16–20 | 1 |
21–25 | 2 |
26–30 | 0 |
31–35 | 2 |
36–40 | 1 |
41–45 | 0 |
46–50 | 1 |
The researcher found that participants in Condition B reported the water felt warmer than participants in Condition A.
Using your knowledge of ‘perceptual set’, outline one conclusion that the researcher could make from these findings.
Was this exam question helpful?
Bruner and Minturn investigated the effect of expectation on perception.
Describe Bruner and Minturn’s study.
Was this exam question helpful?
Read the item and then answer the questions that follow.
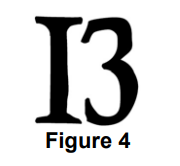 A researcher conducted a study into perception. In condition A, participants were shown a series of letters. Then they were asked to identify the image shown in Figure 4. In condition B, participants were shown a series of numbers. Then they were also asked to identify the image shown in Figure 4. The researcher recorded whether the image was identified as a number or a letter. |
Table 1: The percentage of participants who identified the image as a number or a letter
Condition A | Condition B | |
|---|---|---|
Image identified as a number | 27% | 82% |
Image identified as a letter | 73% | 18% |
Use your knowledge of factors affecting perception to draw a conclusion from the results shown in Table 1.
Explain your answer.
Was this exam question helpful?
Describe one result from Bruner and Minturn’s study into the effects of expectation on perception.
Was this exam question helpful?
Outline one strength and one weakness of Bruner and Minturn’s study into the effects of expectation on perception
Was this exam question helpful?
You have been asked to investigate the effect of motivation on perception.
Explain how you would design an experiment to do this.
You need to include the following information in your answer:
what you would ask the participants to do and what data you would collect
the experimental design you would choose and why this would be suitable
the results you would expect to find from your experiment, including both conditions of the independent variable
Was this exam question helpful?
Bruner and Minturn investigated the effect of expectation on perception.
Which two of the following statements are features of their study?
A | Participants were asked to report and draw what they saw when they recognised it. |
B | Participants were shown an unambiguous image as the test stimulus. |
C | Results showed that expectation did not affect perception. |
D | The independent variable was whether participants were shown a sequence of letters or numbers. |
E | The study used a repeated measures design. |
Briefly evaluate Bruner and Minturn’s study.
Was this exam question helpful?
Gilchrist and Nesberg investigated the effect of motivation on perception.
Which two of the following statements about their study are correct?
A | The control group perceived images of food to be brighter than the food-deprived group. |
B | The independent variable was whether participants were deprived of food or not. |
C | The participants were shown slides of four different meals. |
D | The study used a repeated measures design. |
E | The study was a field experiment. |
Was this exam question helpful?
Bruner and Minturn investigated the effect of expectation on perception.
Describe this study.
Evaluate the research method used in this study.
Was this exam question helpful?
Describe Gilchrist and Nesberg’s study into how motivation affects perception.
Evaluate the research method used in this study.
Was this exam question helpful?
A psychologist carried out a laboratory experiment to see whether or not culture affects perception. He asked Marc and José to look at the three images shown in Figure 2 and decide which image was the odd one out. Marc was brought up on a farm and still lives in a rural part of France. Marc said, “The cat is the odd one out. The sheep and the grass go together best because sheep eat grass.” José was brought up in the Spanish city where he still lives. “No!” said José, “it’s the grass. The cat and the sheep go together best because they are both animals.” |
Figure 2
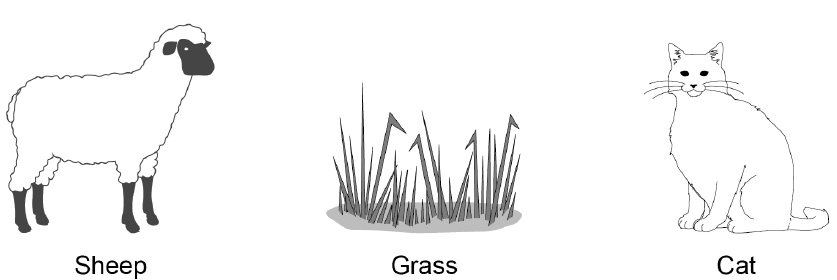
Outline how culture can affect perception. Refer to both Marc and José’s comments in your answer.
Was this exam question helpful?
A researcher studied the effects of emotion on perception.
Two weeks before Christmas, he asked a group of children to each draw a picture of a Christmas tree with presents under it.
Two weeks after Christmas, he asked the same children to each draw a Christmas tree with presents under it.
He counted the number of presents that the children drew before and after Christmas.
Table 1 shows the mean number of presents drawn by children before and after Christmas.
Table 1
Before Christmas | After Christmas | |
|---|---|---|
Mean number of presents drawn by children | 12 | 5 |
Identify the type of data that is shown in Table 1 and explain your answer.
Use your knowledge of how emotion affects perception to explain the results shown in Table 1.
Was this exam question helpful?