Cells & Movement Across Membranes (WJEC GCSE Science (Double Award): Biology): Exam Questions

Exam code: 3430

3 hours24 questions
1
6 marks

Read the following information about blood clotting.

  • Enzymes released into the plasma cause blood to clot.

  • The plasma is at pH 7.4. This is the optimum pH for the enzymes.

  • The clot forms fastest at 37 °C.

  • The clot forms slower if the body temperature falls in very cold weather.

(i) Give one piece of evidence from the information to show that:

I. the optimum temperature for the enzymes is 37 °C;

..........................................

[1]

II. blood plasma is alkaline.

..........................................

[1]

(ii) Complete the table by writing true or false for each statement about enzymes.

The first row has been done for you.

Enzymes

True or False

are made of amino acids

True

are needed to clot blood

..........................................

may be found in the liquid part of blood

..........................................

are lipids

..........................................

have specific active sites

..........................................

are not affected by temperature

..........................................

[4]

2a
2 marks

Cerys makes a slide of her cheek cells. One stage in her method is shown in Image 3.1.

Image 3.1

[Figure: Diagram showing a stage in preparing a microscope slide of cheek cells — a cover slip is being lowered at an angle onto the slide using a mounted needle, with labels for the cover slip, cheek cells, slide and mounted needle]

Using the labels on Image 3.1 describe what Cerys is doing at this stage of her method.

2b
1 mark

Image 3.2 shows a light microscope.

Image 3.2

[Figure: Diagram of a light microscope showing the eyepiece lens (×10), three objective lenses (×10, ×20, ×40), stage and light source]

The lowest magnification of the microscope is ×100.

Calculate the highest magnification of the microscope shown in Image 3.2.

Highest magnification = × ..........................................

2c
2 marks

Cerys drew and labelled a cheek cell. This is shown in Image 3.3.

Image 3.3

[Figure: Labelled diagram of a cheek cell showing the nucleus, cytoplasm and cell membrane]

Complete the table below.

Cell structure

Function

nucleus

..........................................

..........................................

site of most cell reactions

2d
1 mark

Cerys put a drop of stain on the slide before adding her cheek cells.

State the purpose of staining the cells.

2e
2 marks

(i) Using this light microscope, it is not possible to see the mitochondria even at the highest magnification. State the reason for this.

[1]

(ii) Complete the following sentence by underlining the correct word from the brackets.

[1]

The mitochondria can be seen using an (electronic / electron / electric) microscope.

3a
2 marks

Image 6.1 represents the lock and key model of enzyme action involving lipase and milk fat.

Image 6.1

[Figure: Image 6.1 — the lock and key model of enzyme action, showing structure A formed when a lipase molecule and a molecule of milk fat join together, then splitting into molecule B (a fatty acid molecule) and the lipase molecule]

State the name of:

(i) structure A;

...................................................................................................

[1]

(ii) molecule B.

...................................................................................................

[1]

3b
8 marks

A class of students investigated how lipase activity changes with temperature.

They used a pH indicator that is pink in alkaline solutions of about pH 10. When the pH drops below pH 8 it goes colourless.

A solution of full-fat milk, lipase and indicator at pH 10 will change from pink to colourless as the fat in milk is broken down producing fatty acids. This reduces the pH to below 8. The time taken for this reaction to occur is affected by temperature.

The students worked in pairs and set up the apparatus as shown in Image 6.2.

Image 6.2

[Figure: Image 6.2 — apparatus showing a test tube containing 5 cm3 milk and 1 cm3 pH indicator at pH 10, with a syringe containing 5% lipase solution, both standing in a water bath]

Each pair of students investigated a different temperature.

  • The test tube and syringe were placed in a water bath.

  • At 5 minutes, 1 cm3 of lipase solution from the syringe was added to the test tube.

  • The time taken for the solution in the test tube to change from pink to colourless was recorded.

  • The experiment was carried out three times for each temperature.

The class results are shown in Table 6.3.

Table 6.3

Time for indicator to become colourless (s)

Rate of reaction
1 ÷ mean time
(per second)

Temperature (°C)

Trial 1

Trial 2

Trial 3

Mean

0 (ice bath)

no change

no change

no change

no change

0.00

20

8.0

6.0

7.0

7.00

0.14

40

5.0

4.0

5.0

4.67

0.21

60

10.0

9.0

9.0

9.33

......................

80

no change

no change

no change

no change

0.00

(i) The mean time for each temperature can be converted to rate of reaction by calculating 1 ÷ mean time.

Complete Table 6.3 by calculating the rate of reaction at 60 °C. Give your answer to 2 decimal places.

[1]

(ii) On the grid below, draw a line graph of rate of reaction against temperature.

You should join the plots with a ruler.

[Figure: A blank grid with temperature (°C) on the x-axis (0–80) and rate of reaction (per second) on the y-axis (0.000 upwards)]

[4]

(iii) Describe the effect of temperature on the rate of reaction of lipase.

[1]

(iv) Explain the effect of temperature on the rate of reaction between 0°C and 40°C.

[2]

3c
1 mark

State why the test tube and syringe were left in the water bath for 5 minutes before the lipase solution was added to the test tube.

3d
1 mark

Suggest why skimmed milk could not be used in this experiment.

4a
7 marks

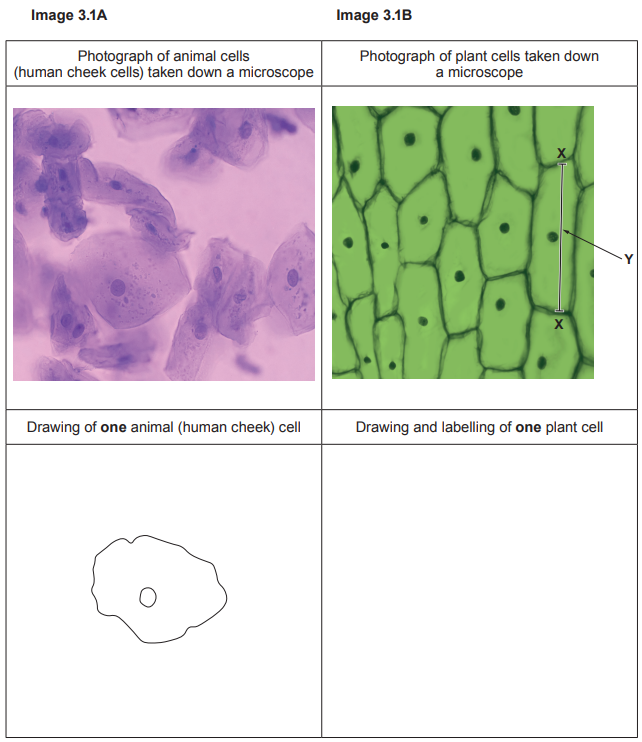
Image 3.1A and 3.1B are photographs taken down a light microscope. Both groups of cells have been treated with biological stains. One of the animal cells (a human cheek cell) has been drawn below its photograph.

Worksheet comparing animal and plant cells: cheek cells in pink stain, rectangular green plant cells with labels X (cell wall) and Y (cell length), plus blank diagrams

(i) Choose one plant cell from Image 3.1B and draw it in the space below Image 3.1B. Label any two parts of the plant cell shown in your drawing. You must not draw or label anything that cannot be seen in the photograph. Do not colour or shade your drawing.

[3]

(ii) State why the cells were treated with biological stains.

[1]

(iii)

I. Measure the length of cell Y along the line X–X and record it below.

[1]

Length of cell Y along line X–X = ................................... mm

II. The actual length of the plant cell labelled Y in Image 3.1B is 70 μm (1 mm = 1000 μm).

Calculate the magnification of cell Y. Use your answer to (iii) I. to help you. Give your answer to two significant figures.

[2]

Magnification of cell Y in Image 3.1B = × ...................................

4b
2 marks

In Image 3.1B it can be clearly seen that similar cells are grouped together.

(i) State the name given to a group of similar cells.

[1]

(ii) Suggest one advantage to the organism of similar cells being grouped together.

[1]

5
2 marks

The cell in Image 1.1 is adapted for one function.

Complete the following sentences by underlining the correct term in the brackets.

(i) Cells adapted for one function are called (special / specialised / specific).

(ii) Groups of similar cells are called (tissues / organs / organisms).

6a
3 marks

Complete the following table about the processes by which substances move through cell membranes.

Place a tick (✓) or a cross (×) in each box to indicate if the statement applies to each process or not.

Active transport

Osmosis

Diffusion

Energy (ATP) needed

........................

........................

........................

Against a concentration gradient

........................

........................

........................

Down a concentration gradient

........................

........................

........................

6b
4 marks

The apparatus shown in Image 7.1 was set up using a piece of Visking tubing filled with sucrose solution. The Visking tubing was knotted at its bottom end and tied at its top end to a length of glass tube. The Visking tubing was then placed in a beaker of water and left for 1 hour. At the end of this time the sucrose solution had risen up the tube.

Image 7.1

[Figure: Image 7.1 — a glass tube tied to Visking tubing filled with sucrose solution, knotted at the bottom, standing in a beaker of water; the diagram shows the sucrose solution having risen in the glass tube above its initial height]

Explain why the sucrose solution moved up the glass tube.

7a
1 mark

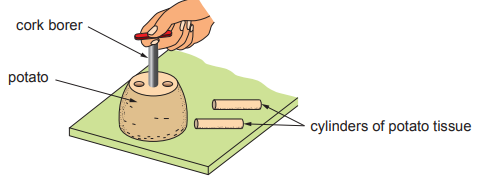
In an experiment on osmosis, students investigated the effect of different concentrations of glucose solution on cylinders of potato tissue. They used a 5 mm diameter cork borer to cut the cylinders. Each of the cylinders was then cut to a length of 40 mm. This is shown in Image 6.1.

Image 6.1

Diagram of a hand using a cork borer to cut cylindrical pieces of potato tissue from a potato on a board, with each part clearly labelled

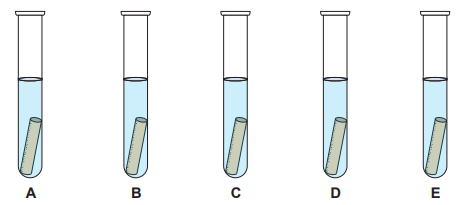
The students set up 5 test tubes A to E. Tube A contained 10 cm3 of distilled water whilst tubes B to E each contained 10 cm3 of glucose solution of different concentrations. A potato cylinder was placed in each of the test tubes and left for 2 hours. After this time the cylinders were removed and their final lengths were recorded. The contents of each tube and the results are shown in Table 6.2.

Table 6.2

Five test tubes labelled A–E, each half full of liquid with a slanted submerged rod, showing the same apparent depth in every tube.

Tube

A

B

C

D

E

Concentration of glucose solution (%)

0 (distilled water)

1

2

3

4

Initial length of cylinders (mm)

40

40

40

40

40

Final length of cylinders (mm)

43

41

39

37

35

Change in length of cylinders (mm)

...............................

...............................

...............................

...............................

...............................

Complete Table 6.2 by calculating the change in length of the potato cylinders.

7b
3 marks

Explain the change in length of the potato cylinder in Tube B.

7c
3 marks

(i) Use Table 6.2 to estimate the concentration of glucose solution which would cause no change of length of a potato cylinder.

[1]

Concentration = ................................... %

(ii) Describe how the students could improve their investigation to obtain a more accurate value for the concentration of glucose solution that would cause no change in the length of a potato cylinder.

[2]

7d
1 mark

Another group of students was asked by their teacher to test the reproducibility of the above experiment. State one other variable, the value of which they would need to know, before they could proceed.

8a
11 marks

The increasing importance of the commercial use of kelp has led scientists to conduct experiments in an attempt to grow them in land-based factories. In one experiment, sugar kelp (Laminaria saccharina) was grown in seawater in large vertical glass flasks. Scientists were trying to establish if the concentration of oxygen contained in the seawater affected the absorption of iodine by the kelp.

[Figure: Diagram of a vertical glass cylinder (Flask 4) containing kelp in seawater under light, with an oxygen supply bubbling in from below. Labelled conditions: temperature 14°C, iodine concentration = 0.055 mg/kg]

One set of results from the experiment is shown in the table.

Flask No.

Rate of flow of oxygen into flask (dm3 / minute)

Mass of iodine extracted from kelp (mg / kg)

1

0.0

45

2

0.5

140

3

1.0

259

4

1.5

676

5

2.0

740

6

2.5

780

7

3.0

780

(i) On the grid below, plot a line graph for the mass of iodine against the rate of oxygen flow. You must add suitable scales to each axis. Join the plots with a ruler.

[Figure: Blank graph grid for plotting mass of iodine extracted (mg/kg) against rate of flow of oxygen (dm3/minute)]

[4]

(ii) Describe the effect of increasing the rate of flow of oxygen above 2.5 dm3 / minute on the mass of iodine extracted.

[1]

(iii) The kelp used in the 7 flasks were of different sizes but the experimental results could still be compared. Explain how this was possible.

[1]

(iv) For Flask 4 calculate how many times greater the concentration of iodine is in the kelp compared to the concentration of iodine in seawater. Give your answer in standard form.

Answer = ............................................... × greater

[2]

(v) The only source of iodine for kelp is the seawater in which they live. Explain how kelp is able to accumulate iodine against a concentration gradient.

[3]

8b
1 mark

Another group of scientists want to test the reproducibility of the above experiment. State one other controlled variable, the value of which they would need to know, before they could proceed.

9a
2 marks

The diagram shows a plant cell. Some structures have been labelled.

[Figure: Diagram of a plant cell showing labelled structures: nucleus, cytoplasm, chloroplast, mitochondria, cell wall, cell membrane, and unlabelled structures P, X and Y, with a scale line from X to Y across the cell]

(i) Use a ruler to measure the length of the cell at X – Y in mm.

length at X – Y = ............................ mm

[1]

(ii) The diagram is magnified ×400.

Use your answer to part (i) to calculate the actual length of the cell.

actual length = ............................. mm

[1]

9b
1 mark

State the name of structure P.

.................................................

9c
4 marks

Complete the following table about plant cells.

Name of structure

Function

...............................................................................

respiration

...............................................................................

controls entry and exit of materials

chloroplasts

...............................................................................

...............................................................................

contains chromosomes

10a
1 mark

This question is about enzymes.

Complete the following sentence by underlining the correct word.

Enzymes are made of carbohydrate / lipid / protein.

10b
2 marks

Graph 3.1 shows the effect of increasing pH on the rate of activity of an enzyme.

Graph 3.1

[Figure: line graph showing enzyme activity against pH from 4 to 11, activity rises to a peak at the optimum pH then falls]

Use Graph 3.1 to describe how increasing pH affects enzyme activity.

10c
3 marks

Image 3.2 shows an enzyme, a denatured enzyme and a substrate molecule.

Image 3.2

[Figure: diagram comparing an enzyme with an intact active site, a denatured enzyme with a deformed active site, and a substrate molecule]

(i) Describe what has happened to the active site in the denatured enzyme.

[1]

(ii) Enzymes react with substrates to produce products.

Explain why the denatured enzyme can no longer produce products.

[2]

10d
2 marks

State two variables that could denature an enzyme.

.......................................................... ..........................................................

11a
2 marks

A hen's egg is a single cell which is surrounded by a calcium carbonate shell.

Six hen's eggs were soaked in 4% ethanoic acid for 24 hours to dissolve their shells. After this time each egg is still intact as it is surrounded by a cell membrane. The initial masses of the 'naked eggs' (eggs without shells) were recorded.

[Figure: Photograph of a 'naked egg' — a hen's egg with its shell dissolved away, leaving only the membrane-bound contents intact]

The six 'naked eggs' were each placed in sucrose (sugar) solutions of different concentrations and left for 24 hours. After this time the final masses of the 'naked eggs' were recorded.

Egg number

Concentration of sucrose solution (%)

Initial mass (g)

Final mass (g)

Change in mass (g)

% change in mass

1

0

61.5

67.2

5.7

9.3

2

5

64.3

68.9

4.6

7.2

3

10

59.8

63.2

3.4

5.7

4

15

60.7

59.8

–0.9

–1.5

5

20

62.6

59.9

–2.7

–4.3

6

25

60.9

56.1

–4.8

.............

Complete the table above by calculating the % change in mass for egg number 6.

Space for working.

11b
2 marks

In the graph below the % change in mass of the 'naked eggs' is plotted against the concentration of sucrose solution.

[Figure: Graph plotting % change in mass (y-axis, -8 to +10) against concentration of sucrose solution (%) (x-axis, 0-25), with points plotted for eggs 1-5 already shown]

(i) Complete the graph by adding the percentage change in mass for egg number 6.

[1]

(ii) From the graph state the concentration of sucrose solution where there was no net movement of water.

concentration of sucrose solution = .................. %

[1]

11c
4 marks

Explain the results for egg number 3 and egg number 5.

11d
1 mark

The photograph below shows a complete hen's egg on the right and one of the 'naked eggs', used in this experiment, on the left.

[Figure: Photograph comparing a complete hen's egg (with shell, on the right) to a 'naked egg' (shell dissolved, appearing swollen/enlarged, on the left)]

Suggest a concentration of sucrose solution in which this 'naked egg' was kept.

suggested concentration of sucrose solution = .......................... %

12a
1 mark

Rhys studies some plant tissue using the instrument shown below.

[Figure: Diagram of a light microscope showing the eyepiece lens and objective lenses]

State the name of the instrument shown in the diagram.

12b
2 marks

The table shows the magnification of each of the four lenses.

Calculate the maximum magnification that is possible with this instrument.

Lens

Magnification

eyepiece lens

×10

low power objective lens

×4

medium power objective lens

×10

high power objective lens

×40

maximum magnification = × .......................

12c
1 mark

Rhys places some of the plant tissue in water on a slide and lowers a cover slip on top as shown below.

[Figure: Diagram showing a slide preparation with plant tissue in water and a cover slip being lowered on top]

He draws one cell from the tissue as seen under the maximum magnification. His drawing is shown below.

[Figure: Simple drawing of a single plant cell with only the nucleus labelled]

State what Rhys could have done to the plant tissue to show more detail of the cell structures.

12d
1 mark

State the function of the nucleus.

13
6 marks

Scientists investigated absorption of three different sugars in a sample of healthy small intestine in the laboratory. They analysed the absorption of the sugars in the presence or absence of cyanide. Cyanide is a chemical that prevents respiration taking place in cells.

The results are shown in Table 5.2.

Table 5.2

Sugar

Absorption without cyanide (a.u.)

Absorption with cyanide (a.u.)

glucose

100

33

xylose

30

30

arabinose

29

29

Use the information in Table 5.2 to answer the following questions.

(i) State which sugar is absorbed by active transport. Explain your answer.

[4]

(ii) One of the scientists stated that all three of the sugars in the investigation could be absorbed by diffusion. Explain how the evidence in Table 5.2 supports this conclusion.

[2]

14a
1 mark

State the meaning of the term diffusion.

14b
7 marks

After a lesson on the properties of cell membranes a year 10 class was asked to investigate some of these properties using Visking tubing. They were given the following instructions:

  • Soak a 15 cm length of Visking tubing in water to soften it.

  • Tie a knot in one end of the tube.

  • Fill the tube with a solution made up of protein and glucose dissolved in water.

  • Tie a knot in the open end of the tube.

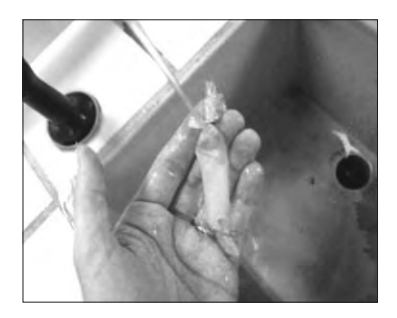
  • Wash the tube under a stream of tap water for 15 seconds.

  • Using a glass rod, suspend the Visking tubing in a beaker of distilled water.

Photograph of a student rinsing a tied length of Visking tubing under a running tap over a sink, holding the tube in one hand while water flows over it.

The diagram below shows how your apparatus should appear.

[Figure: Diagram of a glass rod suspending a Visking tubing bag (knotted tightly at both ends, containing protein and glucose solution) in a beaker of distilled water]

(i) Why were the students instructed to 'wash the tube under a stream of tap water for 15 seconds'?

[1]

The students were asked to sample the distilled water in the beaker for the presence of both glucose and protein at the start of the experiment and every minute for the next four minutes.

Dafydd decided to photograph his results on his smart phone. The photographs he obtained are shown below.

[Figure: Photographs showing the Benedict's test for glucose (start, 1 minute, 2 minutes, 3 minutes, 4 minutes) — colour progressively changes from blue towards brick-red over time; and the Biuret test for protein (start, 1 minute, 2 minutes, 3 minutes, 4 minutes) — colour remains unchanged (no protein detected) at all time points]

(ii) Explain Dafydd's results, at four minutes, for the contents of the beaker for both the Benedict's test and the Biuret test.

Benedict's test

[3]

Biuret test

[3]

15a
5 marks

The photograph shows one labelled blood cell from the circulatory system.

[Figure: A photograph of a labelled white blood cell from the circulatory system, with structures A and B labelled]

(i) Complete the table by stating the name and function of structures A and B.

Structure

Name

Function

A

............................................................................

..........................................................................................
..........................................................................................

B

............................................................................

..........................................................................................
..........................................................................................

[4]

(ii) The cell contains many mitochondria. State the function of mitochondria.

[1]

15b
1 mark

Complete the table below by using words from the list to identify an organ, and a cell from the human circulatory system.

heart

lung

palisade

trachea

phagocyte

Organ system

Organ

Tissue

Cell

circulatory

...........................................

muscle

...........................................

15c
5 marks

The diagram below shows a red blood cell.

[Figure: A diagram of a red blood cell showing its diameter as 8.0 μm]

(i)

I. Complete the following calculation.

diameter of red blood cell = 8.0 µm

radius (r) = 4.0 µm

Radius2 = ....................................... µm2

[1]

II. Use your answer to part I. and the formula 3.14 × radius2, to calculate the surface area of one side of a red blood cell to the nearest whole number.

Surface area of one side of red blood cell = .................... µm2

[1]

(ii) Red blood cells have a large surface area.

State the function of red blood cells and suggest how a large surface area helps red blood cells to be more efficient.

[2]

(iii) Red blood cells are specialised cells.

Give the meaning of the term specialised cell.

[1]

16
1 mark

Sarah was viewing a smear of blood under a light microscope. How could she calculate the magnification of the microscope she was using?

17a
3 marks

Visking tubing has small pores (holes) in its membrane. Students investigated the movement of molecules through membranes using Visking tubing.

The students set up the apparatus shown below.

[Figure: Apparatus showing Visking tubing containing glucose solution and a glass rod, tied tightly at both ends with thread, placed in a beaker of water]

They took samples of water from the beaker at the start and at 15 minutes.

They tested the samples for the presence of glucose using Benedict's reagent.

The results are shown in the table.

Test

Observations

at the start

at 15 minutes

Benedict's reagent

blue

brick red

From the table:

(i) State the conclusion that can be made from the Benedict's test observation at the start.

[1]

(ii) Explain the observations at 15 minutes for the Benedict's test.

[2]

17b
3 marks

During the investigation, a number of processes occurred.

Use the information opposite to complete the following table by writing true or false against each statement. One has been done for you.

Statement

True or false

The water in the beaker became a solution.

.....................................

The concentration of the glucose solution in the tubing increased.

.....................................

Osmosis occurred.

true

Water molecules passed through the membrane.

.....................................

The number of water molecules in the tubing increased.

.....................................

[3]

18
2 marks

Carbohydrase is the enzyme that digests the starch in pasta into simple sugars. Protease is an enzyme that digests protein.

[Figure: Two diagrams comparing enzyme molecule structures — Structure of a molecule of carbohydrase and Structure of a molecule of protease, each showing long chains of amino acids joined together, folded into a distinct 3D shape]

With reference to the diagrams, suggest how each of the enzyme molecules are different and state why it is important that the chains of amino acids are folded.

19
3 marks

Complete the following sentences about enzymes using some of the words from the list below.

digestion

photosynthesis

diffusion

respiration

osmosis

Some enzymes break down large molecules into small molecules, for example during ......................................................................... and ......................................................................... .

Other enzymes build up large molecules from small molecules, for example during ......................................................................... .

20
3 marks

Many different types of molecules pass across cell membranes.

Complete the table below to show the direction of movement of molecules between blood and muscles. Place one tick (✓) in each row.

Molecule

From blood to muscles

From muscles to blood

To and from blood and muscles

oxygen

carbon dioxide

water

21a
6 marks

Describe the method you would use to make a slide of your own cheek cells using the apparatus below.

[Figure: Apparatus for preparing a cheek cell slide, showing a glass slide, methylene blue stain, cover slip, mounted needle, and cotton wool bud]
21b
1 mark

Make a large drawing of one cheek cell in the box below.

Include the cell structures you would see when viewed at the highest magnification of a light microscope. No labels are required.

plain box
22a
2 marks

Rhys was asked by his teacher to set up a light microscope so that he could view some cells at a magnification of ×100. The microscope had three objective lenses of ×4, ×10 and ×40 magnifications. Rhys was also given a prepared slide of muscle cells.

[Figure: Diagram of a light microscope showing the eyepiece lens (×10), an objective lens, structure A, the stage, and the mirror]

Explain how Rhys could view the muscle cells at a magnification of ×100.

22b
1 mark

State the function of structure A on the diagram.

22c
2 marks

When Rhys viewed the muscle cell under the microscope he could see that the cells were not found on their own, but were grouped together in large numbers.

(i) Muscle cells are described as being specialised cells. State the advantage to the organism of having specialised cells.

[1]

(ii) State the name given to a large number of the same cells grouped together.

.............................................................................................................

[1]

22d
1 mark

In biology, what is meant by the term organ?

23a
3 marks

Use some of the following words to complete the table about enzymes.

fatty acids

lipids

amino acids

glucose

glycerol

Enzyme

Substrate

Products

protease

protein

.......................................

lipase

...............................

.............................. and .............................

23b
1 mark

The diagram shows four enzymes A – D and four substrates 1 – 4.

[Figure: Diagram showing four enzymes (A, B, C, D) each with a differently-shaped active site, and four substrate molecules (1, 2, 3, 4) each with a differently-shaped matching region, illustrating the lock and key theory]

Use your knowledge of the lock and key theory to complete the table below by matching each enzyme to its substrate.

Enzyme

Substrate

A

.........................

B

.........................

C

.........................

D

.........................

23c
5 marks

The graph shows the effect of temperature on the rate of an enzyme controlled reaction between 10 °C and 50 °C.

[Figure: Line graph showing rate of reaction (a.u., y-axis 0-9) against temperature (°C, x-axis 10-50). The rate rises from 10°C to a peak around 35°C (rate 6 a.u.), then falls sharply towards 50°C]

(i) From the graph, describe the effect of temperature on the rate of the reaction between 10 °C and 50 °C.

[3]

(ii) Most enzymes are denatured by boiling.

Use your answer to part (b) to help explain why a denatured enzyme can no longer work.

[2]

24
5 marks

Visking tubing acts as a model of absorption in the digestive system.

The diagram shows a Visking tubing bag filled with a solution of starch and glucose, in a beaker of water.

Samples from inside the Visking tubing bag and the water in the beaker were tested for starch and glucose at the start. This was repeated after 10 and 20 minutes.

[Figure: Diagram of a Visking tubing bag containing starch and glucose solution, suspended in a beaker of water]

(i) Complete the table below by writing a ✓ or ✗ in each space to show the expected results at 20 minutes.

key: ✓ molecule present; ✗ molecule absent

Sample tested

Tested for

Start

Time after start (minutes)

10

20

Contents of Visking tubing bag

starch

✓

✓

✓

glucose

✓

✓

............

Water in the beaker

starch

✗

...........

............

glucose

✗

............

............

[3]

(ii) Use your knowledge of the size of starch and glucose molecules to explain the expected results at 20 minutes for the water in the beaker.

[2]