State the function of chlorophyll.
James investigated photosynthesis in a potted plant using the following method:
Place a potted plant in the dark for 24 hours to destarch the leaves.
After 24 hours, set up the apparatus as shown in in Image 1.1.
Image 1.1
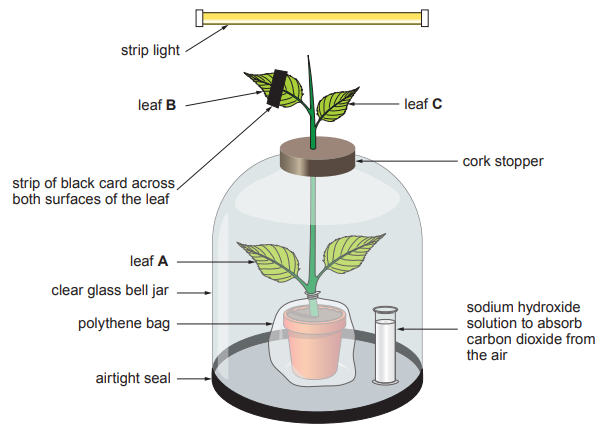
Leave the apparatus containing the potted plant in bright light for 24 hours.
Remove leaves A, B and C, then:
remove the card from leaf B
place the leaves in boiling water
place the leaves in boiling ethanol to remove the chlorophyll
dip the leaves in hot water and blot dry
Carry out the starch test by dropping iodine solution onto the leaves.
The appearance of each leaf after the starch test is shown in Image 1.2.
Image 1.2
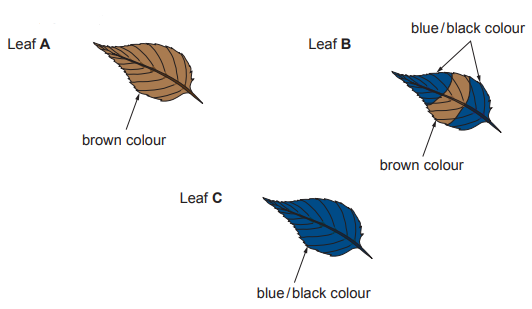
(i)
I. Explain the results for leaf A in Image 1.2.
[3]
II. Explain the appearance of the brown band across the middle of leaf B in Image 1.2.
[2]
(ii) Identify the control leaf (A, B, or C) and give the reason for your choice.
Leaf: ..........................................
[1]
Reason: ..........................................
[1]
Was this exam question helpful?
![[Figure: A diagram showing light energy falling on and reflected from leaves of two Pelargonium varieties. Variety A: 25 J light energy falling on leaf, 16 J light energy reflected from leaf, giving 64% light energy reflected (shown). Variety B: 25 J light energy falling on leaf, 20 J light energy reflected from leaf]](https://cdn.savemyexams.com/cdn-cgi/image/f=auto,width=3840/https://cdn.savemyexams.com/uploads/2026/08/24849-6b.png)
![[Figure: A graph showing the rate of photosynthesis (arbitrary units) for Variety A and Variety B plotted against time (06.00 to 18.00 hours)]](https://cdn.savemyexams.com/cdn-cgi/image/f=auto,width=3840/https://cdn.savemyexams.com/uploads/2026/08/65141-6c.png)
![[Figure: diagram of laboratory apparatus for investigating photosynthesis rate - a boiling tube containing pondweed and sodium hydrogen carbonate (NaHCO3) solution (releases carbon dioxide when added to water), a lamp positioned at a measurable distance using a metre ruler, a spatula, and a stop clock]](https://cdn.savemyexams.com/cdn-cgi/image/f=auto,width=3840/https://cdn.savemyexams.com/uploads/2026/08/57514-3-1.png)
![[Figure: photograph of a violet plant (Viola riviniana) growing among other vegetation]](https://cdn.savemyexams.com/cdn-cgi/image/f=auto,width=3840/https://cdn.savemyexams.com/uploads/2026/08/50131-1-1.png)
![[Figure: grid diagram showing the outline of a leaf drawn over a square grid, used for counting whole squares to estimate leaf area]](https://cdn.savemyexams.com/cdn-cgi/image/f=auto,width=3840/https://cdn.savemyexams.com/uploads/2026/08/14444-1-2.png)
![[Figure: Image 4.1 — a screenshot of a photosynthesis simulation showing sliders for temperature (30.0 °C), light intensity (79%) and CO2 concentration (0.2%)]](https://cdn.savemyexams.com/cdn-cgi/image/f=auto,width=3840/https://cdn.savemyexams.com/uploads/2026/08/32432-4-1.png)
![[Figure: Graph 4.2 — rate of photosynthesis (volume of oxygen produced per hour) plotted against light intensity (%) for four investigations: Investigation A (30°C, 0.2% CO2), Investigation B (20°C, 0.2% CO2), Investigation C (30°C, 0.1% CO2), Investigation D (20°C, 0.1% CO2), with point X marked on one of the curves]](https://cdn.savemyexams.com/cdn-cgi/image/f=auto,width=3840/https://cdn.savemyexams.com/uploads/2026/08/49355-4-2.png)
![[Figure: Photograph of Tradescantia leaves, showing green and white variegated colouring]](https://cdn.savemyexams.com/cdn-cgi/image/f=auto,width=3840/https://cdn.savemyexams.com/uploads/2026/09/6935-7.png)
![[Figure: Diagram of three experimental setups using Tradescantia plants. Setup A: a leaf partly covered with black paper, with the appearance after a starch test (A1) showing blue-black areas except where covered by black paper. Setup B: a Tradescantia plant with cotton wool and a flask of 20% sodium hydroxide solution, with the appearance after a starch test (B1) showing a green area appearing white/no blue-black colour, compared to a blue-black area before the starch test. Setup C: a leaf tested for starch (C1) showing a blue-black area (green part) and a brown area (white part) before the starch test]](https://cdn.savemyexams.com/cdn-cgi/image/f=auto,width=3840/https://cdn.savemyexams.com/uploads/2026/09/38606-7aii.png)
![[Figure: Diagram showing four numbered stages of the starch test procedure for a Tradescantia leaf: (1) leaf placed in boiling liquid, (2) leaf placed in a second liquid with the Bunsen burner removed, (3) leaf rinsed in a third liquid on a white tile, (4) leaf covered with a fourth liquid to observe the colour change]](https://cdn.savemyexams.com/cdn-cgi/image/f=auto,width=3840/https://cdn.savemyexams.com/uploads/2026/09/24503-7b.png)
![[Figure: Image 1.1 — an incomplete diagram of a plant leaf cell, showing labelled structure X (chloroplast) but missing the cell wall]](https://cdn.savemyexams.com/cdn-cgi/image/f=auto,width=3840/https://cdn.savemyexams.com/uploads/2026/08/4578-1-1.png)
![[Figure: Photo showing part of a kelp 'forest' with a sub-aqua diver swimming among tall kelp fronds]](https://cdn.savemyexams.com/cdn-cgi/image/f=auto,width=3840/https://cdn.savemyexams.com/uploads/2026/08/40668-4a.png)
![[Figure: Diagram of the sealed container apparatus, showing a lamp above a plant, an oxygen meter monitoring O2 production, and dials for light intensity (0-100%), CO2 concentration (0-1000 ppm), and temperature (0-50°C)]](https://cdn.savemyexams.com/cdn-cgi/image/f=auto,width=3840/https://cdn.savemyexams.com/uploads/2026/08/49268-6.png)