Digestion & the Digestive System in Humans (WJEC GCSE Science (Double Award): Biology): Exam Questions

Exam code: 3430

2 hours17 questions
1a
4 marks

Image 5 shows the daily recommended percentages of certain foods in the diet.

Image 5

[Figure: Pie chart titled "foods high in fat and/or sugar" showing daily recommended diet percentages — fruit and vegetables 30%, bread/rice/potatoes/pasta 30%, meat/fish/eggs/beans 15%, dairy 15%, and the remaining unlabelled segment representing foods high in fat and/or sugar]

(i) Use Image 5 to calculate the percentage of the diet containing foods high in fat and/or sugar.

[2]

Space for working.

Percentage = ..........................................

(ii) In a survey, most people said they ate more fat and sugar than is considered healthy.

State two health problems related to eating too much fat.

[2]

1. ..........................................

2...........................................

1b
6 marks

A public health campaign is planned to take place in Wales starting in July 2025. The aim of the campaign is to increase the number of people who eat a healthy diet by July 2026.

Whether or not the campaign is successful will be assessed using the survey sheet below both before and after the campaign.
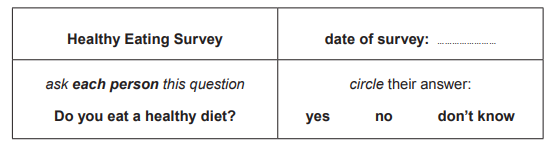
Healthy Eating Survey form asking “Do you eat a healthy diet?” with options yes, no, don’t know and a blank space to write the survey date

Describe how you would do the survey using the above sheet.

Your answer should include:

  • how you would make your survey representative of the whole population of Wales;

  • when you would do the survey;

  • how you would decide if the campaign was successful.

[6 QER]

2
6 marks

The beaker in Image 5 contains 150 cm3 of an unknown solution.

Image 5

[Figure: diagram of laboratory equipment - a 150 cm3 beaker containing brown iodine solution, a 10 cm3 syringe, a pipette/dropper, a test tube in a rack, and eye protection goggles. Diagram not drawn to scale]

Using all the materials shown in Image 5 describe how you would:

  1. transfer 10 cm3 of the solution from the beaker to the test tube

  2. test it for starch

State the colour change if starch is present.

[6 QER]

3a
2 marks

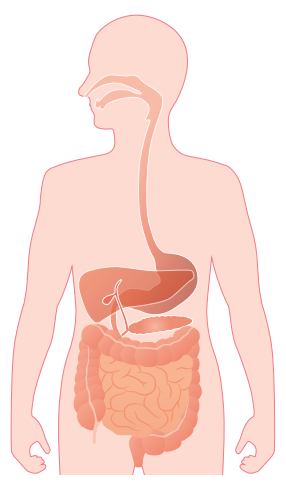
Image 4.1 shows the human digestive system.

Image 4.1

Diagram of a human torso showing the digestive system, including oesophagus, stomach, liver, gallbladder, pancreas, small intestine and large intestine

Use labelled arrows to identify the following organs on Image 4.1.

(i) gall bladder

(ii) pancreas

3b
7 marks

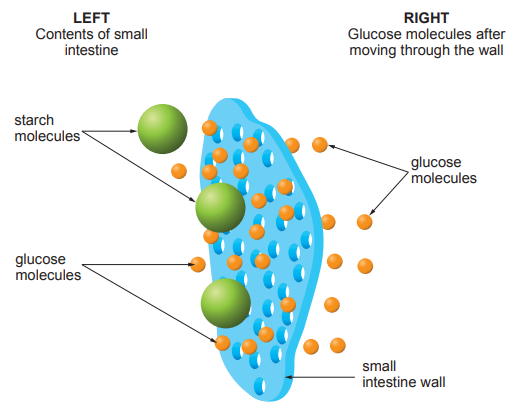
Image 4.2 represents a part of the wall of the small intestine. The left side of the diagram represents the contents of the small intestine.

Image 4.2

Diagram of the small intestine wall showing large starch and small glucose molecules, with glucose passing through the wall into the right-hand side.

(i) The only food substance originally in the contents of the small intestine was starch. Explain the presence of glucose in the small intestine.

[2]

(ii) Absorption involves the movement of glucose molecules through the wall of the small intestine.

I. Name the process that enables absorption to take place.

[1]

.......................................................................................

II. In the human body, the glucose moves into a fluid on the right side of the intestine wall. Give the name of this fluid.

[1]

.......................................................................................

(iii)

I. If the only food substance in the contents of the small intestine was protein, state what would be found on the right side of the diagram.

[1]

.......................................................................................

II. Explain your answer.

[2]

3c
2 marks

In a food test investigation some students were given a beaker containing an unknown solution. They were asked to use two different chemical reagents to identify the foods in the solution. The table below shows some of the observations recorded by one of the students.

Complete the table.

Name of reagent

Colour of reagent at start of test

Colour of reagent at end of test

Food present in solution

...............................

blue

purple/violet

...............................

...............................

...............................

brick red

glucose

4a
2 marks

The diagram below shows part of the human digestive system.

[Figure: Diagram of part of the human digestive system with two unlabelled structures marked A and B for the candidate to identify]

On the diagram above label the following:

A pancreas

B bile duct

4b
7 marks

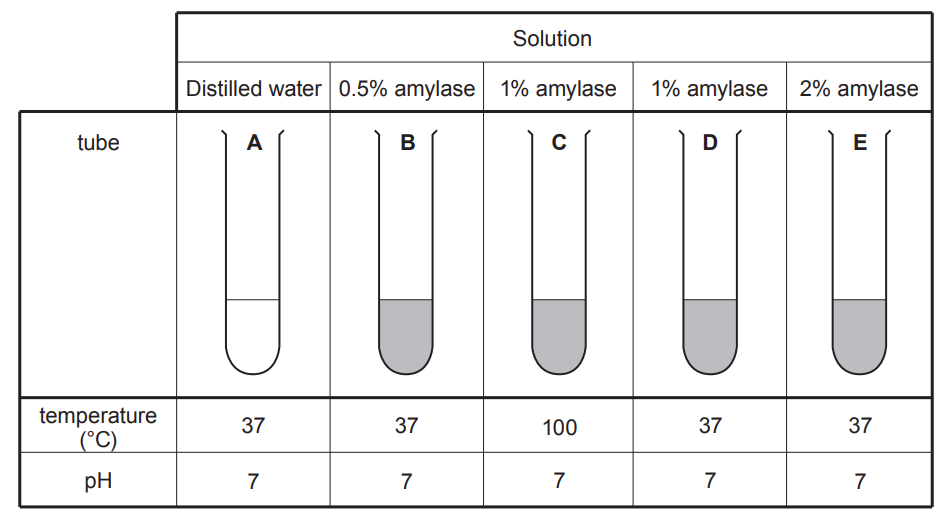
The diagram below shows five test tubes A – E and their contents. The pH and temperature of each is also shown.

Diagram showing five labelled test tubes, A to E, with their solutions, temperatures and pH presented in a table; tubes B to E contain shaded liquid, while A contains distilled water.

A pupil carried out the following procedure:

  • She took a Petri dish containing starch-agar (a set jelly in which starch had been dissolved).

  • She cut five small holes in the jelly (holes 1 – 5).

  • She put 1 cm3 distilled water from Tube A into hole 1.

  • Holes 2 – 5 were each filled with 1 cm3 of a different solution from one of test tubes B, C, D or E.

  • After one hour she flooded the Petri dish with iodine solution.

[Figure: Cross-sectional diagram showing two of the five holes cut into the starch-agar in a Petri dish, one at the start (filled with 1 cm3 distilled water) and one after one hour, showing a clear area (not stained blue-black by iodine solution) around a hole where starch has been digested, surrounded by agar stained blue-black by iodine solution]

(i) Explain the appearance of the clear areas.

[1]

(ii) State the solution that was added to hole 2. Explain your answer.

[2]

(iii) Which hole contained the contents of tube C? Explain your answer.

Hole number ..............................................

Explanation ......................................................................................................

[4]

4c
1 mark

State the purpose of tube A, the contents of which was put into hole 1.

5a
2 marks

Image 2.1 shows the digestive system. Some structures have been labelled.

Image 2.1

[Figure: diagram of the digestive system with structures labelled oesophagus, stomach, pancreas, and gall bladder]

Complete the following sentences by underlining the correct word.

(i) Peristalsis in the digestive system causes food to be

digested / moved / absorbed.

[1]

(ii) One organ where peristalsis happens is the

gall bladder / oesophagus / pancreas.

[1]

5b
1 mark

State the name of the organ labelled in Image 2.1 in which the chemical digestion of protein starts.

5c
4 marks

(i) The liver makes bile.

On Image 2.1, draw an arrow to label the liver.

[1]

(ii) Bile helps us digest fat.

Complete Table 2.2 by writing true or false against each statement. One has been done for you.

[3]

Table 2.2

How bile works

True or false

increases the number of fat molecules

false

turns large droplets of fat into smaller droplets

..........................................

increases the pH in the small intestine

..........................................

digests fat molecules

..........................................

neutralises stomach acids in the small intestine

..........................................

5d
1 mark

Fat is an important part of the diet.

State one function of fat in the body.

5e
3 marks

Eating excess fat can lead to obesity.

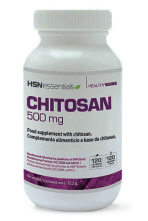
Chitosan is a product that can help people lose weight.

White plastic bottle of HSNessentials Health Series Chitosan 500 mg capsules, 120-count food supplement, with purple and grey label design

Chitosan stops the digestion of fat.

(i) Explain why taking Chitosan would increase the amount of fat in the waste leaving the body.

[2]

(ii) Suggest one reason why taking Chitosan as part of a diet might be harmful to health.

[1]

6
1 mark

Why is it not possible to conclude from the data that Paul's low fitness index is due to obesity?

7a
2 marks

Image 5.1 shows part of the digestive system.

Image 5.1

[Figure: diagram of part of the digestive system, showing the oesophagus and unlabelled structures A, B, and C]

Label parts A to C on Image 5.1.

A .................................................

B .................................................

C .................................................

7b
1 mark

Explain why carbohydrase cannot digest fat.

7c
1 mark

Image 5.3 shows the structure of the lining of the small intestine of a healthy individual and an individual with coeliac disease. Coeliac disease causes a flattening of the villi lining the small intestine.

Image 5.3

[Figure: diagram comparing normal villi lining the small intestine with villi affected by coeliac disease, showing the flattened, reduced structure in the affected tissue]

Use Image 5.3 to explain why individuals who have coeliac disease are unable to fully absorb their digested food.

8a
6 marks

Dried milk powder and whey powder both contain protein. A weight lifter wanted to determine which would be more beneficial in his diet for his performance.

In order to do this, he first prepared equal volumes of known concentrations of protein for comparison. He then added 5 cm3 of 5% enzyme solution to each and recorded the time taken for the protein-enzyme mixture to go from cloudy to clear. This colour change is shown in Image 7.1.

Image 7.1

[Figure: two test tubes showing the colour change before and after enzyme is added to the protein solution - cloudy before, clear after]

His results are shown in the Graph 7.2.

Graph 7.2

[Figure: line graph showing time taken for mixture to change from cloudy to clear (s, 0-120) against concentration of protein (%, 0-50), with time decreasing as protein concentration increases]

(i) State the independent and dependent variables.

[2]

Independent variable .................................................................................

Dependent variable ......................................................................................................................

(ii) Name the type of enzyme which was added to the protein and explain the change in appearance from cloudy to clear.

[2]

(iii) State one source of uncertainty in the experimental method and suggest how it could be overcome.

[2]

8b
2 marks

The weight lifter then carried out the experiment using a sample of dried milk powder followed by a sample of whey powder. The milk powder took 72 seconds to clear and the whey powder took 100 seconds to clear.

Use data from Graph 7.2 to explain why the weight lifter concluded he should use whey powder rather than dried milk powder in his diet to improve his performance.

9a
5 marks

Image 5.1 shows the digestive system.

Image 5.1

[Figure: Image 5.1 — a diagram of the human digestive system with the mouth, oesophagus, liver, gall bladder, bile duct, stomach, pancreas, small intestine and large intestine labelled]

Choose named structures from Image 5.1 to complete Table 5.2.

Table 5.2

Function

Name of structure

Starts digestion of starch

..............................

Carries bile from gall bladder

...............................

Absorbs water from undigested food waste

..............................

Absorbs digested food molecules into the blood

.............................

Makes lipase

.............................

9b
6 marks

Visking tubing has small holes in its wall which only allow small molecules to pass through.

Dafydd studies a computer model which uses Visking tubing to show part of the digestive system in action.

The stages involved are shown in Image 5.3.

Image 5.3

[Figure: Image 5.3 — four stages of a Visking tubing model. Stage 1: Visking tubing containing starch molecules is placed in a beaker of water. Stage 2: enzyme molecules are added to the Visking tubing. Stage 3: starch molecules inside the tubing are broken down into glucose molecules. Stage 4: glucose molecules appear in the water outside the Visking tubing]

Using all the information shown in stages 1, 2, 3 and 4, explain how glucose appears in the water outside the Visking tubing in stage 4.

10a
3 marks

The nutrition information in Table 6.1 is taken from a pack of dried pasta.

Clear plastic bag filled with spiral pasta, labelled PASTA in large black letters on a white rectangular label on the front

Table 6.1

TYPICAL VALUES

Per 100 g (of dried pasta)

Energy

761 kJ

Fat

1.3 g

of which – saturated

0.1 g

of which – unsaturated

.............. g

Carbohydrates

25.0 g

of which – sugars

2.3 g

Fibre

7.7 g

Protein

13.0 g

Salt

0.05 g

(i) Calculate the value for unsaturated fats. Write your answer in Table 6.1.

Space for working.

[1]

(ii) State the name of the nutrient which makes up most of the carbohydrates in the dried pasta.

.......................................................................................

[1]

(iii) State the importance of a low-salt diet.

[1]

10b
6 marks

Lloyd and Emma carried out an experiment to compare the energy values in Table 6.1 with values they obtained using the apparatus shown in Image 6.2.

Image 6.2

![[Figure: Image 6.2 — apparatus showing a piece of burning pasta held under a boiling tube containing 20 cm3 of water, with a thermometer in the water and a Bunsen burner used to ignite the pasta]]

They ignited a 1.6 g piece of dried pasta using the Bunsen burner and immediately held the burning pasta at the base of the boiling tube until it stopped burning. The results Lloyd and Emma obtained are shown in Table 6.3.

Table 6.3

Mass of pasta (g)

Initial temperature of water (°C)

Final temperature of water (°C)

Increase in temperature of water (°C)

Energy released per gram of food (kJ)

1.6

14

58

44

..............

(i) Use the following formula to calculate the energy released per gram of food (kJ). Write your answer in Table 6.3.

Energy released per gram (kJ) = volume of water (cm3) × temperature increase (°C) × 0.0042 mass of pasta sample (g)

[2]

(ii)

I. State how the energy content of dried pasta in Table 6.3 compares to the energy content indicated in Table 6.1. You must use numerical data in your answer.

[2]

II. Give one reason for the difference between the energy content of dried pasta obtained by Lloyd and Emma, as shown in Table 6.3 and the energy content indicated in Table 6.1.

[1]

(iii) Evaluate the arrangement of the apparatus shown in Image 6.2 by identifying one source of error.

[1]

11a
2 marks

(i) State the products of protein digestion.

.......................................................................................................

[1]

(ii) State the part of the digestive system that absorbs digested food molecules.

.......................................................................................................

[1]

11b
7 marks

Protein digestion starts in the stomach.

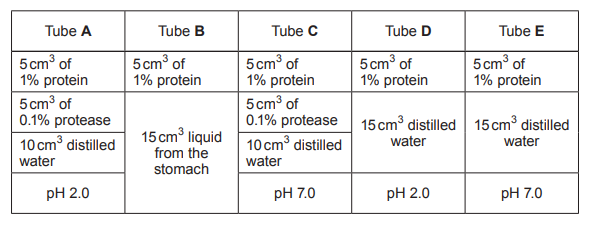
Students investigated protein digestion. They set up five tubes A to E, as shown below.

[Figure: Five test tubes (A-E) each containing 5 cm3 of 1% protein solution. Tube A: plus 5 cm3 of 0.1% protease, pH 2.0. Tube B: plus 15 cm3 of liquid from the stomach. Tube C: plus 5 cm3 of 0.1% protease and 10 cm3 distilled water, pH 7.0. Tube D: plus 15 cm3 distilled water, pH 2.0. Tube E: plus 10 cm3 distilled water, pH 7.0]
Table showing five test tubes with different mixtures of protein, protease, stomach liquid or water, and pH values 2.0 or 7.0 for enzyme investigation

The students measured the percentage protein digested at one hour. The results are shown in the table.

Tube

Percentage protein digested

A

100

B

98

C

5

D

0

E

0

(i) Compare the results for tubes A and D. State the conclusion that can be made about the digestion of protein.

[1]

(ii) State the conclusions that can be made about the contents of the liquid from the stomach in Tube B.

[2]

(iii) All the 1% protein added to Tube A had been fully digested after one hour.

State why the contents of Tube A would still test positive for protein.

[1]

(iv) The students carried out a similar investigation, but instead of using 0.1% protease, they used 5 cm3 of 0.1% lipase in both tubes A and C.

They found there had been no digestion of protein in either tube.

Use your knowledge of enzyme structure and function to explain the results that the students obtained.

[2]

(v) State one further variable that should be controlled during this investigation.

..............................................................................................................

[1]

12
5 marks

Carwyn and Anwen are year 10 students who are concerned that they are overweight. They think that their health may be affected in later life. They both agree to help each other follow a balanced diet.

They research the topic on the Internet and find the following information:

As part of a healthy balanced diet, it is recommended that people of their age should be eating the following every day:

Energy

8 400 kJ

Total fat

70 g

Starchy carbohydrate (e.g. bread, pasta, rice)

260 g

Total sugar (from milk, fruit and added sugar)

90 g

Protein

50 g

Salt

6 g

Carwyn does not want more than one third of his recommended energy input per day to come from starchy carbohydrates.

For his evening meal he has decided to have pasta, the only carbohydrate he eats in the day. He wants to know the energy content of 1 g of pasta in order to calculate how much pasta to allow himself in his evening meal.

Carwyn and Anwen used the following simple calorimeter to measure the energy content of a 7 g piece of dried pasta.

[Figure: Diagram of a simple calorimeter — a clamp stand holding a boiling tube containing 20 cm3 of water with a thermometer inserted, positioned above burning pasta held on a mounted needle over a heat-proof mat]

The table shows one set of results they obtained.

Type of food

Mass of food (g)

Initial temp of water (°C)

Final temp of water (°C)

Increase in temp (°C)

Energy released per gram of food (J)

Energy released per gram of food (kJ)

Pasta

7

19

65

46

...........................

...........................

(i) Complete the table above by using the following formula.

Energy released per gram (J)=volume of water (cm3)×temp increase (°C)×4.2mass of pasta sample (g)

[2]

(ii) Calculate the mass of pasta Carwyn can eat in his evening meal to get one third of his daily energy intake.

Mass of pasta = ................................... g

[2]

(iii) Carwyn was surprised to discover that he could have that much pasta for his evening meal. Anwen said 'there's something wrong, that's over ten bags of pasta! We have to evaluate our scientific method to find where the error lies.'

Evaluate the design of the apparatus and identify one source of error.

[1]

13
3 marks

The graph shows the activity of three enzymes, X, Y and Z at different pH values.

[Figure: Line graph showing rate of reaction (a.u.) on the y-axis against pH (0-9) on the x-axis, with three curves labelled X, Y and Z. Enzyme X peaks in the acidic range (around pH 2), enzyme Y peaks around neutral pH, and enzyme Z peaks in the alkaline range]

(i) State the enzyme (X, Y or Z) that is active only in acid conditions.

...................................................

[1]

(ii) Underline the pH range at which both enzymes Y and Z work.

Between pH 4.5 and pH 8.0

Between pH 4.5 and pH 7.5

Between pH 6.0 and pH 7.5

[1]

(iii) Enzyme Z is found in saliva.

State a structure in the body that produces saliva.

.........................................................................

[1]

14
6 marks

Describe the functions of bile and lipase in the breakdown of fats.

15a
1 mark

The Body Mass Index (BMI) is one way of measuring whether a person is a healthy mass for their height. The result gives an indication of whether the person is a healthy mass, and if not, how overweight or underweight they are.

The BMI is calculated from the mass and height of a person. It is calculated using the following equation:

BMI=body massheight2

where body mass is measured in kilograms and height in metres.

The chart shows the BMI categories based on the World Health Organisation data. The dashed lines represent subdivisions within a major category. For example, the underweight category is subdivided into severe, moderate and mild.

[Figure: Chart plotting mass (kg, y-axis 40-160) against height (m, x-axis 1.5-2.0), divided into four BMI categories by curved boundary lines: Underweight (BMI < 18.5), Normal Range (BMI 18.5-25), Overweight (BMI 25-30), and Obese (BMI > 30). Each category is further subdivided by dashed lines. Source: Calculator.net]

From the chart, state how many subdivisions there are within the obese category.

number of subdivisions in the obese category = ...................

15b
3 marks

The table below shows some biometric data for three teachers at a school.

Teacher

Mass (kg)

Height (m)

BMI

BMI category

Iorwerth

82.4

1.56

33.9

obese

Sharon

55.1

1.71

18.8

.........................................

Peter

95.3

1.84

..........................

.........................................

(i) Calculate the BMI for Peter and write the answer in the table.

[2]

(ii) Use the chart opposite to allocate a major BMI category to Sharon and Peter and write the answer in the table above.

[1]

15c
2 marks

Iorwerth wants to reduce his BMI. State two ways in which he could alter his diet in order to achieve this.

I. ........................................................................................................................

II. .......................................................................................................................

16
2 marks

Explain why lack of exercise can result in obesity.

17
1 mark

The diagram shows the human digestive system.

[Figure: Diagram of the human digestive system with the mouth, liver, small intestine, pancreas, large intestine, rectum, and anus labelled]

State which of the labelled parts in the above diagram absorbs digested food molecules.

......................................................................................................................