DNA & Inheritance (WJEC GCSE Science (Double Award): Biology): Exam Questions

Exam code: 3430

2 hours14 questions
1a
2 marks

Image 5.1 shows part of a DNA molecule. There are four different bases in a DNA molecule, A, T, C and G.

Complete Image 5.1 by adding letters to make three correct base pairs.

Image 5.1
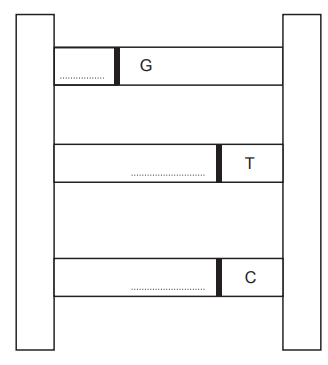
Diagram of a DNA ladder with three base pairs; right bases labelled G, T and C, and blank boxes on the left for their complementary bases.
1b
1 mark

State the scientific term used to describe the shape of a DNA molecule.

..........

1c
3 marks

Forensic scientists can use DNA profiling to identify criminals. They compared DNA left at a crime scene to the DNA of three suspects A, B and C. This is shown in Image 5.2.

Image 5.2.
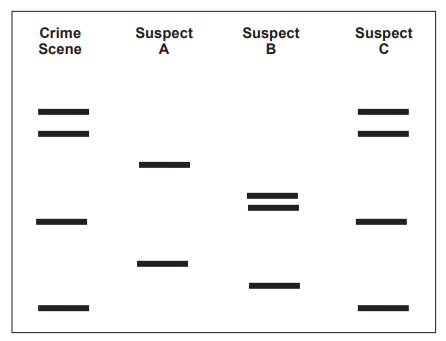
Diagram of DNA band patterns for crime scene and three suspects, showing horizontal bars in columns to compare and identify a matching suspect pattern

(i) Use the DNA profile shown in Image 5.2 to state which of the suspects A, B or C is most likely to have committed the crime. Explain your answer.

[2]

Suspect ..........

Explanation ..........

(ii) State one other use of DNA profiling.

[1]

..........

2
6 marks

Describe the structure of DNA.

State the names of the bases and describe the complementary arrangement of these bases.

Explain the purpose of the triplet code formed by these bases.

(Diagrams will not gain credit)

3a
1 mark

Chromosomes contain DNA. Image 3.2 shows a small section of a DNA molecule.

Image 3.2

![[Figure: Image 3.2 — a section of a DNA molecule showing the twisted double-strand structure with paired bases connecting the two strands]](https://cdn.savemyexams.com/uploads/2026/08/58176-3-2.png){width=239 height=298}

State the name used to describe the shape of the DNA molecule.

3b
1 mark

DNA contains bases that are in pairs. In the pairs of letters below, one correct pair has been underlined for you. Underline the other correct pair.

A – T

G – T

G – C

C – A

3c
1 mark

Complete the sentence below by underlining the correct answer.

The order of the bases in DNA codes for the order of amino acids in (starch / fat / protein).

4a
1 mark

State the meaning of the term phenotype.

4b
4 marks

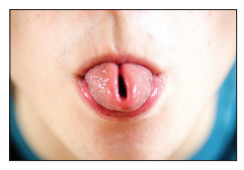
The ability to roll the tongue into a U-shape is controlled by a dominant allele (T). The recessive allele is represented by t.

Close-up of a person’s mouth showing the tongue curled into a tube shape with a central slit, against a blurred background

A man heterozygous for tongue rolling has a child with a woman who is recessive for the characteristic.

(i) Use the letters given above to give the genotype of:

[1]

the man ..........

the woman ..........

(ii) Complete the Punnett square below to show the possible genotypes of their children.

[2]

(iii) Complete the following to show the ratio of the genotypes of the children.

[1]

Homozygous dominant : Heterozygous : Homozygous recessive

.............................. : .............................. : ..............................

4c
1 mark

In 1952 Professor Philip Matlock investigated tongue rolling in 33 pairs of genetically identical twins. Professor Matlock published the data shown in Table 8.1.

Table 8.1

Feature

Number of pairs of identical twins

both can roll their tongues

18

neither can roll their tongues

8

one twin can roll their tongue but the other cannot.

7

Total

33

[Source: Philip Matlock, Ohio State University]

State the evidence from Table 8.1 which suggests that tongue rolling is not controlled entirely by a gene.

5
5 marks

The North American black bear (Ursus americanus) is widespread through the USA and Canada. In British Columbia a form of the North American black bear is found which is white or cream in colour. This form of the North American black bear is known as the Kermode or spirit bear. This is shown in Image 4.1. [This is not the same species as the polar bear (Ursus maritimus).]

Image 4.1

[Figure: photograph of a Kermode or spirit bear, which has white or cream coloured fur]

Kermode or spirit bear

The white or cream colour of the Kermode bear is due to a recessive allele.

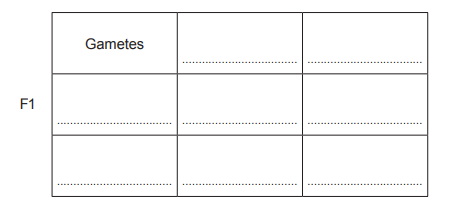
(i) Two heterozygous North American black bears were mated. Using the letters B and b, complete the Punnett square below to show this cross.

[2]

Blank 3×3 genetics grid labelled “Gametes” across the top row and “F1” down the left side, with dotted lines in each empty cell for student entries

(ii) In the Punnett square draw a circle around the genotype of a Kermode bear offspring.

[1]

(iii) North American black bears reproduce every two years and produce 2–3 offspring at a time. Explain why, if they only produce 2–3 offspring at a time, the Punnett square contains boxes for four offspring.

[2]

6a
2 marks

Choose words from the list below to complete the following sentences.

ATP

cytoplasm

DNA

nucleus

protein

vacuole

(i) Chromosomes are found in a cell structure called the ............................................... .

[1]

(ii) Genes are sections of a long molecule with a double helix shape called ............................................... .

[1]

6b
3 marks

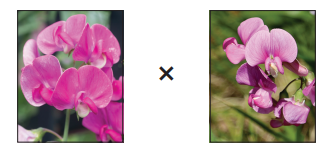
A grower crosses two plants, each with pink flowers.

Two photographs of pink sweet pea flowers side by side with a multiplication symbol between them, indicating a plant cross or breeding experiment

The number of offspring plants is shown in Table 4.1. Some of the offspring had white flowers.

Table 4.1

Flower colour

Number of offspring

pink

21

white

7

(i) Calculate the ratio of pink flowers to white flowers.

[1]

ratio of pink flowers to white flowers = .................... : ....................

(ii) Complete the two sentences below by underlining the correct term for each.

I. The results of the cross show that the genotype of the parents is:

[1]

homozygous dominant / homozygous recessive / heterozygous

II. The genotype of the offspring with white flowers is:

[1]

homozygous dominant / homozygous recessive / heterozygous

6c
3 marks

(i) In humans, the X and Y chromosomes are known as the sex chromosomes.

Complete Table 4.2 by placing one tick (√) in each row to show the sex chromosome that may be present in the gametes.

[2]

Table 4.2

Sex

Sex chromosome that may be present in the gametes

X only

Y only

X or Y

female

male

(ii) Jon and Catrin have two daughters. Catrin is expecting their third child.

State the probability that this child will be a boy.

[1]

Probability = ..............................

7a
2 marks

The bacterium, Bacillus thuringiensis, commonly known as Bt, occurs naturally in the soil. Some strains of Bt produce poisonous proteins that kill certain insects.

Strains of Bt are effective against the caterpillars of European corn borer moths. Bt is not harmful to humans, other mammals, birds, fish, or beneficial insects. Image 6.1 shows a European corn borer.

Image 6.1

[Figure: photograph of a European corn borer moth]

In an attempt to control European corn borer damage in sweetcorn (Zea mays) scientists cut out the gene from the DNA of Bt which codes for the poisonous protein. This gene was then inserted into the DNA of a sweetcorn seed. The seed then grew into an adult plant. When this plant reproduced, all of its offspring contained the Bt gene. Sweetcorn that has been genetically modified by scientists to contain the Bt gene is known as Bt corn.

Explain why, when the sweetcorn seed germinated and grew into the adult plant, every cell would contain the Bt gene.

7b
1 mark

State why the Bt gene is described as a selective agent against the European corn borer.

7c
3 marks

An alternative to using Bt corn, is to use chemical sprays called insecticides which kill insect pests. Graph 6.2 shows the percentage area of US cornfields where Bt corn is grown. It also shows insecticide use in kg/ha.

Graph 6.2

[Figure: dual-axis line graph, x-axis years 1996 to 2013, left y-axis "Percentage of area of US cornfields where Bt corn is grown" 0-100%, right y-axis "Insecticide use (kg/ha)" 0-0.3; shows percentage of Bt corn area rising steadily from 1996 to 2013 while insecticide use falls from around 0.25 kg/ha in 1996 to a low value by around 2010, then rises again after 2010]

(i) Use Graph 6.2 to explain the trend in the use of insecticide.

[2]

(ii) Since 2010 there has been an increased use of insecticide sprays in Bt cornfields in the US. Suggest a reason for this.

[1]

7d
2 marks

Image 6.3 illustrates one of the potential disadvantages of GM technology.

Image 6.3

[Figure: diagram showing wild corn (not containing the Bt gene) growing near corn containing the Bt gene; wild corn reproduces with Bt corn, producing offspring wild corn that also contains the Bt gene]

Use Image 6.3 to identify the potential danger of GM technology.

8a
1 mark

In the human genome, 99.9% of DNA is common in all individuals. The remaining 0.1% of the genome consists of DNA that is unique to individuals. During genetic profiling it is this unique 0.1% of the DNA that is separated and examined.

Image 3.1

![Figure: illustration representing human DNA/genetic profiling]

Many online companies have websites that allow people to trace their ancestors and to build family trees. As part of this process they sell home DNA testing kits. Each kit contains a swab to remove cells from the inside of the user's cheek. The swab is placed in a container and sent to a laboratory where the DNA is extracted from the swab and processed for genetic profiling.

Image 3.2

[Figure: photograph of a person using a swab to remove cheek cells from another person's mouth, wearing gloves]

In Image 3.2, a swab is being used to remove cheek cells. The process is being carried out by another person and not by the person whose cheek cells are being collected. State why it is important for genetic profiling that the person using the swab is wearing gloves.

8b
1 mark

State what has to happen to DNA before it can be separated into bands during genetic profiling.

8c
3 marks

Genetic profiles can be used in cases of disputed paternity. The genetic profile of both the mother and the child must be known. Any DNA band found in the genetic profile of the child that is not found in the genetic profile of the mother must be present in the genetic profile of the father for paternity to be confirmed.

Image 3.3 shows 5 genetic profiles, those of the mother and child, together with the profiles of three males who are disputing paternity of the child.

Image 3.3

![Figure: DNA gel electrophoresis genetic profile diagram showing 5 lanes labelled Mother, Child, Male 1, Male 2, Male 3, each with a pattern of horizontal DNA bands]

(i) Using Image 3.3, state which male is the father of the child.

[1]

..................................................

(ii) Support your answer by circling three DNA bands, on the profile of the father in Image 3.3, that proves your answer.

[2]

8d
2 marks

Apart from disputed paternity and tracing ancestors, give two other uses of genetic profiling.

9a
3 marks

The family tree shows the inheritance of cystic fibrosis. Cystic fibrosis is caused by a recessive allele.

[Figure: A family tree spanning four generations, showing males and females, some affected by cystic fibrosis (shown with a different symbol/shading), with person 1 and person 2 identified in the diagram]

(i) Complete the Punnett square below to show the possible genotypes of the future children of person 1 and person 2. Use the letters N to represent the dominant allele and n to represent the allele that causes cystic fibrosis.

[2]

(ii) Use the Punnett square to predict the probability of person 1 and person 2 having another child who has cystic fibrosis.

[1]

9b
3 marks

One treatment for cystic fibrosis is to introduce dominant alleles (N) into the cells lining the lungs.

(i) State the name of this type of treatment.

...................................................................................................

[1]

(ii) State the method that is used to deliver the dominant alleles to the lungs.

...................................................................................................

[1]

(iii) State one problem with the use of this method.

[1]

10a
2 marks

State what is meant by the following terms:

(i) gene;

[1]

(ii) allele.

[1]

10b
5 marks

Cystic fibrosis is an inherited condition. The allele that causes this condition is recessive. The family tree below shows how cystic fibrosis is passed on in families.

[Figure: Family tree diagram showing nine individuals (numbered 1–9) across generations, using a key of unaffected female, unaffected male, affected male, and affected female symbols, showing how cystic fibrosis is inherited]

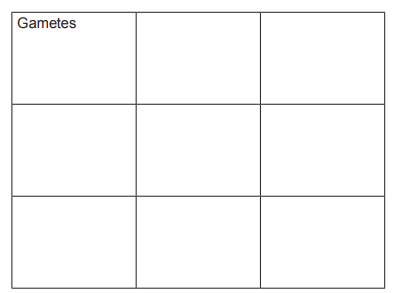
(i) Use letters N and n to complete the Punnett square to show how parents 1 and 2 could produce offspring number 4.

Blank 3 by 3 biology table with the word “Gametes” in the top left cell, intended for filling in information about reproductive cells

[2]

(ii) State the genotype of individual 9. Explain your answer.

[2]

(iii) State the possible genotypes of individual 5.

[1]

10c
1 mark

Our understanding of how characteristics are inherited comes from the principles proposed by Gregor Mendel in the 19th century. In his experiments on pea plants (Pisum sativum) Mendel studied characteristics controlled by a single gene. State why this is not representative of most phenotypes.

11a
5 marks

A group of year 11 students extracted DNA from bananas in the school laboratory. The result of this extraction process is shown in Image 4.1.

Image 4.1

[Figure: Image 4.1 — a measuring cylinder (5–25 cm3) showing a clear layer of alcohol containing fluffy white strands of DNA above a lower layer of banana juice, water, salt and washing-up liquid]

The students collected the DNA from the measuring cylinder and took it to the local university where members of the biology staff had agreed to supervise the students whilst they analysed its base content. The readings they obtained are shown in Image 4.2.

Image 4.2

DNA base analysis. Source – banana

Adenine

33%

Cytosine

17%

Guanine

17%

Thymine

33%

State the ratio of:

(i)

I. adenine to thymine

.................... : ....................

II. guanine to cytosine.

.................... : ....................

[1]

(ii) Explain these ratios by referring to the arrangement of these bases in a molecule of DNA.

[2]

(iii) If the students had repeated the experiment with strawberries would the base analysis be the same as that of bananas? Explain your answer.

[2]

11b
2 marks

Explain the role of the bases in protein synthesis.

12a
2 marks

Complete the following sentences about genes.

(i) Genes are found in the nucleus of a cell on paired structures called ............................................................................... .

[1]

(ii) Genes are sections of a long molecule called ............................................................................... .

[1]

12b
5 marks

Alan crossed two pea plants (Pisum sativum).

  • Parent 1 had purple flowers.

  • Parent 2 had white flowers.

  • All the offspring had purple flowers, as shown below.

[Figure: Diagram showing parent 1 (purple flower) crossed with parent 2 (white flower), producing offspring that all have purple flowers]

Flower colour in pea plants is controlled by one gene. The gene has two alleles, D and d.

(i) Underline the correct answer to complete the following sentences.

I. The genotype of parent 1 is DD / Dd / dd

[1]

II. The genotype of parent 2 is DD / Dd / dd

[1]

(ii) State the phenotype of the offspring.

..........................................................................

[1]

(iii) The offspring are heterozygous.

State the meaning of the term heterozygous.

[2]

13a
3 marks

DNA is made of two long chains of alternating molecules of sugar and phosphate connected by bases. The chains are twisted to form a double helix as shown in the diagram.

[Figure: Diagram of the DNA double helix structure, showing two strands of alternating sugar and phosphate molecules connected by paired bases, twisted into a double helix]

A sample of DNA was analysed and found to contain 27% thymine.

(i) Name the complementary base to thymine.

..............................................................

[1]

(ii) Calculate the percentage of cytosine that would be present in this sample.

Cytosine = ................... %

[2]

13b
6 marks

(i) Explain how the sequence of bases on DNA determines the structure of a protein.

[3]

The sequence of bases on a small section of DNA is shown below.

TGA CTG GTC AAC

This section of DNA can undergo two different mutations.

Mutation 1: TGA CAG CTC AAC

Mutation 2: TGA CTG GTC ATC

(ii) Using the information and your own knowledge, conclude why mutation 1 may affect an organism more than mutation 2.

[3]

14a
3 marks

The students were asked to cross a red-eyed fly and a white-eyed fly. One of each of these flies was placed in a specimen tube with some nutrients. The diagram below shows the phenotype of both the flies in this cross and some of the offspring.

[Figure: Diagram showing a cross between a red-eyed fly and a white-eyed fly (labelled X), with the resulting F1 offspring shown; a note states all F1 offspring have red eyes]

(i) Label one of the male flies in the diagram above.

[1]

(ii) Show this cross in the Punnett square below. Use the letters R to represent the allele for red eye colour and the letter r to represent the alleles for white eye colour.

[Figure: Blank Punnett square grid with rows/columns labelled 'Gametes' for completion, and an 'F1' row for offspring genotypes]

[2]

14b
5 marks

The students then decided to self the F1 generation. There were 8 groups of students. When they examined the F2 generation they obtained the following results.

Group number

Number of offspring in F2 generation

Number of flies with red eyes

Number of flies with white eyes

Approximate ratio of red-eyed to white-eyed flies

1

214

156

58

.......................

2

139

108

31

.......................

3

0

0

0

No ratio

4

276

206

70

.......................

5

319

244

75

.......................

6

39

28

11

.......................

7

217

55

162

1 : 3

8

312

235

77

.......................

(i) Complete the table by writing in the approximate ratio of red to white eyed flies for all the remaining groups. Use whole numbers only.

[1]

(ii) The students in group number 3 followed the method correctly. Suggest a reason for their result.

[1]

(iii) Suggest an explanation for the anomalous result obtained by group number 7.

[1]

(iv) Complete the Punnett square below to show the expected result when the F1 were selfed.

[Figure: Blank Punnett square grid with rows/columns labelled 'Gametes' for completion, and an 'F2' row for offspring genotypes]

[2]