1a2 marks
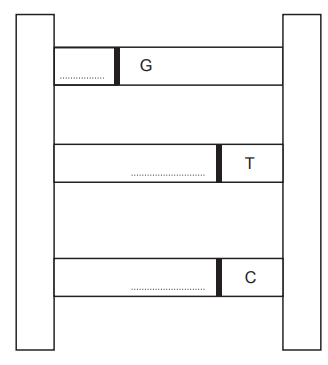
Image 5.1 shows part of a DNA molecule. There are four different bases in a DNA molecule, A, T, C and G.
Complete Image 5.1 by adding letters to make three correct base pairs.
Image 5.1
1b1 mark
State the scientific term used to describe the shape of a DNA molecule.
..........
1c3 marks
Forensic scientists can use DNA profiling to identify criminals. They compared DNA left at a crime scene to the DNA of three suspects A, B and C. This is shown in Image 5.2.
Image 5.2.
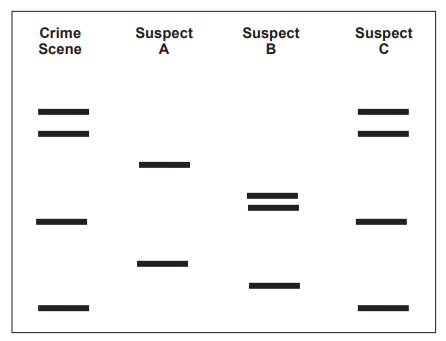
(i) Use the DNA profile shown in Image 5.2 to state which of the suspects A, B or C is most likely to have committed the crime. Explain your answer.
[2]
Suspect ..........
Explanation ..........
(ii) State one other use of DNA profiling.
[1]
..........
Was this exam question helpful?
![![[Figure: Image 3.2 — a section of a DNA molecule showing the twisted double-strand structure with paired bases connecting the two strands]](https://cdn.savemyexams.com/uploads/2026/08/58176-3-2.png){width=239 height=298}](https://cdn.savemyexams.com/cdn-cgi/image/f=auto,width=3840/https://cdn.savemyexams.com/uploads/2026/08/40783-3-2.png)
![[Figure: photograph of a Kermode or spirit bear, which has white or cream coloured fur]](https://cdn.savemyexams.com/cdn-cgi/image/f=auto,width=3840/https://cdn.savemyexams.com/uploads/2026/08/43252-4-1.png)
![[Figure: photograph of a European corn borer moth]](https://cdn.savemyexams.com/cdn-cgi/image/f=auto,width=3840/https://cdn.savemyexams.com/uploads/2026/08/65040-6-1.png)
![[Figure: dual-axis line graph, x-axis years 1996 to 2013, left y-axis "Percentage of area of US cornfields where Bt corn is grown" 0-100%, right y-axis "Insecticide use (kg/ha)" 0-0.3; shows percentage of Bt corn area rising steadily from 1996 to 2013 while insecticide use falls from around 0.25 kg/ha in 1996 to a low value by around 2010, then rises again after 2010]](https://cdn.savemyexams.com/cdn-cgi/image/f=auto,width=3840/https://cdn.savemyexams.com/uploads/2026/08/56594-6-2.png)
![[Figure: diagram showing wild corn (not containing the Bt gene) growing near corn containing the Bt gene; wild corn reproduces with Bt corn, producing offspring wild corn that also contains the Bt gene]](https://cdn.savemyexams.com/cdn-cgi/image/f=auto,width=3840/https://cdn.savemyexams.com/uploads/2026/08/10113-6-3.png)
![![Figure: illustration representing human DNA/genetic profiling]](https://cdn.savemyexams.com/cdn-cgi/image/f=auto,width=3840/https://cdn.savemyexams.com/uploads/2026/08/51968-3-1.png)
![[Figure: photograph of a person using a swab to remove cheek cells from another person's mouth, wearing gloves]](https://cdn.savemyexams.com/cdn-cgi/image/f=auto,width=3840/https://cdn.savemyexams.com/uploads/2026/08/40386-3-2.png)
![![Figure: DNA gel electrophoresis genetic profile diagram showing 5 lanes labelled Mother, Child, Male 1, Male 2, Male 3, each with a pattern of horizontal DNA bands]](https://cdn.savemyexams.com/cdn-cgi/image/f=auto,width=3840/https://cdn.savemyexams.com/uploads/2026/08/39564-3-3.png)
![[Figure: A family tree spanning four generations, showing males and females, some affected by cystic fibrosis (shown with a different symbol/shading), with person 1 and person 2 identified in the diagram]](https://cdn.savemyexams.com/cdn-cgi/image/f=auto,width=3840/https://cdn.savemyexams.com/uploads/2026/08/3914-9c.png)
![[Figure: Family tree diagram showing nine individuals (numbered 1–9) across generations, using a key of unaffected female, unaffected male, affected male, and affected female symbols, showing how cystic fibrosis is inherited]](https://cdn.savemyexams.com/cdn-cgi/image/f=auto,width=3840/https://cdn.savemyexams.com/uploads/2026/08/6159-6b.png)
![[Figure: Image 4.1 — a measuring cylinder (5–25 cm3) showing a clear layer of alcohol containing fluffy white strands of DNA above a lower layer of banana juice, water, salt and washing-up liquid]](https://cdn.savemyexams.com/cdn-cgi/image/f=auto,width=3840/https://cdn.savemyexams.com/uploads/2026/08/1881-4-1.png)
![[Figure: Diagram showing parent 1 (purple flower) crossed with parent 2 (white flower), producing offspring that all have purple flowers]](https://cdn.savemyexams.com/cdn-cgi/image/f=auto,width=3840/https://cdn.savemyexams.com/uploads/2026/08/42244-4b.png)
![[Figure: Diagram of the DNA double helix structure, showing two strands of alternating sugar and phosphate molecules connected by paired bases, twisted into a double helix]](https://cdn.savemyexams.com/cdn-cgi/image/f=auto,width=3840/https://cdn.savemyexams.com/uploads/2026/08/49779-8a.png)
![[Figure: Diagram showing a cross between a red-eyed fly and a white-eyed fly (labelled X), with the resulting F1 offspring shown; a note states all F1 offspring have red eyes]](https://cdn.savemyexams.com/cdn-cgi/image/f=auto,width=3840/https://cdn.savemyexams.com/uploads/2026/09/47644-3b.png)
![[Figure: Blank Punnett square grid with rows/columns labelled 'Gametes' for completion, and an 'F1' row for offspring genotypes]](https://cdn.savemyexams.com/cdn-cgi/image/f=auto,width=3840/https://cdn.savemyexams.com/uploads/2026/09/59958-3b1.png)
![[Figure: Blank Punnett square grid with rows/columns labelled 'Gametes' for completion, and an 'F2' row for offspring genotypes]](https://cdn.savemyexams.com/cdn-cgi/image/f=auto,width=3840/https://cdn.savemyexams.com/uploads/2026/09/55746-3b2.png)