Classification & Biodiversity (WJEC GCSE Science (Double Award): Biology): Exam Questions

Exam code: 3430

2 hours21 questions
1a
2 marks

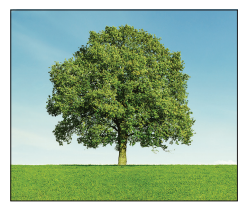
Image 1 shows an oak tree. Its scientific name is Quercus robur.

Image 1

Lone green tree with a full leafy crown standing in a bright grassy field under a clear blue sky.

(a) Complete the following sentences using only words from the box.

animal

plant

Quercus

fungus

robur

The oak tree belongs to the .......... kingdom.

The genus of the oak tree is .......... .

1b
1 mark

Underline the two correct statements about naming organisms.

Scientific names are the same all over the world.

Scientific names are different all over the world.

Common names are the same all over the world.

Common names are different all over the world.

2a
2 marks

Biological control agents can be effective in controlling some crop pests.

Underline the two statements in the list below which correctly relate to biological control agents.

They can reduce the need for chemical pesticides.

They cause damage to crop plants.

Pests develop resistance to biological control agents.

They are specific to certain pests.

They cannot be used on human food plants where chemical pesticides are banned.

2b
3 marks

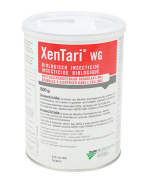
XenTari® WG is a biological control agent which contains inactive forms of the bacterium Bacillus thuringiensis.

White plastic container of XenTari WG biological insecticide with red label, showing product information and instructions in multiple languages

When water is added to the XenTari® WG the bacteria are activated. The bacteria are then sprayed onto food crops such as cucumbers, sweet peppers and tomatoes that are being attacked by certain insect pests.

(i) Explain what effect the spraying of the bacteria on a crop of tomatoes would have on the crop yield.

[2]

(ii) XenTari® WG is not yet approved for use in the UK. Explain why it is important that scientists field-test XenTari® WG before it is approved for use by the UK government.

[1]

3
6 marks

Species A and B shown in Image 6.1 are common moorland plants.

Image 6.1

[Figure: photographs of two moorland plant species, labelled Species A and Species B]

Image 6.2 shows moorland in Wales.

Image 6.2

[Figure: photograph of moorland in Wales, showing points X and Y marked 50 m apart across the terrain]

Plant distribution can be studied using the following equipment:

  • 50 m tape measure

  • a 1 m2 quadrat

  • notebook

  • pencil

  • ruler

  • graph paper.

Using all the above equipment, describe how you would:

  • investigate the distribution of species A and B between points X and Y in Image 6.2, which are 50 m apart

  • display your results.

[6 QER]

4a
3 marks

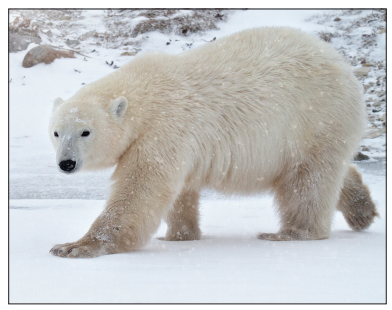
Organisms have adaptations to help them survive in their habitats. Image 2 shows a polar bear (Ursus maritimus) walking on deep snow.

Image 2

Polar bear walking across snowy ground in an Arctic landscape, its thick white fur dusted with falling snowflakes

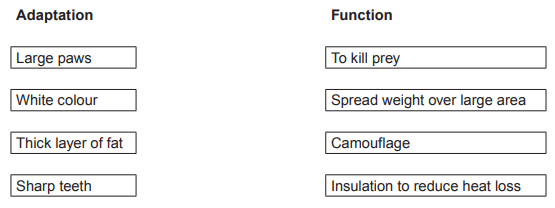
Use a ruler to draw lines to join the adaptations with their function.

Worksheet showing two columns, Adaptation and Function, listing large paws, white colour, thick fat and sharp teeth with matching prey, weight, camouflage, insulation.
4b
1 mark

The polar bear is a vertebrate.

State what is meant by the term vertebrate.

5
2 marks

Modern classification of the giraffe identifies four different species. Their common and scientific names are shown in Table 6.5.

Table 6.5

Common name

Scientific name

Southern or Angolan or South African giraffe

Giraffa giraffa

Masai or Rhodesian or Thornicroft's giraffe

Giraffa tippelskirchi

Reticulated giraffe

Giraffa reticulata

Northern or Kordofan or Nubian or West African or Rothschild's giraffe

Giraffa camelopardalis

The common names shown in Table 6.5 are anglicised (English) names. The local African peoples also have their own common names, in their own languages, for the giraffe.

(i) Explain the importance of the use of scientific names as opposed to common names.

[1]

(ii) Suggest how the modern classification of the giraffe affects the validity of Graph 6.2. Give a reason for your answer.

[1]

6a
1 mark

Explain why scientists use the scientific names Ursus americanus and Ursus maritimus when describing bears rather than the common names North American black bear and polar bear respectively.

6b
2 marks

Adult male polar bears have a mass of up to 450 kg. The male North American black bear is much smaller with a maximum mass of 158 kg. The shaded areas on the maps in Image 4.2 show the range of these two bears in North America.

Image 4.2

[Figure: two maps of North America; one shaded map shows the polar bear range around the Arctic Circle with a mean annual temperature of −8°C, the other shows the North American black bear range further south with a mean annual temperature of 12°C]

Use the maps in Image 4.2, and your own knowledge, to suggest a reason why the mass of an adult male polar bear is nearly three times as great as that of an adult male North American black bear.

7a
3 marks

Image 1.1 shows three insects:

Image 1.1

[Figure: composite image showing three insects - Alderfly (Sialis lutaria, magnification ×2), Dragonfly (Aeshna cyanea, magnification ×1), and Stonefly (Diura bicaudata, magnification ×0.5) - with points X and Y marking a line across the stonefly image]

(i) Measure the line X – Y in centimetres.

[1]

Length of the line X – Y = ............................. cm

(ii) Multiply your answer to (i) by 2 to give the actual length of the stonefly.

[1]

Actual length = ............................. cm

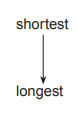
(iii) Complete the list below to show the insects in order of their actual length.

[1]

Text diagram with the word “shortest” above an arrow pointing down to the word “longest”, showing progression from shortest to longest.

Alderfly

...........................................................

...........................................................

7b
3 marks

Complete Table 1.2 by writing true or false against each statement about the three insects.

[3]

Table 1.2

The three insects shown:

True or false

belong to the five kingdom system of classification

true

are animals

.....................................................

have backbones

.....................................................

are invertebrates

.....................................................

are in the same genus

.....................................................

each have a separate species name

.....................................................

8a
1 mark

State the meaning of the term biological control.

8b
4 marks

Many species of moths destroy food crops. The global effect of these pest species results in the loss of many billions of dollars per year. The stage in the life cycle of moths that causes the damage is the caterpillar, which eats the plant crop.

The simplified life cycle of most moths is shown in Image 8.1:

Image 8.1

[Figure: diagram of the simplified life cycle of a moth, showing four stages in sequence: Eggs, Caterpillar, Pupa, Moth]

Table 8.2 shows five species of small wasps (Trichogramma) used as biological control agents. It also shows the stage in the moth life cycle they attack and the area of farmland in different countries where these biological control agents are already used successfully.

Table 8.2

Species of wasp

Stage of moth life cycle attacked by wasp

Food crops damaged by moth caterpillars

Region where wasp is used

Area of farmland where the wasp is used successfully (million hectares)

Trichogramma pretiosum

eggs

potatoes

China

2.0

Trichogramma platneri

caterpillars

corn, sugar cane

Mexico

1.5

Trichogramma acacioi

caterpillars

avocado and other fruit crops

Brazil

1.0

Trichogramma japonicum

caterpillars

rice, potatoes

South East Asia

0.3

Trichogramma ostriniae

caterpillars

corn

Europe

0.1

As an advisor for the United Nations you are asked to advise the Government of Peru on the use of a biological control agent to prevent moth damage in potato crops.

(i) Using all the information given, suggest the best species of Trichogramma to use and give the reason for your choice.

[2]

(ii) State one factor that would need to be investigated before Trichogramma is released into the environment in Peru.

[1]

(iii) Suggest why it is not possible to conclude, from the information in the table, that the percentage of crops damaged by moths is less in China than it is in Europe.

[1]

9
6 marks

Longworth traps are used to capture small mammals alive. They are baited with oats and supplied with a source of water. After being examined the mammals are released unharmed. Longworth traps must be checked at least once a day. Image 5.1 shows a field vole and Image 5.2 shows a Longworth trap.

Image 5.1

[Figure: photograph of a field vole]

Describe how you would estimate the population size of the field vole (Microtus agrestis) in a field of grass using the capture-recapture technique and Longworth traps.

You have 10 Longworth traps set at the same coordinates in the field for the whole time of the investigation and a pair of small scissors to clip 1 cm2 of hair from the backs of the voles.

Population size can be estimated using the following equation:

Population size=number in 1st sample×number in 2nd samplenumber in 2nd sample previously marked

(NB quadrats are not required in this investigation.)

10a
5 marks

A pest control officer was asked to eradicate mice from a small food warehouse. By looking at the amount of food damage, she made an initial, on-the-spot, estimate of the number of mice in the warehouse. This initial estimate made by the pest control officer is the total number of mice shown in Image 7.1.

Image 7.1.

[Figure: Image 7.1 — a diagram of a warehouse floor showing the pest control officer's initial on-the-spot estimate of the total number of mice, alongside the mice caught in the first capture (n1 = 7), the mice caught in the second capture (n2 = 7), and the marked mice found within the second capture (n3 = 2)]

In order to get a better estimate of the size of the mouse population in the warehouse the pest control officer used the capture/recapture technique. She set live-capture traps in the warehouse. On the next day the traps were inspected, all the mice caught were counted, marked and released. The mice caught in this first capture are represented by (n1) in Image 7.1.

Two days later the traps were reset. The next day the traps were again inspected. The mice caught in this second capture are represented by (n2). Within the second capture the number of marked mice were counted. These marked, recaptured, mice are represented by (n3) in Image 7.1.

(i) Use the following equation to estimate the population size of the mice in the warehouse. Give your answer to the nearest whole number.

population size=number in 1st capture×number in 2nd capturenumber in 2nd capture previously marked

Population size = ....................................................

[2]

(ii) State how the population size estimated by the capture/recapture technique compares to the pest control officer's initial on-the-spot estimate.

[1]

(iii) State two ways in which the accuracy of the estimated population size obtained by the capture/recapture technique could be improved.

1.

2.

[2]

10b
3 marks

State three assumptions that must be made when using capture/recapture data.

1.

2.

3.

11a
1 mark

The diagram shows a plant called camelthorn (Alhagi sparsifolia).

[Figure: Diagram of a camelthorn plant labelled with stem, small leaves, seed case, flowers, and sharp spine]

State the genus name for camelthorn.

.........................................................................................

11b
2 marks

Camelthorn lives in dry, desert areas, where there are herbivores.

Choose two labelled features shown on the diagram and explain how each is an adaptation for camelthorn to survive in deserts.

  1. ........................................................................................................................

  2. .........................................................................................................................[2]

11c
2 marks

Megan investigated growth in camelthorn plants in two different conditions.

Plant A was given 250 cm3 of water each day. Plant B was watered once only at the start of the investigation. The diagram shows the appearance of the two plants at seven days.

[Figure: Diagram comparing root growth of Plant A and Plant B below the soil surface after seven days. Plant A has wider, more shallow, spread-out roots; Plant B has narrower, deeper, longer roots extending further down]

Compare the root growth in the two plants and suggest how root growth in plant B is an adaptation to dry soil.

12a
1 mark

The brown rat (Rattus norvegicus) spreads disease. Warfarin is a poison used to kill brown rats. Over time, many brown rats have evolved to become resistant to warfarin.

State the genus of the brown rat.

12b
1 mark

The brown rat is a vertebrate. State what is meant by the term vertebrate.

13a
2 marks

The photograph shows Erinaceus europaeus.

[Figure: Photograph of a hedgehog (Erinaceus europaeus)]

Erinaceus europaeus has many common names, such as hedgehog, urchin and furze-pig.

State:

(i) the Kingdom to which the hedgehog belongs;

[1]

(ii) the Genus name for the hedgehog.

[1]

13b
2 marks

Explain why scientists use the scientific name, rather than common names for organisms.

14
4 marks

Cardiff Bay is a 2.0 km2 freshwater lake. The Bay is not tidal but visiting yachts, from all over Europe, can enter the Bay from the sea, through locks. The Bay is fed by two rivers, the Taff and the Ely.

[Figure: Map of Cardiff Bay showing its location, the locks connecting it to the sea, and the rivers Taff and Ely feeding into it]

The following public information notice has been posted in Cardiff Bay.

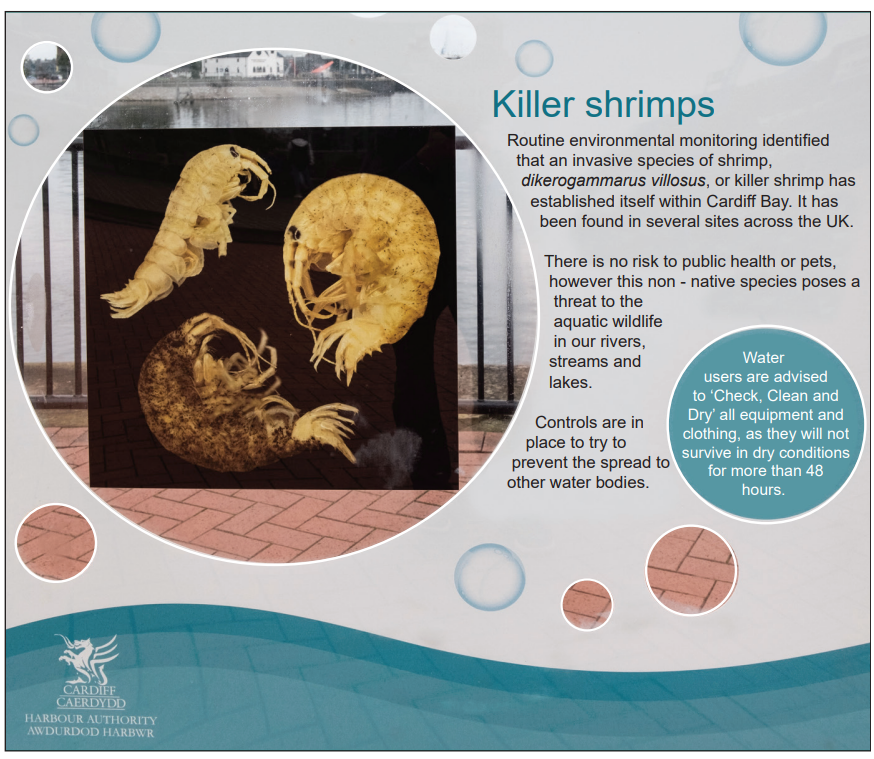
Killer shrimps

Routine environmental monitoring identified that an invasive species of shrimp, dikerogammarus villosus, or killer shrimp has established itself within Cardiff Bay. It has been found in several sites across the UK.

There is no risk to public health or pets, however this non-native species poses a threat to the aquatic wildlife in our rivers, streams and lakes.

Controls are in place to try to prevent the spread to other water bodies.

Water users are advised to 'Check, Clean and Dry' all equipment and clothing, as they will not survive in dry conditions for more than 48 hours.

(i) Invasive species are also known as alien species. Explain what is meant by the term invasive species and why they are a problem.

[2]

(ii) In the public information notice opposite there is an error in the way in which the scientific name of the killer shrimp has been written. Identify the error by writing the scientific name in the correct form.

[1]

(iii) Killer shrimps feed on native freshwater shrimps, aquatic insects and small fish. State how the biodiversity of the UK will be affected by the killer shrimp.

[1]

15a
4 marks

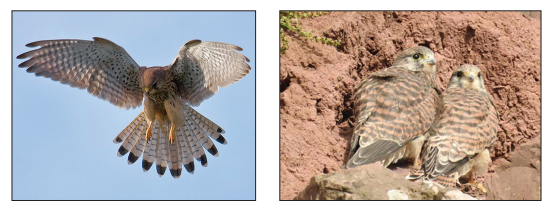
The kestrel (Falco tinnunculus) is a bird of prey found in Pembrokeshire, Wales. The photographs show a kestrel in flight and nesting.

[Figure: Two photographs, one of a kestrel in flight and one of a kestrel nesting

Surveys are carried out by the Welsh Kite Trust to monitor the numbers of kestrels in Pembrokeshire. The data gathered by some of these surveys are shown in Table 6.1.

Table 6.1

Year

Number of breeding pairs

2010

12

2011

19

2012

14

2016

10

(i) Calculate the percentage decrease in breeding pairs between 2011 and 2016.

Use the formula below.

Percentage decrease=number of breeding pairs in 2011−number of breeding pairs in 2016number of breeding pairs in 2011×100

Percentage decrease in breeding pairs = ....................................................

[2]

(ii) Suggest two possible reasons for this decrease.

  1. ..................................................................................

  2. ....................................................................................

[2]

15b
2 marks

Image 6.2 shows a map of the nesting sites of kestrels in Pembrokeshire.

Image 6.2

[Figure: Image 6.2 — a map of Pembrokeshire showing kestrel breeding sites marked mostly along the coastline, from the 2016 Pembrokeshire Kestrel Survey Results]

State one conclusion that can be made about where kestrels generally choose to nest. Suggest a reason for this.

16a
3 marks

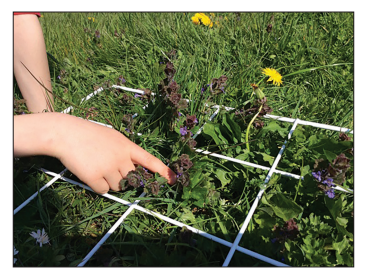
Students used a quadrat to investigate the abundance of dandelions (Taraxacum officinale) on the school rugby pitch.

Child’s hand pointing at wildflowers and grass within a white quadrat frame used for a fieldwork survey outdoors

The method they used was:

  1. Use a 1 m² quadrat.

  2. Use a random number generator to place the quadrat on the rugby pitch.

  3. Count the number of dandelions in the quadrat.

  4. Repeat steps 2 and 3 another 5 times.

  5. Calculate a mean.

  6. Calculate the number of dandelions on the school rugby pitch.

The results they obtained are given in Table 10.1.

Table 10.1

Quadrat

Number of dandelions

1

3

2

5

3

2

4

7

5

15

6

6

Mean

..............

(i) Draw a circle around the anomalous result in Table 10.1.

[1]

(ii) Calculate the mean number of dandelions per quadrat and write your answer in Table 10.1. Do not use the anomalous result in your calculation.

[2]

16b
1 mark

The teacher said that he did not have confidence in the mean. Suggest why.

16c
2 marks

The total area of the school rugby pitch is 7 350 m². Use your answer to part (a)(ii) to calculate the total number of dandelions on the school rugby pitch.

Total number of dandelions on the school rugby pitch = ...........................

16d
1 mark

State the name of the method the students should use to investigate the distribution of the dandelions across the pitch.

17a
1 mark

Cod are important in maintaining biodiversity in the North Sea.

Choose the letter (A – C) from the list which defines biodiversity for an area.

  • The total number of species

  • The variety of species and the number of organisms within those species

  • The variety of species and their feeding relationships

17b
9 marks

Read the following information about cod.

  • Overfishing in the second half of the 20th century had a serious effect on the stocks of adult cod in the North Sea.

  • The total stock of adult cod is estimated annually.

  • The safe stock is the minimum mass of the adult cod population that should be left in the sea each year to ensure that the cod remains at sustainable levels.

  • In 1996, scientists predicted that without action there would be no adult cod in the North Sea by 2015.

  • In 2005, the European Commission put an annual limit (quota) on the mass of cod that could be taken by each vessel fishing in the area.

The graph shows the total annual catch of cod and the stock of adult fish remaining in the North Sea from 1965 to 2015.

[Figure: Line graph titled 'North Sea cod' showing total annual catch and stock of adult fish remaining (in thousands of tonnes) plotted against year, from 1965 to 2015]

(i) The safe stock is 150 000 tonnes.

Use a ruler to draw a straight line on the grid to show the safe stock, from 1965 to 2015.

[1]

(ii) Use the data in the graph to answer the following questions.

I. Calculate the difference in mass between the total catch in 1982 and the safe stock.

Difference in mass = .................................... thousand tonnes

[2]

II. One tonne contains 120 adult cod.

Calculate the number of adult cod in the safe stock.

Number of adult cod in the safe stock = ................................

[2]

(iii) Describe the evidence that:

I. shows overfishing beyond a sustainable level took place between 1971 and 2005;

[2]

II. supports the prediction made by scientists in 1996, that 'without action there would be no adult cod in the North Sea by 2015';

[1]

III. shows the fishing quota of 2005 had an effect on the cod population.

[1]
17c
1 mark

Maintaining biodiversity ensures a continued food supply for humans.

Give one other benefit to humans of maintaining biodiversity.

18a
4 marks

Rhys wanted to investigate the abundance and distribution of four plant species as he moved from the edge of a woodland towards the centre. He laid down a tape measure to form a transect. Using a 0.25 m2 quadrat he sampled every five metres along the transect line, estimating the percentage area cover of each species. The diagram shows the area of woodland that was investigated.

[Figure: Diagram of a woodland transect line running from 0 m at the woodland edge to 20 m towards the centre of the wood]

His results are shown in the table.

Species

Percentage cover at each distance along transect (m)

0

5

10

15

20

Primrose (Primula vulgaris)

40

35

35

25

5

Dog's Mercury (Mercurialis perennis)

50

35

15

10

5

Bluebell (Hyacinthoides non-scripta)

0

5

10

25

80

Wood Anemone (Anemone nemorosa)

5

20

40

35

10

Draw a line graph of the results for both Dog's Mercury and Bluebell on the grid below. Label each line.

[Figure: Blank grid for plotting percentage cover (y-axis) against distance along transect in metres (x-axis, 0–20 m)]
18b
3 marks

(i) State the term used to refer to competition between two different species.

....................................................................................

[1]

(ii) Describe the results for Dog's Mercury and Bluebell. Suggest an explanation for your answer.

[2]

18c
2 marks

(i) Jim suggested to Rhys that he should have carried out random sampling. State why it would be unsuitable to use a random sampling method in this investigation.

[1]

(ii) Suggest one improvement Rhys could make to his method.

[1]

18d
2 marks

Biodiversity is a measure of the variety of different species and the number of individuals within those species in an area. State two reasons why it is important that biodiversity is maintained.

19
8 marks

Ceri used a data logger to measure light intensity at six sites (A – F) along a 120 m transect through a wood, as shown below.

[Figure: Diagram of a 120 m transect line through a wood with six sampling sites (A-F) marked between 0 m and 120 m]

The results below are shown on her computer screen.

[Figure: Line graph showing light intensity (a.u., y-axis 0-4) plotted against distance along transect (m, x-axis 0-120), with sites A-F marked along the line. Light intensity starts high at site A, decreases through the middle sites, then increases again towards site F]

(i) Describe how light intensity changes along the transect.

[2]

(ii) Ceri thought that light intensity affected the number of plant species growing under the trees along the transect.

She counted the number of plant species present at each site. The results are shown in the table.

Site

A

B

C

D

E

F

number of plant species in 1 m2

9

8

2

1

3

11

Complete a bar chart on the grid below by:

I. labelling the vertical axis;

II. using a ruler to draw bars for the number of plant species at each site.

[Figure: Blank bar chart grid with y-axis scaled 0-12 (unlabelled) and x-axis showing sites A, B, C, D, E, F]

[3]

(iii) State Ceri's hypothesis.

[1]

(iv) Do the results of the investigation support her hypothesis? Give a reason for your answer.

[1]

(v) Apart from light intensity, suggest one other environmental factor that might affect the number of plant species growing under the trees.

20
6 marks

The table shows the number of two species of bacteria (A and B) in samples of seawater taken near a beach.

Date of sample

Number of bacteria (thousands per cm3)

Total number of species A and B (thousands per cm3)

Species A

Species B

March 15th

100

50

150

April 15th

200

60

260

May 15th

300

70

370

June 15th

500

70

570

July 15th

1000

80

1080

August 15th

800

110

910

September 15th

300

350

650

(i) The graph below shows how the total number of species A and B changed between March 15th and September 15th.

[Figure: Line graph plotting total number of species A and B (thousands per cm3, y-axis 0-1100) against sample date (x-axis, March 15th to September 15th), with a horizontal reference line marked 'unsafe to enter sea']

I. Between which two sampling dates was the increase in the total number of species A and B the fastest?

Between ……….................……… and ……….................………

[1]

II. If the total number of species A and B in the sample is likely to be greater than 700 000 per cm3 in any month, people are advised to stay out of the sea.

A safety officer said:

"On June 15th, I decided to advise people to stay out of the sea until further notice."

Explain why the safety officer made this decision, even though the seawater was safe on that date.

[2]

(ii)

I. Describe the trends shown in the table for the numbers of species A and B.

Species A:

Species B:

[2]

II. Use your answer to part (I.) to explain why the sampling should continue into October.

[1]

21a
2 marks

A group of students were asked to calculate the population size of garden snails (Helix aspersa) in 5 different areas of similar size in the school grounds. They sampled the five areas of the school grounds early in the morning on a damp day. The students sampled each area once only and counted the number of snails they found. The shell of each snail was marked with a small spot of white ink. The snails were then released.

[Figure: Photograph of a garden snail marked with a spot of white ink on its shell]

Approximately one week later, on a damp morning, the students sampled the same areas of the school grounds a second time. This time they recorded the number of recaptured snails (the ones that had been marked with white ink a week earlier) and the number of snails which had not been marked with white ink.

[Figure: Diagram illustrating the capture-mark-release-recapture method in three steps: CAPTURE, MARK-RELEASE, RECAPTURE]

The table below shows the capture – recapture results obtained by the students.

Area of school grounds

No. of snails captured and marked in 1st sample

No. of snails in 2nd sample

No. of snails in 2nd sample previously marked

Population size

playing field

3

2

1

6

hedgerow

9

4

3

12

flowerbed

7

4

2

14

boundary wall

11

9

5

20

vegetable garden

23

17

10

.............

Use the equation below to calculate the population size for the snails living in the vegetable garden. Write your answer in the table above.

text population size end text equals fraction numerator text number in 1 end text to the power of text st end text end exponent text sample end text cross times text number in 2 end text to the power of text nd end text end exponent text sample end text over denominator text number in 2 end text blank to the power of text n end text end exponent to the power of text d end text end exponent text  sample previously marked end text end fraction

Space for working.

21b
1 mark

State one way in which the students kept their investigation fair.

21c
2 marks

The song thrush (Turdus philomelos) feeds on snails. During the week after marking the snails with white ink some of the students noticed that the number of song thrushes in the five areas of the school grounds had increased. This increase may have been due to a problem resulting from the students' method. Suggest why the number of song thrushes increased and how the students could overcome the problem.

[Figure: Photograph of a song thrush eating a garden snail]