Circulatory System in Humans (WJEC GCSE Science (Double Award): Biology): Exam Questions

Exam code: 3430

1 hour12 questions
1a
3 marks

Image 1.1 shows part of the human circulatory system.

Image 1.1
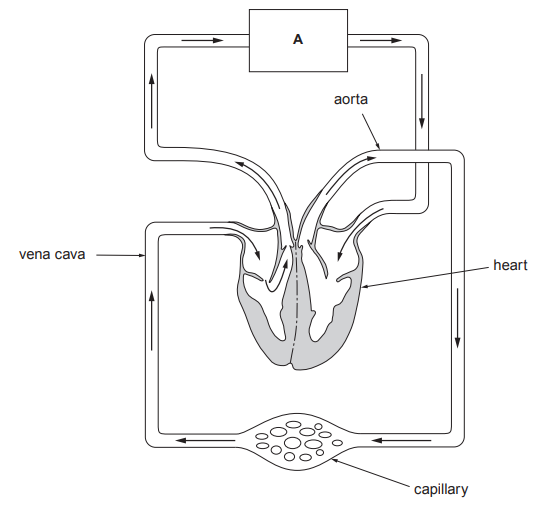
Diagram of human double circulatory system showing heart, aorta, vena cava, capillary network and arrows indicating blood flow through organ A.

From Image 1.1:

(i) Underline the name of organ A from the choices below.

brain

lung

kidney

stomach

[1]

(ii) Use the blood vessels named in Image 1.1, to state the blood vessel that:

I. is an artery;

..........................................

[1]

II. releases oxygen and glucose to the body cells.

..........................................

[1]

1b
7 marks

Table 1.2 shows the volume of blood supplied to the muscles of an athlete at increasing levels of activity.

Table 1.2

Level of activity

Volume of blood supplied to muscles (dm3/min)

at rest

2.0

standing

2.4

walking

3.6

jogging

5.0

sprinting

8.0

(i) Draw a bar chart of the data shown in Table 1.2 on the grid below by:

I. completing the label for the vertical axis by adding the units;

[1]

II. using a ruler to draw the bars.

[2]

[Figure: Blank bar chart grid with a horizontal axis pre-labelled "Level of activity" showing at rest, standing, walking, jogging, sprinting, and a vertical axis labelled "Volume of blood supplied to muscles" with a scale from 0.0 to 9.0 in increments of 1.0, units to be completed by the candidate]

(ii) Calculate the difference in blood volume supplied per minute to the muscles when the level of activity changes from walking to sprinting.

[1]

Difference = .......................................................... dm3 / min

(iii) I. State how increasing the level of activity changes the volume of blood supplied to muscles.

..........................................

[1]

II. Complete the sentence below by underlining the correct term in each bracket to explain how this change helps muscles work harder.

This change provides more (carbon dioxide / oxygen / nitrogen) for (respiration / photosynthesis / digestion).

[2]

2a
3 marks

Image 4.1 shows a section through a human heart.

Image 4.1

[Figure: diagram of a cross-section through a human heart, labelled LEFT and RIGHT, with chambers A and B indicated]

(i) State the name of chambers A and B shown in Image 4.1.

[1]

A ........................................................................................

B ........................................................................................

(ii) Humans rely on a double circulatory system. State what is meant by a double circulatory system.

[2]

2b
3 marks

Graph 4.2 shows the maximum pressure that occurs in the heart and associated blood vessels during the cardiac cycle.

Graph 4.2

[Figure: bar chart showing maximum pressure (mm Hg, 0-160) for right atrium, left atrium, aorta, pulmonary artery, right ventricle, and left ventricle during the cardiac cycle]

(i)

I. Calculate the difference in the maximum pressure between the right ventricle and the left ventricle.

[1]

Difference in pressure = ....................................................... mm Hg

II. State how the structure of the left ventricle causes this difference in pressure.

[1]

(ii) Suggest why the maximum pressure in the aorta is the same as that in the left ventricle.

[1]

2c
2 marks

Cardiovascular disease (CVD) is a general term for conditions affecting the heart or blood vessels. High blood pressure is one of the most important risk factors for CVD.

Scientists carried out an investigation to test the following hypothesis:

"Eating food or drink that is high in nitrate causes blood vessels to widen, leading to a decrease in blood pressure."

The investigation was carried out as follows:

  • Three volunteers were each given a different meal.

  • Volunteer 1: A salad made from vegetables that naturally contain almost no nitrate.

  • Volunteer 2: A salad containing spinach and rocket, which have naturally high levels of nitrate.

  • Volunteer 3: A portion of beetroot juice, calculated to contain exactly the same quantity of nitrate as the meal eaten by volunteer 2.

  • The blood pressure of each volunteer was tested before and after their meal.

The results are shown in Graph 4.3.

Graph 4.3

[Figure: bar chart showing blood pressure (mm Hg, 110-140) before and after meal for volunteer 1, volunteer 2, and volunteer 3]

State two conclusions which can be made from these results.

2d
2 marks

Suggest why the widening of coronary arteries can lower the risk of a heart attack.

3
6 marks

Describe the pathway taken by the blood in a double circulatory system. Start your account with the return of blood along the pulmonary vein from the lungs to the left atrium of the heart. Your account must include details of how backflow of blood is prevented.

4
1 mark

Blood clots form at wounds in the skin.

Complete the following sentence by underlining the correct part of the blood in the brackets.

Blood clotting is a function of the (platelets / red blood cells / white blood cells).

5a
5 marks

The photograph shows a fitness smartwatch.

[Figure: Photograph of a fitness smartwatch]

Bethan used a smartwatch to investigate the resting heart rates of ten students in her class.

  • Five girls and five boys were chosen at random.

  • Each student sat at rest for one minute.

  • Then the heart rate shown on the smartwatch was recorded.

The results are shown in Table 4.1.

Table 4.1

Girls

Boys

Name

Resting heart rate (beats per minute)

Name

Resting heart rate (beats per minute)

Seren

69

Dan

62

Katya

74

Jim

65

Nia

73

Ifor

67

Tracy

59

Rhys

60

Angharad

70

Mohamed

63

mean = 69

mean = ..........................

(i)

I. Calculate the mean resting heart rate for the boys.

Give your answer to the nearest whole number. Write your answer in Table 4.1.

[3]

II. State the conclusion that can be made from a comparison of the two means.

[1]

(ii) State one way that this investigation is a fair test.

[1]

5b
6 marks

Table 4.2 shows the mean resting heart rates by age in women and men from thousands of fitness smartwatch users of many nations and ethnicities.

Table 4.2

Age (years)

Mean resting heart rate (beats per min)

Women

Men

20

67.0

62.5

30

67.5

63.5

40

68.0

64.0

50

67.0

64.5

60

66.0

64.0

70

65.0

62.0

80

64.0

61.0

(i) Graph 4.3 shows the plotted data for women and two plots for men.

Complete Graph 4.3 by:

I. plotting the remaining points for the men on the grid.

II. joining all the plots for men with a ruler.

[3]

Graph 4.3

[Figure: Graph 4.3 — a grid with age (years) on the x-axis (20–80) and mean resting heart rate (beats per min) on the y-axis (60–69), showing the women's data fully plotted and joined, and only two of the men's data points plotted]

(ii) From Graph 4.3:

State whether the data support the results of Bethan's investigation and explain your answer.

[1]

(iii) Describe how the mean resting heart rate in men changes between the ages of 20 and 80 years.

[2]

5c
2 marks

Give two reasons why the smartwatch data in Table 4.2 are more representative of mean human resting heart rates than those in Table 4.1.

  1. ………..............................................................

  2. ..................................……………………………………..

6
3 marks

The photograph below shows a smear of blood viewed under the high power magnification of a microscope.

[Figure: Photograph of a blood smear viewed under high power magnification of a light microscope, showing stained red and white blood cells]

(i) Describe the procedure involved in preparing these blood cells for viewing under the microscope and state the reason why this is needed.

[2]

(ii) The ratio of red blood cells to white blood cells is 500:1. A sample of blood has 57 000 red blood cells.

Calculate the number of white blood cells in the sample.

Number of white blood cells = .................

7a
2 marks

The diagram shows the human heart.

[Figure: A diagram of the human heart with the vena cava, pulmonary vein, coronary artery, pulmonary artery and blood vessel X labelled]

(i) Blood vessel X is an artery carrying oxygenated blood from the heart at high pressure.

State the name of blood vessel X.

................................................................................................

[1]

(ii) State the function of the coronary artery.

[1]

7b
6 marks

Don investigated the effect of increasing intensity of exercise on the heart rate of three boys in his class, Dylan, Dewi and Dougie. His method is shown below.

  1. He asked them to walk.

  2. He counted their heart rate for one minute.

  3. He repeated the method for jogging and then sprinting.

The results are shown in the table.

Heart rate (beats/minute)

walking

jogging

sprinting

Dylan

74

84

96

Dewi

82

88

98

Dougie

80

89

98

Mean

79

87

97

(i) From the table:

I. State the relationship between increasing intensity of exercise and heart rate.

[1]

II. Explain the importance of the relationship for respiring muscle tissue.

[2]

(ii) Suggest two ways Don could improve his experimental method in order to make a fair comparison between the three boys.

[2]

(iii) Suggest one way that Don could develop his investigation to make his results more representative of the whole population of Wales.

[1]

8a
5 marks

The heart is a pump which supplies blood to the organs of the body. It deals with increasing physical activity, such as exercise, by increasing its rate (number of beats per minute). After exercise, the heart rate will eventually return to the resting rate. The time the heart takes to return to its resting rate is a good indication of a person's level of fitness.

A researcher wanted to investigate the difference in the level of fitness between men and women.

Six people at a gym volunteered to compare their fitness. Each volunteer ran on a treadmill for five minutes. Immediately at the end of the exercise their heart rates were recorded on a laptop computer. Their heart rates were also recorded one minute later.

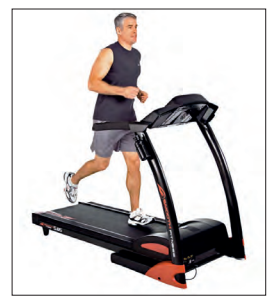
Photograph of a man in sports clothing running on a motorised treadmill, illustrating the five-minute treadmill exercise performed by volunteers in the fitness investigation.

The researcher conducting the investigation used the data collected from each volunteer to calculate their fitness index. An index of 60 – 70 shows a person who is reasonably fit, below this level shows decreasing fitness.

The results of the investigation are shown in the table below.

Volunteer

Resting heart rate (beats/min)

Heart rate immediately after exercise (beats/min)

Heart rate 1 min after exercise (beats/min)

Fitness index

Body mass (kg)

John

70

190

130

35

56.5

Michael

70

150

80

60

63.6

Charlotte

60

110

65

75

76.4

Paul

80

195

140

20

101.8

Peter

75

180

156

43

59.1

Lucy

70

130

80

68

56.1

(i) Who appears to be the least fit person in the table? Explain your answer.

[1]

(ii) What is the relationship between fitness index and heart rate immediately after exercise?

[1]

(iii) At the end of the investigation the volunteers discussed the results. Peter said that 'he thought that John was fitter than Lucy because one minute after exercise John's heart rate had fallen by 60 beats/min whereas Lucy's had only fallen by 50 beats/min.' The researcher said that you must calculate the percentage decrease in the heart rates in order to make a fair comparison.

I. In the space below calculate the percentage decrease in the heart rates of both John and Lucy.

John

Percentage decrease in heart rate = .......................

Lucy

Percentage decrease in heart rate = .......................

[2]

II. From the answers to (I) above, state whether John or Lucy appears fittest.

......................................................................

[1]

8b
1 mark

The design of this investigation has many faults.

Give two factors which should be controlled in this investigation.

9a
4 marks

In one complete circulation of the body, blood passes through the heart twice. The blood travels:

  • from the heart to the lungs and then back to the heart in the pulmonary circulation; and

  • from the heart to the other organs of the body and back to the heart in the systemic circulation.

This double circulation is essential for the functioning of highly active animals such as mammals.

The diagram below represents the double circulation in humans. It shows the direction of blood flow and the pressure of the blood in various blood vessels in a healthy 25-year-old woman at rest. The pressure of the blood is measured in mmHg (millimetres of mercury).

[Figure: Diagram of the double circulation in humans, showing the heart with right atrium (5 mmHg), right ventricle (15 mmHg), left atrium (8 mmHg), and left ventricle (120 mmHg). Blood flows from the right ventricle through the pulmonary artery (15 mmHg) to the lungs and back through the pulmonary vein (10 mmHg) to the left atrium, then from the left ventricle through the aorta (120 mmHg) to the body organs and back through the vena cava (6 mmHg) to the right atrium]

Suggest a reason for the difference in the:

(i) thickness of the walls of the atria and the ventricles;

[1]

(ii) blood pressure between the pulmonary artery and pulmonary vein;

[1]

(iii) blood pressure between the pulmonary artery and the aorta.

[2]

9b
2 marks

Using the data for blood pressure in the diagram opposite, suggest why, after leaving the lungs, the blood has to return to the heart before it is sent to the other organs of the body.

9c
1 mark

Describe how the direction of blood flow is maintained in the circulatory system.

10a
2 marks

The diagram shows a section through the human heart.

[Figure: Diagram of a section through the human heart, showing the aorta, pulmonary artery, right ventricle, left ventricle, septum, and two unlabelled structures X and Y, with arrows showing the flow of blood]

State the name of structures labelled X and Y on the diagram.

X ......................................................................................................

Y ......................................................................................................

10b
4 marks

The walls of the atria and ventricles are of different thicknesses and are made of muscle. When the muscle contracts blood is pumped from one part of the heart to another or is pumped out of the heart.

The chart below shows the change in the blood pressure in the left atrium and left ventricle as they contract.

[Figure: Chart plotting blood pressure (kPa, y-axis 0-1.4) against time (s, x-axis 0-18), showing two traces: pressure in the left ventricle (large peak) and pressure in the left atrium (small peak)]

(i) State the maximum blood pressure in:

I. left atrium ......................................... kPa

II. left ventricle ......................................... kPa

[1]

(ii) State how the blood pressure in the right ventricle would be different to that in the left. Give the reason for this difference and explain its significance.

[3]

11a
3 marks

An Olympic athlete exercised on a treadmill. During the exercise her blood oxygen and lactic acid levels were continuously monitored as was her heart rate.

The athlete's fitness coach knew the maximum intensity of exercise she could perform (100%). The athlete increased the intensity of exercise until she reached the maximum intensity of exercise she could perform (100%). She then stopped the exercise but her heart rate and blood levels continued to be monitored.

The graph below appeared on a computer screen.

[Figure: Graph showing oxygen usage, lactic acid, and heart rate (each on a low-to-high scale) plotted against time (minutes), with a marker showing when exercise stopped. Oxygen usage and heart rate rise during exercise then decline gradually after exercise stops; lactic acid rises during exercise and remains elevated for some time after exercise stops before declining]

(i) Explain why, even after exercise stops, the athlete continues to take in and use large volumes of oxygen.

[2]

(ii) Explain why the heart rate remains high after exercise stops.

[1]

11b
2 marks

The ability of oxygen to pass into the capillaries around the alveoli decreases with increasing altitude. Above 1500 m physical activity becomes more difficult.

In 1968, the Olympic Games were held in Mexico City (altitude 2268 m). Athletes and their coaches realised the difficulty of competing at the altitude of Mexico City and many of them arrived, and started training, three months before the games started. As a result of this long period of acclimatisation to altitude, the number of red blood cells per unit volume of blood in the athlete's body increased. This is one of the effects of living and working at altitude.

Explain the advantage, to the athletes, of the increased number of red blood cells per unit volume of blood.

12
6 marks

The bar chart shows the blood volume (dm3/min) supplied to some parts of the body at rest and during exercise.

[Figure: Bar chart showing blood volume (dm3/min, y-axis 0-14) supplied to the brain, heart, and muscles, grouped by activity level: sitting, walking, and running. Blood volume to muscles increases substantially from sitting to running, while blood volume to the brain stays roughly constant]

(i) Calculate the blood volume supplied to the muscles when sitting.

Blood volume = ............................................. dm3/min

[1]

(ii) Calculate an increase in blood volume supplied to the muscles when running compared to sitting.

Increase in blood volume = ............................................. dm3/min

[1]

(iii) Complete the following sentence.

As blood flows through muscles, substances pass out of narrow blood vessels.

These blood vessels are called .............................................................................. .

[1]

(iv) Three of the following statements correctly describe the result of an increase in blood volume supplied to muscles.

Underline the three correct statements.

More oxygen is supplied

More lactic acid is produced

More glucose is supplied

More anaerobic respiration takes place

More aerobic respiration takes place

[3]