13 marks
The heights are also shown in the frequency table.
Height ( cm) |
| |||
Frequency |
Complete the histogram to show this information.

Was this exam question helpful?
Exam code: 0580 & 0980
The heights are also shown in the frequency table.
Height ( cm) |
| |||
Frequency |
Complete the histogram to show this information.
Was this exam question helpful?
The frequency table shows the times, minutes, each of 100 children spent exercising in one week.
Time ( minutes) | |||||
Frequency | 41 | 24 | 23 | 8 | 4 |
A histogram is drawn to show the information in the frequency table.
The height of the bar for the interval is 10.8 cm.
Calculate the height of the bar for the interval .
............................................ cm
Was this exam question helpful?
The speed, v km/h, of each of 200 cars passing a building is measured.
The frequency table shows the results.
Speed ( km/h) | |||
Frequency |
On the grid, draw a histogram to show the information in this table.

Was this exam question helpful?
200 students estimate the total area, , of the windows in a classroom.
The table shows their results.
Area (m2) | ||||
Frequency | 32 | 64 | 80 | 24 |
Complete the histogram to show the information in the table.

Was this exam question helpful?
During one year the midday temperatures, t °C, in Zedford were recorded.
The table shows the results.
Temperature (t °C) | |||||
Number of days | 50 | 85 | 100 | 120 | 10 |
Complete the histogram to show the information in the table.

Was this exam question helpful?
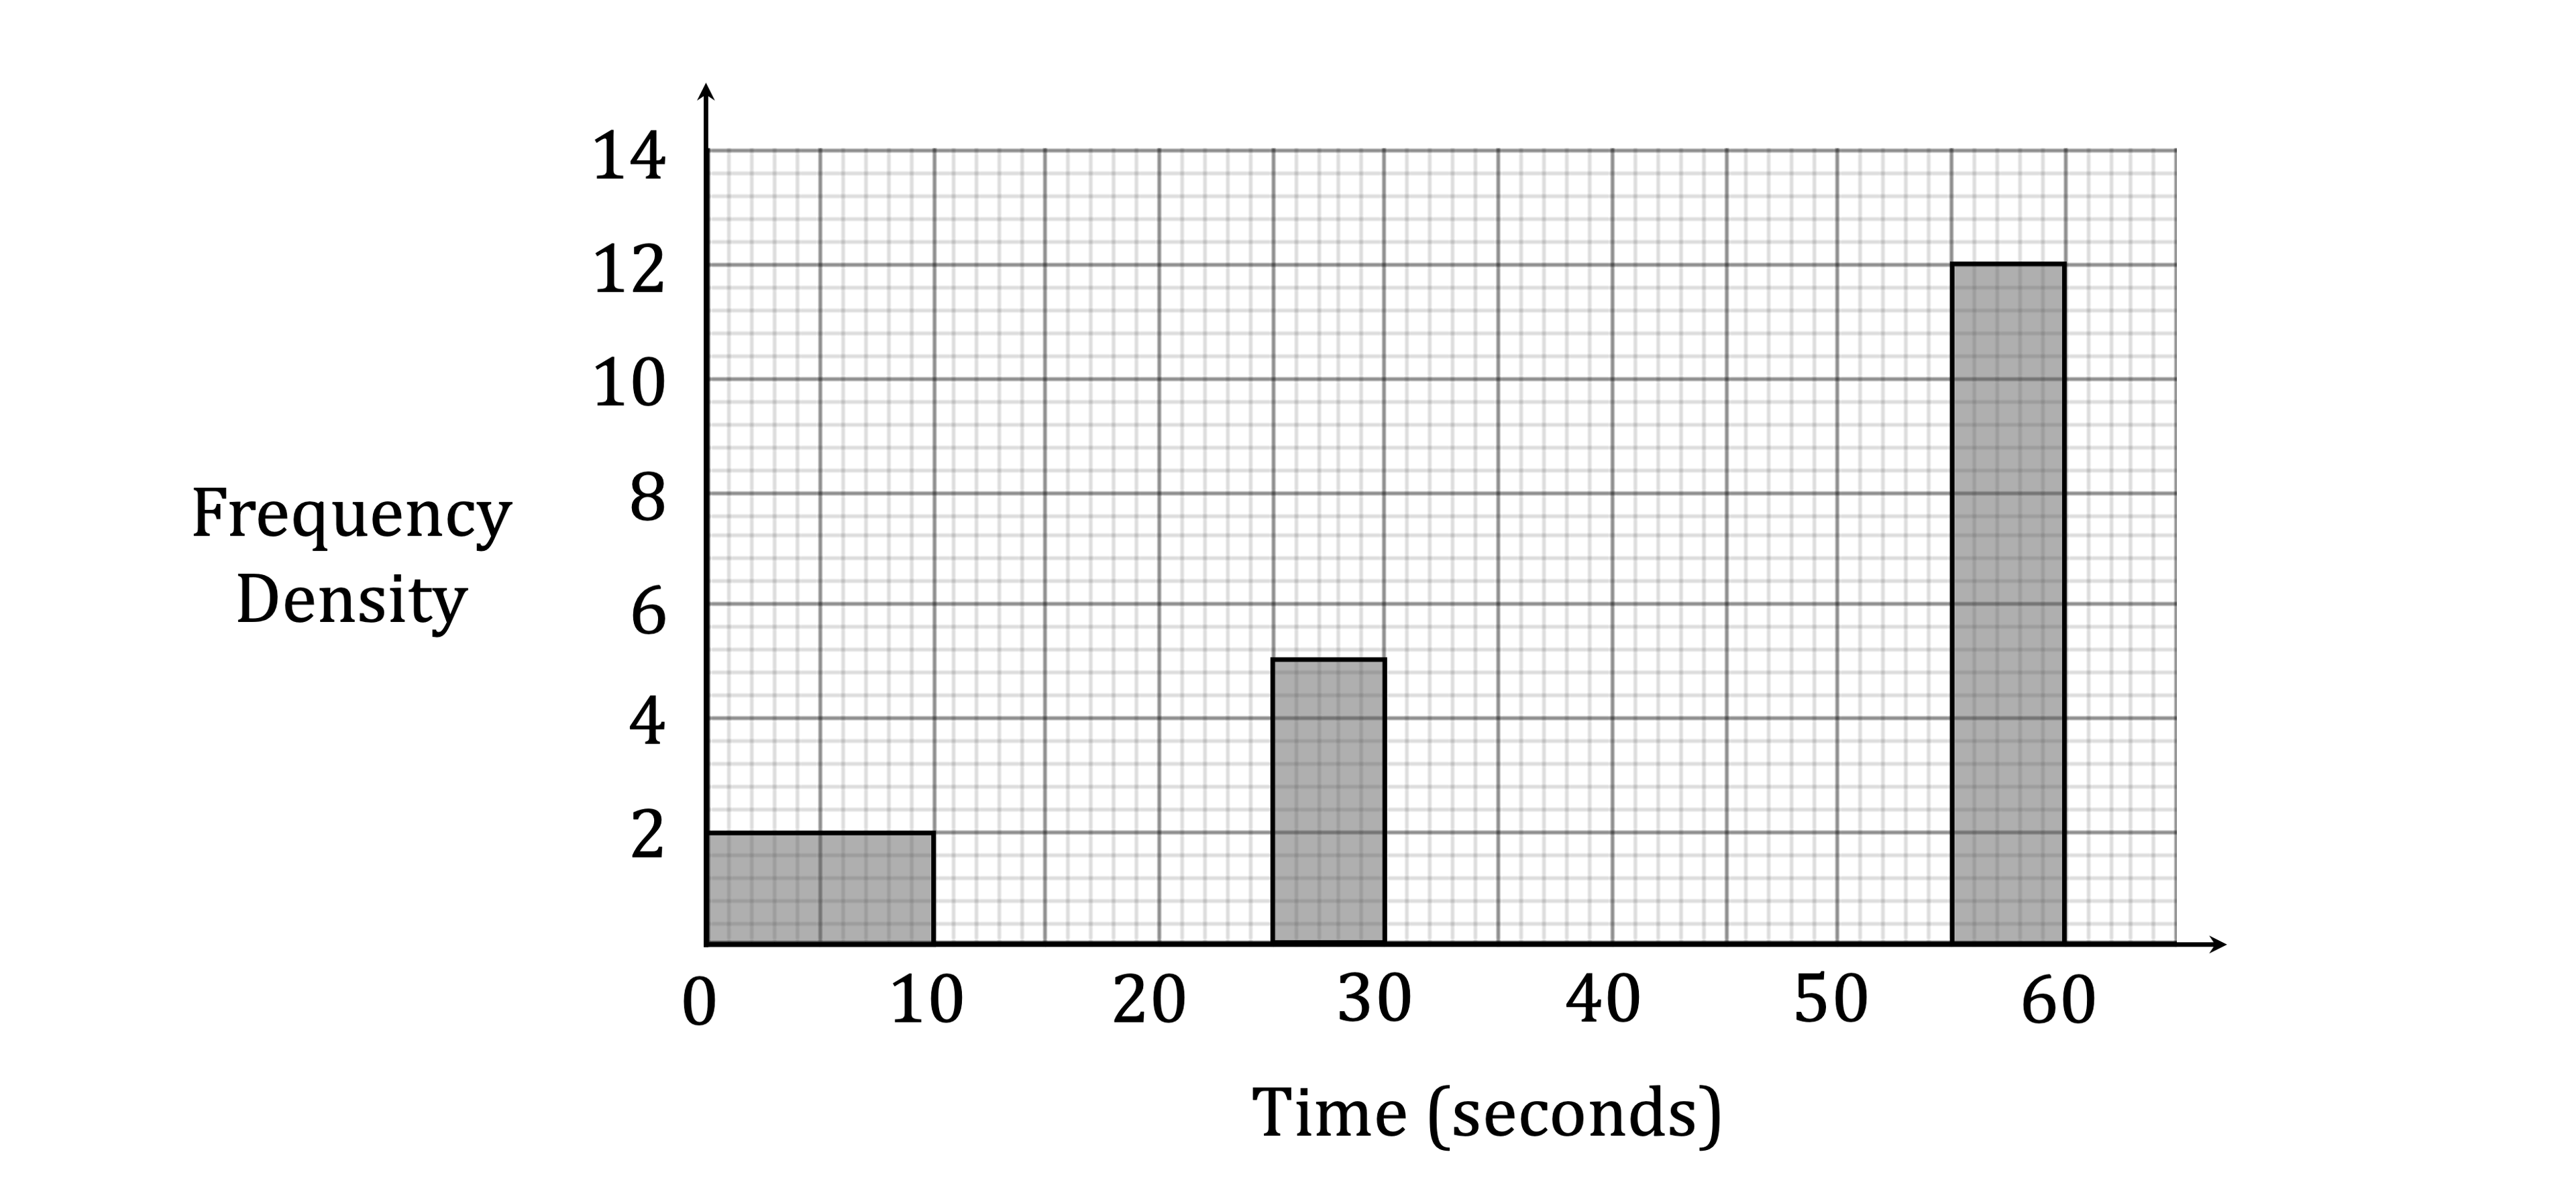
The table shows the time, seconds, taken by each of 120 boys to solve a puzzle.
Time ( seconds) | |||||
Frequency | 38 | 27 | 21 | 16 | 18 |
On the grid, complete the histogram to show the information in the frequency table.

Was this exam question helpful?
Some students each record the mass, kg, of their school bag.
Adil wants to draw a histogram to show this information. Complete the table below.
Mass ( kg) | ||||
Frequency |
|
| ||
Height of bar on histogram (cm) |
Was this exam question helpful?
A school nurse records the height, cm, of each of 180 children. The table shows the information.
Height ( cm) | ||||||
Frequency | 8 | 26 | 35 | 67 | 28 | 16 |
In a histogram showing the information, the height of the bar for the interval is 0.4 cm.
Calculate the height of the bar for each of the following intervals.
.................................... cm
.................................... cm
..................................... cm
Was this exam question helpful?
The table shows the amount of time, T minutes, 120 people each spend in a supermarket one Saturday.
Time (T minutes) | Number of people |
16 | |
18 | |
22 | |
40 | |
21 | |
3 |
Complete this histogram to show the information in the table.

This histogram shows the amount of time, T minutes, 120 people each spend in the supermarket one Wednesday.

Make a comment comparing the distributions of the times for the two days.
Was this exam question helpful?
A factory recycles metal.
The mass, tonnes, of metal is measured each week.
The table shows the results for 52 weeks.
Mass ( tonnes) | ||||
Frequency | 8 | 20 | 12 | 12 |

On the grid, draw a histogram to show the information in the table.
Was this exam question helpful?
The histogram shows information about the time, minutes, spent in a shop by each of 80 people.

Complete the frequency table.
Time ( minutes) | |||||
Number of people |
|
|
Was this exam question helpful?
The height, cm, of each of 120 plants is measured. The frequency table shows this information.
Height, h cm | ||||
Frequency | 2 | 18 | 62 | 38 |
A histogram is drawn to show the information in the frequency table.
The height of the bar representing the interval is 7.2 cm.
Calculate the height of the bar representing the interval .
............................................ cm
Was this exam question helpful?
The table shows information about the times, seconds, taken by each of 100 students to solve a puzzle.
Time ( seconds) | |||||
Frequency |
Emmanuel draws a histogram to show this information.
The table shows the heights, in cm, of some of the bars for this histogram.
Complete the table.
Time ( seconds) | |||||
Height of bar (cm) |
|
|
Was this exam question helpful?
The time, minutes, it takes each of 50 students to travel to school is recorded.
The table shows the results.
Time ( minutes) | ||||
Frequency | 7 | 19 |
|
On the grid, complete the histogram to show the information in the table.

Was this exam question helpful?
The table shows the number of people in different age groups at a cinema.
Age ( years) | ||||
Number of people | 35 | 32 | 44 | 12 |
Dexter draws a histogram to show this information.
The height of the bar he draws for the group is 7 cm.
Calculate the height of each of the remaining bars.
........................................ cm
........................................ cm
........................................ cm
Was this exam question helpful?
Three sizes of eggs are sold in a shop. The table shows the number of eggs of each size sold in one day.
Size | Small | Medium | Large |
Mass ( grams) | |||
Number of eggs sold |
On the grid, draw a histogram to show the information in the table.

Was this exam question helpful?
The table and histogram shows information about the heights of plants in a garden.
Heights (cm) | Frequency |
|---|---|
Complete the histogram.
Complete the table using the histogram.
Was this exam question helpful?

Calculate an estimate of the mean.
............................................... kg
Was this exam question helpful?
The histogram shows information about the weights, in grams, of some plums.

Work out an estimate for the proportion of these plums with a weight of less than 100 grams.
Was this exam question helpful?
The table gives information about the heights of students.
Height( cm) | Frequency |
On the grid, draw a histogram for this information.

Work out an estimate for the fraction of the students who have a height between cm and cm.
Was this exam question helpful?
The histogram shows information about the time taken by cyclists to finish a cycle race.

7 cyclists took 80 minutes or less to finish the race.
i) Work out an estimate for the number of cyclists who took more than 105 minutes to finish the race.
[3]
ii) Explain why your answer to part (i) is only an estimate.
[1]
Was this exam question helpful?
The histogram gives information about the distribution of the weights of some onions grown by a farmer.

Onions less than 60 grams in weight are used for pickling. Onions greater than 120 grams in weight are sold at the market. The rest of the onions are sent to a food processing factory.
A pie chart is drawn using the information opposite to show what the farmer does with the onions he grows.

The angle of the sector for the onions sent to the food processing factory is .
Work out the value of .
Was this exam question helpful?