11 mark
A pendulum of length l with a bob of mass m oscillates with frequency f.
What is the frequency of a pendulum of length 4l with a bob of mass 2m?
Was this exam question helpful?
Exam code: 9PH0
A pendulum of length l with a bob of mass m oscillates with frequency f.
What is the frequency of a pendulum of length 4l with a bob of mass 2m?
Was this exam question helpful?
A simple pendulum oscillates with a period .
The length of the pendulum is increased to four times its original length.
What is the new period of the pendulum?
It cannot be determined without knowing the amplitude of the oscillations
Was this exam question helpful?
A mass is suspended from a spring and allowed to come to equilibrium.
The mass is displaced vertically and moves with simple harmonic motion.
The graph shows how the resultant force on the mass varies with time.

Which of the following graphs shows how the velocity v of the mass varies with time t over the same time interval?

Was this exam question helpful?
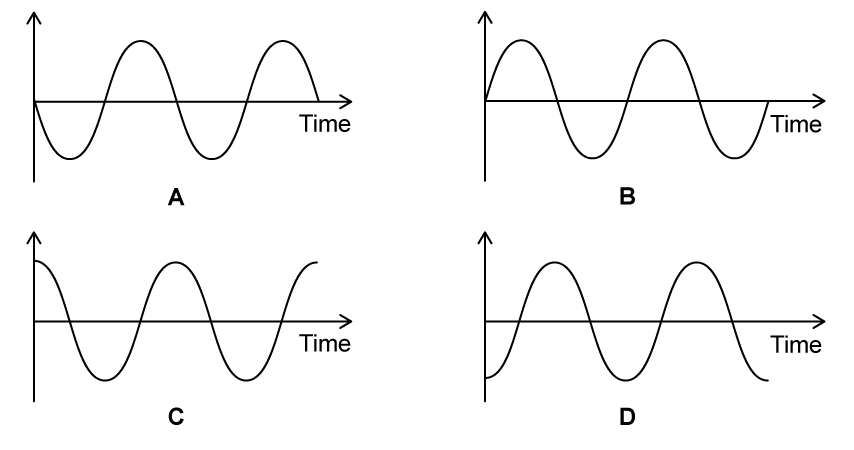
An object oscillates with simple harmonic motion. The graph shows how the displacement of the object varies with time.
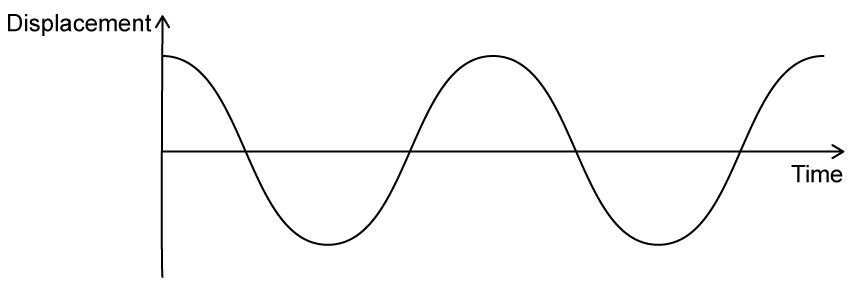
Which graph shows how the velocity of the object varies with time?
Was this exam question helpful?
The graph shows how the displacement of a simple harmonic oscillator varies with time.

Which of the following graphs shows how velocity varies with time for the same oscillator, over the same time period?

Was this exam question helpful?
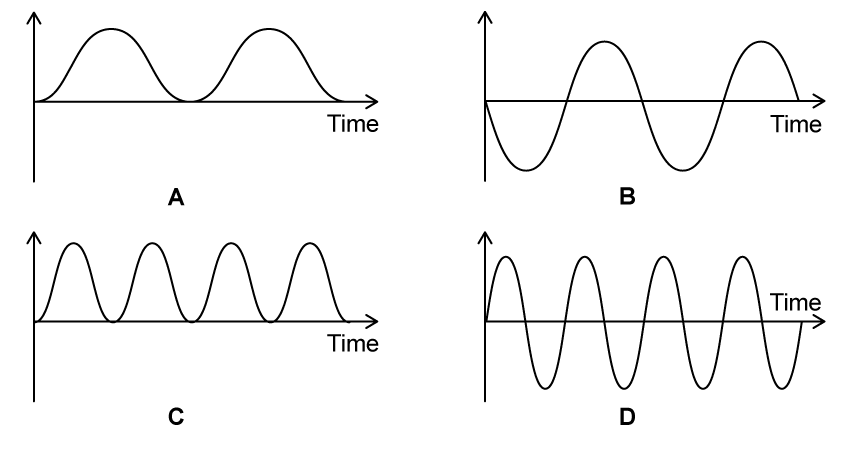
An object oscillates with simple harmonic motion. The graph shows how the displacement of the object varies with time.
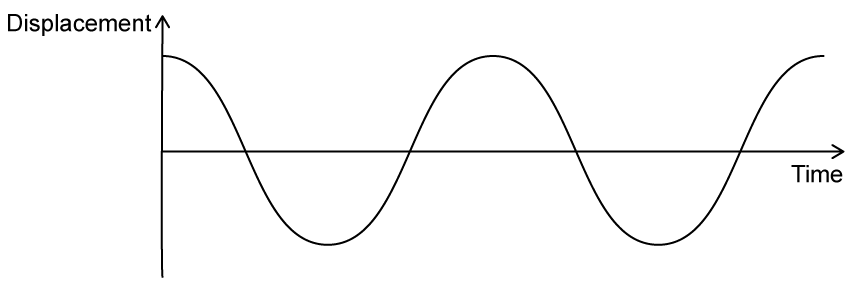
Which graph shows how the kinetic energy of the object varies with time?
Was this exam question helpful?
A mass at the end of a spring is set into small amplitude simple harmonic motion.
Which of the following graphs correctly shows the variation of velocity of the mass with displacement for one complete oscillation?


Was this exam question helpful?
An object undergoing simple harmonic motion has a period and total energy . The amplitude of oscillations is halved.
Which row of the table gives the new period and total energy of the system?
Period | Total energy | |
|---|---|---|
A | ||
B | ||
C | ||
D |
Was this exam question helpful?