Respiration & the Respiratory System in Humans (WJEC GCSE Science (Double Award): Biology): Exam Questions

Exam code: 3430

2 hours14 questions
1a
4 marks

Image 4.1 shows a diagram of the thorax.

Choose words from the list to label parts A to D on Image 4.1.

bronchiole

rib

alveolus

bronchus

diaphragm

membrane

Image 4.1

[Figure: Diagram of the thorax with four labelled structures A, B, C and D — showing the trachea branching into a bronchus, further branching into a bronchiole and alveolus, with the rib and diaphragm also shown]
1b
4 marks

Images 4.2A and 4.2B show part of the lining of the trachea for a non-smoker and a smoker.

Image  4.2A - non smoker
[Figure: Diagram of cells lining the trachea in a non-smoker, showing working cilia moving mucus containing bacteria in a direction of movement towards the throat]

Image 4.2B – smoker

[Figure: Diagram of cells lining the trachea in a smoker, showing mucus and bacteria present without the cilia actively moving them]

(i) Use Image 4.2A to describe how the mucus and cilia work together to remove bacteria from the trachea in a non-smoker.

I. mucus

..........................................

[1]

II. cilia

..........................................

[1]

(ii) Use Image 4.2B, to explain how smoking can lead to bacteria infecting the lungs.

..........................................

[2]

1c
2 marks

Smoking cigarettes can cause lung disease.

(i) State the name of one lung disease caused by smoking cigarettes.

..........................................

[1]

(ii) In 2007, the Welsh Government banned smoking in enclosed public spaces.

Suggest one reason for the ban.

..........................................

[1]

2
6 marks

Explain how the process of inspiration (breathing in) occurs in the human thorax.

(Diagrams will not be credited)

[6 QER]

3a
3 marks

The bell jar model in Image 2.1 is used to show how breathing occurs.

Image 2.1

[Figure: Image 2.1 — a bell jar model of breathing, showing a bell jar with two balloons attached to glass tubes and a rubber sheet stretched across the base]

Use words from the list to complete the following sentences.

inflates

decreases

deflates

equalises

increases

When the rubber sheet is pulled down the volume of the space inside the bell jar .................................................... and the air pressure .................................................... .

As a result, air is forced down the glass tubes and each balloon .................................................... .

3b
3 marks

The equipment labelled on the bell jar model in Image 2.1 represent different structures in the body. Name the structures represented by:

(i) the glass tube; .............................................................................

[1]

(ii) the bell jar; .............................................................................

[1]

(iii) the rubber sheet. .............................................................................

[1]

4a
2 marks

Write the word equation for aerobic respiration.

4b
8 marks

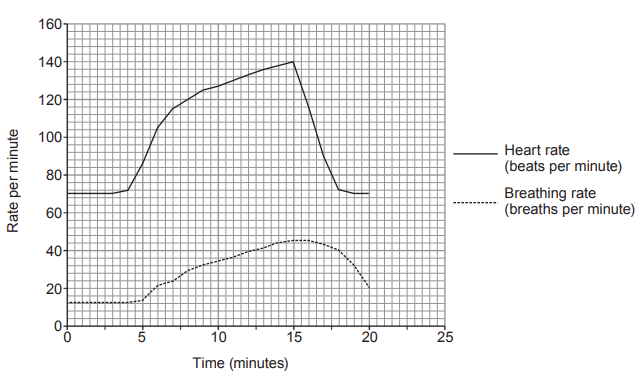
The heart and breathing rates of an athlete were recorded before, during and after a 3 km race.

The results are shown in Graph 7.1.

Graph 7.1

Line graph of heart and breathing rates over 25 minutes, both rising to a peak around 15 minutes then falling, with heart rate always higher than breathing rate

(i) Use Graph 7.1 to state at what time the race:

[1]

I. began ……………………………………………………………… minutes

II. ended ……………………………………………………………… minutes

(ii) Describe the relationship between the heart rate and breathing rate shown in Graph 7.1.

[2]

(iii) In this race the athlete started to respire anaerobically when 85% of the maximum heart rate was reached.

I. Use Graph 7.1 to calculate the heart rate when anaerobic respiration began.

[2]

Heart rate at which anaerobic respiration began = .................... beats per minute

II. Draw a horizontal line on Graph 7.1 to show the heart rate at which anaerobic respiration began.

[1]

(iv) Explain why the breathing rate remains high at the end of a race.

[2]

4c
1 mark

State why anaerobic respiration is less efficient than aerobic respiration.

5a
2 marks

Choose words from the list below to complete the word equation for aerobic respiration.

carbon dioxide

protein

oxygen

nitrogen

glucose + .................... → ...................... + water + energy

5b
9 marks

Tracy investigated the release of energy during respiration in germinating peas using one of the two methods (1 or 2) shown in Image 4.1.

Image 4.1

[Figure: diagram comparing two experimental methods for investigating energy release in germinating peas using thermos flasks - Method 1 shows Flask A (germinating peas) and Flask B (boiled peas) each sealed with an air-tight rubber bung and thermometer; Method 2 shows the same setup but sealed with cotton wool instead of an air-tight bung]

(i) State which of the two methods (1 or 2) Tracy should have used and explain your answer.

[2]

Tracy should have used Method ...............................

Explanation ..........................................

(ii) Table 4.2 shows the results of Tracy's investigation over seven days.

Table 4.2

Day

Temperature (°C)

flask A

flask B

1

20.0

20.0

2

21.0

20.0

3

23.0

20.0

4

26.0

20.0

5

27.5

20.0

6

28.5

20.0

7

29.5

20.0

Draw a line graph of the results on Graph 4.3 by:

[3]

I. plotting the points for flask A from day 3 to day 7. The first two days have been plotted for you.

II. joining all the plots with a ruler and labelling your line as flask A.

The results for flask B have been plotted for you.

Graph 4.3

[Figure: line graph grid with x-axis "Day" (1-7) and y-axis "Temperature (°C)" (10-30), showing flask B already plotted as a flat horizontal line at 20°C throughout, and flask A pre-plotted only for days 1 and 2 (20.0°C, 21.0°C), awaiting the remaining points to be plotted from Table 4.2]

(iii) At the start of the investigation, Tracy made two predictions:

  1. The temperature of the peas in flask A will rise but the temperature of the peas in flask B will not change.

  2. Eventually the temperature in flask A will stop rising.

Use the results to state whether each of Tracy's predictions were correct. Explain your answers.

[2]

Prediction 1 ..........................................

Prediction 2 ..........................................

(iv) Suggest one practical way in which Tracy could confirm or reject her second prediction.

[1]

(v) Tracy recorded the mass of the peas in flask A at the start and at the end of the investigation. Complete the sentence below by underlining the correct outcome that you would expect Tracy to observe.

[1]

During the investigation, the mass of the peas in flask A will have:

decreased / increased / remained the same

6a
4 marks

Image 6 shows the bell jar model which is being used to demonstrate inspiration.

Image 6

[Figure: diagram of a bell jar model demonstrating inspiration - a bell jar containing two balloons labelled A and B, with a rubber sheet stretched across the base of the jar]

(i) Parts A and B in Image 6 represent two parts of the human respiratory system.

Complete the following sentence:

[2]

In the bell jar model, part A represents the .......................................... and part B represents the ..........................................

(ii) As the rubber sheet is pulled down, the air pressure inside the bell jar changes.

Explain how the air pressure change in the bell jar causes the balloons to inflate.

[2]

6b
1 mark

The balloons are in an air-tight space in the bell jar. Lungs are sealed in an air-tight space in the chest.

A wound to the chest means the chest is no longer air-tight. As a result, the wounded person cannot fully inflate their lungs.

Explain why a person with a hole in the chest cannot fully inflate their lungs.

7a
2 marks

Image 7.1 shows an alveolus.

Image 7.1

[Figure: Image 7.1 — a diagram of an alveolus with a blood capillary running alongside it, showing air inside the alveolus, the wall of the alveolus and the wall of the blood capillary]

Use labelled arrows to identify the following structures on Image 7.1:

(i) bronchiole;

(ii) blood plasma.

7b
4 marks

Image 7.2 shows groups of alveoli from a healthy lung and from a lung of a person with emphysema. The tables below Image 7.2 show the concentrations of oxygen and carbon dioxide in the blood capillaries.

Image 7.2

[Figure: Image 7.2 — two diagrams of groups of alveoli, one from a healthy lung showing many small, intact alveoli, and one from a lung with emphysema showing fewer, larger, damaged alveoli with broken walls]

Healthy lung

Gas

Concentration of gases in the blood capillaries (arbitrary units)

oxygen

86

carbon dioxide

45

Lung with emphysema

Gas

Concentration of gases in the blood capillaries (arbitrary units)

oxygen

53

carbon dioxide

62

(i) Using Image 7.2, explain the differences in the concentrations of gases in the blood capillaries of a healthy lung and a lung with emphysema.

[2]

(ii) State the effect on breathing of the difference in concentrations of these gases for a person suffering from emphysema.

[1]

(iii) State one cause of emphysema.

[1]

8a
6 marks

The diagram shows the human thorax after breathing in.

![[Figure: A diagram of the human thorax after breathing in, showing labelled structures X, Y and Z, with the lung and diaphragm also labelled]]

(i) State the name of the structures labelled:

X .....................................................................................

[1]

Y .....................................................................................

[1]

(ii) The structures labelled Z are the sites of gas exchange.

State the name of the structures labelled Z.

.....................................................................................

[1]

(iii) Complete the following sentences by choosing the correct words from the list.

decreases

contracts

relaxes

increases

When we breathe out, the diaphragm .................................................... and becomes dome shaped. As a result, pressure in the thorax .................................................... , so air is forced out of the lungs.

[2]

(iv) Choose the letter (A-C) that shows the pathway of air from the lungs when we breathe out.

A

trachea → bronchus → bronchiole

B

bronchus → trachea → bronchiole

C

bronchiole → bronchus → trachea

Answer letter = ..........................................

[1]

8b
2 marks

The maximum volume of air that can be breathed out in one breath is called the vital capacity. The diagram shows apparatus that Lowri used to measure her vital capacity.

[Figure: A diagram of a bell jar apparatus for measuring vital capacity, showing a bell jar filled with water inverted over a glass trough of water, supported on blocks, connected via a rubber tube and mouthpiece, with litre scale markings shown both 'At the start' (water level before breathing out) and 'At the end' (water level after breathing out)]

Describe how Lowri used the apparatus above to measure her vital capacity.

8c
4 marks

The table shows the vital capacities of some students in a school. The vital capacities were measured to the nearest 0.1 litre.

Vital capacity (l)

Number of students

0 - 0.9

5

1.0 - 1.9

9

2.0 - 2.9

20

3.0 - 3.9

8

4.0 - 4.9

23

5.0 - 5.9

7

(i) Use a ruler to draw a bar chart of the results on the grid.

[Figure: A blank grid with vital capacity (l) bands (0.0-0.9 to 5.0-5.9) on the x-axis and number of students (0-25) on the y-axis, for drawing a bar chart]

[2]

(ii) Suggest two possible reasons to account for the variation in vital capacity.

[2]

9a
2 marks

The thoracic cavity is the space in the body that contains the lungs. The volume of this space in a healthy adult man is about 5 500 cm3. The lungs occupy 70% of the thoracic cavity. This is around 3 850 cm3.

State two other structures which occupy the remaining 30% of the space of the thoracic cavity.

(i) .......................................................................................................

(ii) .......................................................................................................

9b
5 marks

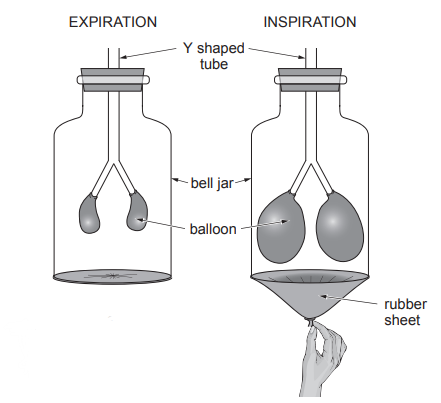
The diagrams below show front views of the thorax during expiration and inspiration.

[Figure: Front view diagrams of the thorax showing expiration and inspiration. Labels include chest wall, lung, cut end of rib, thoracic cavity, and diaphragm. In expiration the diaphragm is domed upward and the chest wall is relaxed; in inspiration the diaphragm is flattened and the chest wall/ribs move outward]

Use the information in the diagrams above, and your own knowledge, to explain how inspiration occurs.

9c
4 marks

The bell jar model can be used to demonstrate expiration and inspiration as shown below.

[Figure: Diagram of a bell jar model demonstrating expiration and inspiration, showing a Y-shaped tube, bell jar, two balloons, and a rubber sheet.

Volume of one deflated balloon = 2.4 cm3

Volume of bell jar = 5 500 cm3

(i) Calculate the percentage of the volume of the bell jar taken up by the two deflated balloons. Give your answer to two decimal places.

% of volume of bell jar taken up by deflated balloons = ..........................................

[2]

(ii) Using only the information and diagrams given and the calculation above, describe two limitations of the bell jar model compared with the human thorax.

I. ...................................................................................................................

II. ...................................................................................................................

[2]

10
6 marks

Explain the function of cilia and mucus in the cleaning mechanism of the lungs and describe the effect smoking has upon this cleaning mechanism.

11a
2 marks

An investigation compared the composition of inspired and expired air. This is shown in the table below.

Gas

% Concentration of air

inspired

expired

oxygen

20.9

16.0

carbon dioxide

0.04

4.0

water vapour

variable

variable

nitrogen

78.1

78.1

(i) Calculate the difference in the % concentration of oxygen in the expired air and the inspired air.

difference = ......................... %

[1]

(ii) State the process in cells that uses oxygen and glucose to release energy.

.......................................................................................

[1]

11b
4 marks

People with a disease called ARDS (Acute Respiratory Distress Syndrome) have difficulty getting enough oxygen.

The diagrams show a healthy alveolus and an alveolus from someone with ARDS.

(i) Draw an arrow on the diagram of the healthy alveolus, to show the direction of movement of oxygen through the alveolar lining.

[Figure: Two diagrams side by side. The healthy alveolus shows a capillary containing a red blood cell, alveolar lining, and bronchiole, with a thin lining. The ARDS alveolus shows the same structures but with a hardened lining to the capillary]

[1]

(ii) Describe two differences you can see between the two diagrams and explain why people with ARDS have difficulty getting enough oxygen from inspired air.

[3]

12a
1 mark

The word equation for aerobic respiration is shown below.

glucose + oxygen → carbon dioxide + water + ATP

In the space below state the word equation for anaerobic respiration in human cells.

12b
2 marks

Explain why anaerobic respiration is less efficient than aerobic respiration.

13a
1 mark

Smoking is the largest single cause of avoidable ill health and early death in Wales. In order to reduce this, the Welsh Government has focused on three areas in recent years: discouraging young people from starting to smoke, helping smokers to give up and extending smoke-free environments.

Tobacco smoke contains carcinogens.

State the type of disease caused by carcinogens.

.................................................................................................................................

13b
7 marks

The table below shows the percentage of the adult population of Wales between 2007 and 2014 who smoked cigarettes.

Year

Percentage of the adult population who smoke (%)

2007

24

2008

24

2009

23

2010

22

2011

22

2012

21

2013

20

2014

19

Sources: National Public Health Service for Wales, Welsh Assembly Government, Office for National Statistics

(i) Complete the graph of the data above on the grid opposite by:

I. plotting the points from 2010 to 2014

II. joining all the plots using a ruler.

[Figure: Grid with axes 'Year' (x-axis, 2007-2020) and '% adult smokers' (y-axis, 10-26), with points for 2007-2009 already plotted]

[3]

(ii) In 2007, the Welsh Government banned smoking in enclosed public places as part of a policy to reduce the percentage of adults who smoke.

Give the evidence that the ban had no immediate effect on the percentage of adults who smoke.

[1]

(iii) In 2012, the Welsh Government produced a Tobacco Control Action Plan. One aim was that by 2020 no more than 16% of adults would smoke.

I. Extend the line on the graph to predict the % of adult smokers in 2020.

Write your answer below.

adult smokers in 2020 = ........................... %

[1]

II. Your prediction in part (I) is based on an assumption.

What does your prediction assume?

[1]

(iv) Suggest one other step that could further reduce the percentage of adults who smoke.

[1]

13c
6 marks

The breathing rate is the number of times a person breathes in and out in one minute.

You have 100 volunteers. Of these, 50 are cigarette smokers and 50 do not smoke.

Plan an investigation to answer the following question:

'Is the breathing rate of smokers different from that of non-smokers?'

Include at least two factors which should be kept the same in order to make it a fair test.

14
6 marks

The following word equations show the two types of cell respiration which occur in humans.

Equation 1

Glucose + Oxygen → Carbon dioxide + Water + ATP

Equation 2

Glucose → Lactic acid + ATP

Name each of the types of cell respiration shown above and write an account explaining when each occurs in the human body. Include any advantages or disadvantages of each type of respiration.