Disease, Defence & Treatment (WJEC GCSE Science (Double Award): Biology): Exam Questions

Exam code: 3430

1 hour11 questions
1a
4 marks

The term superbug is used to describe disease-causing (pathogenic) bacteria that are no longer killed by certain antibiotics. These bacteria have developed antibiotic resistance.

Image 9.1 shows the actual deaths from superbugs in the world in 2014 and the predicted deaths in 2050.

Image 9.1
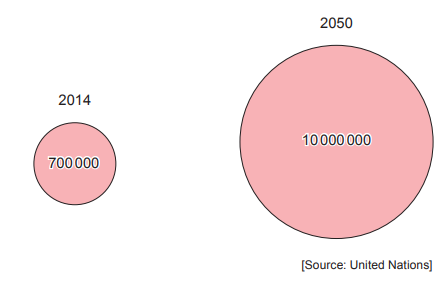
Bubble chart comparing 2014 and 2050, showing pink circles growing from 700,000 to 10,000,000, indicating a large projected increase in numbers

(i) Use the equation below to calculate the percentage increase in predicted deaths from superbugs in the world between 2014 and 2050.

Give your answer to the nearest whole number.

[3]

number in 2050−number in 2014number in 2014×100

Percentage increase in deaths = ..........

(ii) State the main reason for the increase of antibiotic resistance in some pathogenic bacteria.

[1]

1b
2 marks

Health scientists were experimenting on the effect of the antibiotic methicillin on three different species of pathogenic bacteria. They used a triple compartment Petri dish in their experiment.

Transparent round Petri dish with three internal compartments, its lid resting at an angle behind it on a white background

The method they used is shown below:

  • Each compartment was filled with a nutrient jelly (agar), which allows bacteria to grow.

  • Bacteria species A, B and C were each placed in a different compartment.

  • A disc of filter paper containing the antibiotic methicillin was placed in the centre of each compartment.

  • The Petri dish lid was used to close the dish. The dish was then placed in an incubator at 37 °C.

  • After two days the Petri dish was examined.

Image 9.2 shows the surface view of the Petri dish after 2 days. The shaded areas show where bacteria were living. The clear areas show where there were no bacteria remaining.

Image 9.2
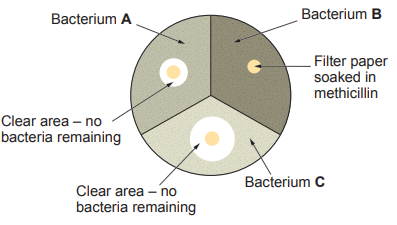
Petri dish divided into three; methicillin discs on bacteria A, B, C, with clear inhibition zones for A and C but not for resistant bacterium B

(i) Use Image 9.2 to identify which bacterium is the superbug MRSA.

Circle your answer.

[1]

A B C

(ii) Explain your answer.

[1]

..........

1c
3 marks

Sir Alexander Fleming discovered penicillin, the first antibiotic, in 1928. However, it was not used on a patient until 1942. There is still a long delay between the discovery of new drugs and their use in treating disease today.

(i) State the source of the penicillin discovered by Sir Alexander Fleming.

[1]

..........

(ii) State one reason for the long delay between the discovery of new drugs and their use in treating disease in humans.

[1]

..........

(iii) Suggest why it is important to medical science that global biodiversity is maintained.

[1]

..........

2a
2 marks

Image 5 shows surgery on a patient with heart disease caused by a faulty gene.

Image 5

[Figure: photograph of surgeons performing heart surgery on a patient]

After surgery, it is important that wounds are sealed.

Explain why wounds must be sealed.

2b
2 marks

Patients are given antibiotics after surgery.

State the name of one antibiotic and the reason why antibiotics are given to patients.

Antibiotic ........................................................................................

Reason ..........................................................................................

3a
2 marks

Complete the table by writing true or false against each of the following pairs of statements about antibiotics and vaccines.

Statements

True or False

Antibiotics are produced from fungi.

Vaccines are produced from dead or non-active pathogens.

...............................

Antibiotics are used to prevent infection.

Vaccines are used to treat infection.

...............................

Antibiotics can cure infection caused by bacteria.

Vaccines cannot cure infection caused by bacteria.

...............................

3b
3 marks

Smallpox was an infectious disease caused by a virus. An estimated 300 million people worldwide died from smallpox during the 20th Century. The last naturally occurring case was diagnosed in October 1977 and the World Health Organization certified the global eradication of the disease in 1980.

The global eradication was considered to have occurred because the smallpox vaccine was very effective and the programme of vaccination was thorough and worldwide.

However, some authorities dispute the claim that eradication was due to vaccination. They stated that deaths from smallpox were already decreasing in unvaccinated populations and that only 10% of the World's population were vaccinated.

Graphs 8.1, 8.2, 8.3 and 8.4 show data for four diseases that caused deaths in the UK in the 19th and 20th Centuries. They also show the dates at which vaccines for three of these diseases were introduced.

Graph 8.1

![Figure: line graph, "Deaths per million" from smallpox, x-axis years 1860-1930, showing a line with markers for "Mandatory vaccination enforced" and "Mandatory vaccination repealed"]

Graph 8.2

![Figure: line graph, "Deaths per million" from polio, x-axis years 1950-1964, with markers for "Vaccine introduced" and "Cases of polio caused by vaccine"]

Graph 8.3

![Figure: line graph, "Deaths per million" from diphtheria, x-axis years 1910-1970, with a marker for "Vaccine introduced"]

Graph 8.4

![Figure: line graph, "Deaths per million" from typhoid fever, x-axis years 1890-1960]

Note: Mandatory vaccination enforced means that by law people had to be vaccinated against smallpox.

Mandatory vaccination repealed means that people were no longer legally required to be vaccinated against smallpox.

Using only the information in Graphs 8.1, 8.2, 8.3 and 8.4, explain how they could be used as evidence both for and against the use of vaccination.

4a
2 marks

MMR is a safe and effective vaccine that protects against measles, mumps and rubella. These diseases are caused by viruses.

[Figure: Photograph showing a child receiving the MMR vaccine]
  • The full course of MMR vaccination requires two doses; a child has the first injection at the age of one year and the second at three years.

  • If the child comes into contact with any of these viruses in the future, lymphocytes in the blood will rapidly cause the destruction of these viruses and the child will not become ill.

  • A small number of children may get minor side effects due to the vaccine.

Use this information and your own knowledge to complete the following table by writing True or False against each statement.

Statement

True or False

Measles is caused by a bacterium.

False

The MMR vaccine is given as drops on the tongue.

......................................................................

Most children do not get side effects.

......................................................................

Lymphocytes are a type of white blood cell.

......................................................................

4b
1 mark

Predict what would happen to the number of cases of measles, mumps and rubella if fewer children were given the MMR vaccine.

4c
3 marks

Graph 5.1 shows the percentage of children receiving the MMR vaccine in the UK between 1989 and 2018. It is the target of any UK vaccination programme to get at least 95% of children vaccinated.

In 1998, a report was published which claimed that there was a link between the MMR vaccine and a condition called autism. The report was later shown to be completely untrue.

Graph 5.1

[Figure: Graph 5.1 — a line graph of the percentage of children vaccinated (65%–100%) against year (1990–2015), showing a 95% target line, a marker for when the MMR vaccine was introduced, and a marker for the date of the (1998) report]

(i) State the year the percentage of children receiving the MMR vaccine was closest to the UK target.

...................................................................................................

[1]

(ii) State a conclusion that could be made about the success of the MMR vaccination programme between 1990 and 1993.

[1]

(iii) The percentage of children vaccinated decreased after the report was published. Suggest the reason for this.

[1]

5
6 marks

Image 8.1 shows the structure of a bacterium and a virus.

Image 8.1

[Figure: Image 8.1 — a bacterium (about 1000 nm) with cell membrane, cytoplasm, genes, cell wall and flagellum labelled, and a virus (about 20 nm) with genes and a protein coat labelled]

Use all the information given to describe the similarities and differences between the structure of the bacterium and the virus.

6a
2 marks

The diagram shows a pathogen that causes an infectious disease.

[Figure: Diagram of a pathogen showing labelled structures: genes, antigens, and protein coat]

(i) State the type of pathogen shown above.

.................................................................................................................................

[1]

(ii) Sudden changes to a gene cause changes to the antigens on the coat of the pathogen.

State the term for a sudden change to a gene.

.................................................................................................................................

[1]

6b
1 mark

State one way by which pathogens are spread between people.

6c
3 marks

The following statements (1–6) describe how the body responds when it is invaded by pathogens. The statements are not in the correct order.

  1. The pathogens have foreign antigens

  2. Pathogens enter the blood

  3. They respond by releasing antibodies to the antigens

  4. The antibodies attach to the pathogen

  5. The antigens are recognised as foreign by lymphocytes

  6. The attached antibodies help phagocytes destroy the pathogen

Complete the sequence to put the statements in the correct order.

.............. .........1..... .............. ........3...... .............. ..............

7a
2 marks

Image 5.1 shows a white blood cell which is ingesting micro-organisms in the bloodstream of a person.

Image 5.1

[Figure: Image 5.1 — a white blood cell shown engulfing several micro-organisms in the bloodstream]

(i) State the type of white blood cell shown.

...................................................................................................

[1]

(ii) Suggest what will happen to the micro-organisms after they have been ingested by the white blood cell.

[1]

7b
7 marks

A person was vaccinated against an infectious disease caused by a virus. Graph 5.2 shows the concentration of antibodies in the blood of the person over the next 90 days.

Graph 5.2

[Figure: Graph 5.2 — antibody concentration (arbitrary units, 0–7) plotted against time (days, 0–90), with vaccination marked at day 0, a slow rise in antibody concentration over the first 20 days, then a plateau, then a very rapid rise between days 45 and 65 marked with a point X, followed by a decline]

(i) Explain the increase in antibody concentration over the first 20 days.

[3]

(ii) Give two possible reasons that could account for the increase in antibody concentration from point X on Graph 5.2.

1.

2.

[2]

(iii) State the name of the cell that is responsible for the very rapid antibody production between days 45 and 65.

...................................................................................................

[1]

(iv) State the scientific term which could be used to describe this person in relation to the virus after day 65.

...................................................................................................

[1]

7c
3 marks

MMR is a 3-in-1 vaccine that protects people against measles, mumps and rubella. Children should be fully vaccinated against these three diseases by school age.

In 1998, a British doctor published the results of his research in a medical journal. His work stated that there was a link between the MMR vaccine and a condition called autism. The General Medical Council found the work published by the doctor to be “dishonest” and the doctor was struck off the UK medical register. Unfortunately, before the work was discredited, it had been picked up by the media and spread across the World.

Graph 5.3 shows the percentage of school-age children who had received the MMR vaccine in England and Wales between 1996 and 2010.

Graph 5.3

[Figure: Graph 5.3 — a bar chart of MMR vaccine coverage (%, 72–94) against year (1996–2010), showing coverage falling from around 92% in 1996 to a low around 80% in the early-to-mid 2000s before recovering]

(i) From Graph 5.3, state the effect the published work linking MMR vaccination with autism had on the percentage of children receiving the MMR vaccine.

[1]

(ii) Sketch a single line on Graph 5.3, extending between 1996 and 2010, to show the effect the published work linking MMR vaccination with autism would have had on the number of cases of measles in England and Wales. No labels or numbers are required.

[2]

8a
3 marks

The diagram shows a bacterial cell.

[Figure: Diagram of a bacterial cell with three unlabelled structures marked A, B, and C for the candidate to identify]

Label structures A, B and C on the diagram above.

A ..........................................................

B ...........................................................

C ..........................................................

8b
4 marks

Carys wanted to investigate the effect of an antibiotic on bacterial growth. She set up the experiment shown below with test tubes containing increasing concentrations of an antibiotic and inoculated each test tube with a fixed volume of nutrient broth containing a known concentration of bacteria.

The tubes were incubated at 25 °C for two days. The cloudier the solution becomes the more bacteria present. A clear sample means there is no bacterial growth.

[Figure: Six test tubes showing the results of the antibiotic investigation — tubes 1-3 show cloudy solution and tubes 4-6 show clear solution]

Tube number

1

2

3

4

5

6

Concentration of antibiotic (µg/cm3)

0.25

0.50

1.00

2.00

4.00

8.00

(i) Explain the result observed in tubes 4–6.

[1]

(ii) Suggest the minimum concentration of antibiotic that would be effective against the bacterium.

minimum concentration = ........................... µg/cm3

[1]

(iii) Suggest how Carys could improve her experiment so that she could obtain a more accurate value for the minimum concentration of antibiotic needed to be effective against the bacterium.

[2]

9a
2 marks

Thalidomide is a medical drug that caused unexpected damage to foetuses in the 1950s and 1960s. It was used for easing morning sickness in pregnant women, although it had not been fully tested.

As a result of the damage to foetuses, the drug was banned. Drug testing was also made more thorough.

Thalidomide has since been used as a treatment for bone cancer. However, its use is heavily regulated to prevent a repeat of the problems it caused last century.

With thalidomide came the widespread recognition that differences in sensitivity to drugs between species required consideration. Many scientists report that animals are good predictors of how humans will respond to drugs and that current testing procedures would have identified the dangers of thalidomide and the side effects would have been avoided.

Despite this, there is evidence that animal tests cannot predict how humans will respond to a drug. In 1990, six different drugs were trialled in humans and in animals. The results showed that animals and humans had 22 common side effects (true positives). There were 48 side effects in animals which did not occur in humans (false positives). There were also 20 side effects in humans that did not occur in animals (false negatives).

The sensitivity of the animal tests is calculated using the formula:

Sensitivity=TPTP+FN×100

TP = true positives

FN = false negatives

Calculate the sensitivity of the animal tests in the trial carried out in 1990.

Sensitivity = ....................................... %

9b
4 marks

Use only the information in the passage to answer the following questions.

(i) Evaluate the arguments for and against the use of animals in drug testing.

[2]

(ii) State how the thalidomide problem has had one positive outcome on the development of new drugs.

[1]

(iii) State why the ban on thalidomide was removed.

[1]

10a
3 marks

The photograph shows bacteria called E. coli.

[Figure: Micrograph photograph of E. coli bacteria]

Bacteria such as E. coli can be pathogens.

(i) State the meaning of the term pathogen.

[1]

(ii) Describe two ways in which pathogens are spread from person to person.

[2]

10b
2 marks

Bacterial infections may be treated by antibiotics.

(i) State the name of one antibiotic.

.................................................................................

[1]

(ii) Which one of the following results from the over use of antibiotics?

Underline the correct answer.

People become immune to antibiotics

People become resistant to antibiotics

Bacteria become immune to antibiotics

Bacteria become resistant to antibiotics

[1]

11a
3 marks

The diagram below shows how a lymphocyte responds to the presence of antigens in the body.

[Figure: Diagram showing foreign antigens encountered for the first time, leading via a blood vessel to a clone of lymphocytes which secrete antibodies, and a clone of memory cells which remain as memory cells]

Explain how the body responds to a foreign antigen the first time it is encountered and why the response is faster when the same antigen is encountered a second time.

11b
2 marks

Measles is a communicable disease. The diagram shows two populations of people, during an outbreak of the measles virus.

[Figure: Diagram showing two populations at the start and during an outbreak of measles. A key distinguishes: not vaccinated but still healthy; vaccinated and healthy; not vaccinated, sick and able to spread disease. Population 1 (not vaccinated) shows many people becoming sick during the outbreak; Population 2 (vaccinated) shows most people remaining healthy]

Using only the diagram above, explain the advantage of a vaccination programme.