13 marks

The diagram shows the graph of a function.
By drawing a suitable tangent, find an estimate for the gradient of the function at the point P.
Was this exam question helpful?
Exam code: 0580 & 0980
The diagram shows the graph of a function.
By drawing a suitable tangent, find an estimate for the gradient of the function at the point P.
Was this exam question helpful?

i) Draw the tangent to the curve at .
[1]
ii) Use your tangent to estimate the gradient of the curve at .
[2]
Write down the equation of your tangent in the form .
.................................................
Was this exam question helpful?

By drawing a suitable tangent, estimate the gradient of the curve at the point P.
Was this exam question helpful?
The graph of for is drawn on the grid.
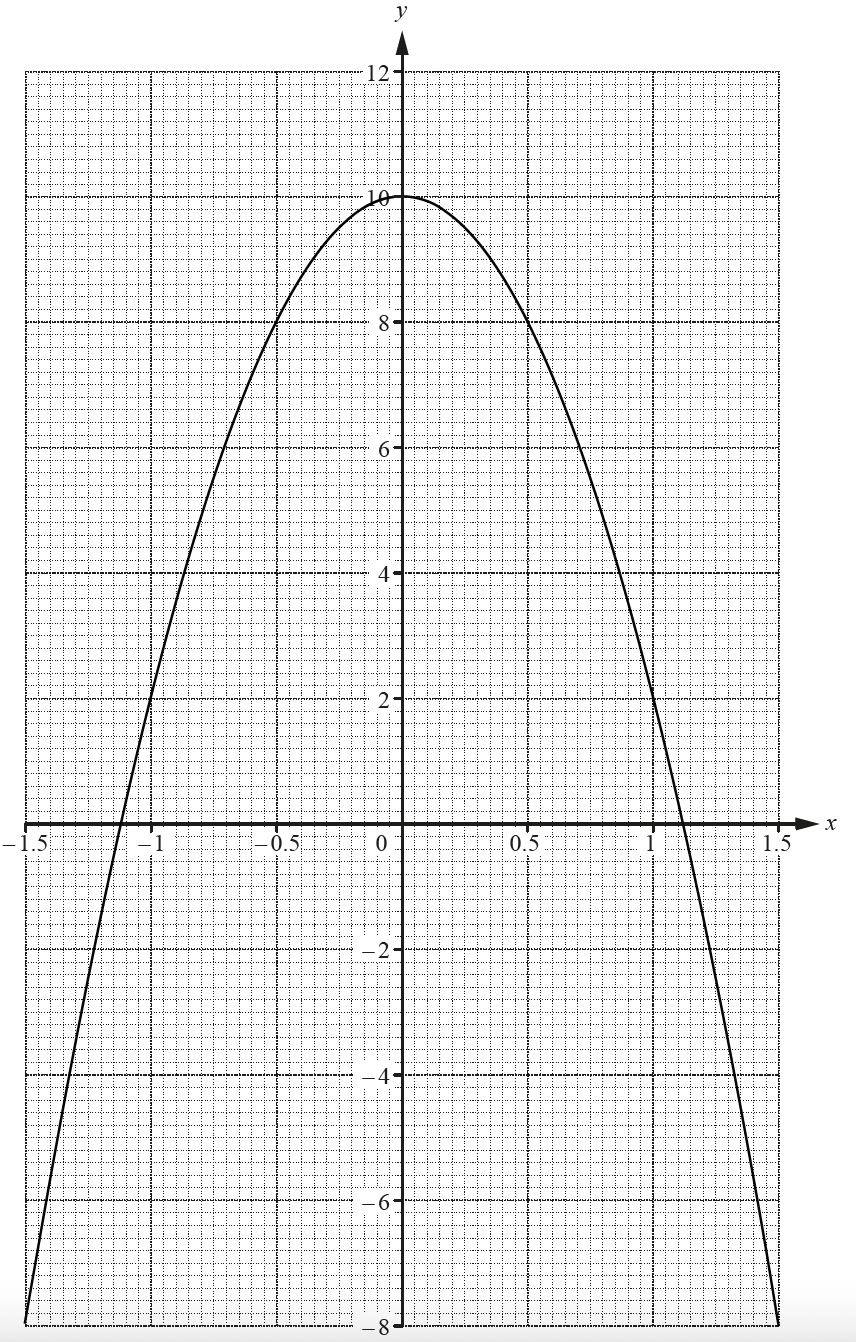
Write down the equation of the line of symmetry of the graph.
On the grid, draw the tangent to the curve at the point where .
Find the gradient of this tangent.
Was this exam question helpful?
The diagram shows part of the graph of

By drawing a suitable straight line, use your graph to find estimates for the solutions of
P is the point on the graph of where
Calculate an estimate for the gradient of the graph at the point P.
Was this exam question helpful?
Complete the table of values for
x | -3 | -2 | -1 | 0 | 1 | 2 | 3 |
y | 6 |
|
| -6 |
|
|
|
On the grid, draw the graph of for values of from to

Use your graph to find estimates of the solutions to the equation
Was this exam question helpful?
Complete the table of values for
x | -2 | -1 | 0 | 1 | 2 | 3 | 4 |
y |
| 3 | 0 |
|
| 3 |
|
On the grid, draw the graph of y = x2 – 2x for values of x from –2 to 4

Solve
Was this exam question helpful?
Complete the table.
0.2 | 0.3 | 0.5 | 1 | 1.5 | 2 | 2.5 | |
5.0 | 3.4 | 2.3 |
| 2.9 |
| 6.7 |
On the grid, draw the graph of for
The graph of for has been drawn for you.

By drawing suitable straight lines on the grid, solve the following equations.
i)
................................................ [1]
ii)
................................................ [2]
is an integer and the equation has three solutions. Write down a possible value of .
................................................
Was this exam question helpful?
The table shows some values of , .
| ||||||||||||
|
|
|
|
Complete the table.
On the grid, draw the graph of for and .

Use your graph to solve .
..................... ....................
Find the smallest positive integer value of for which has two solutions for and .
By drawing a suitable straight line, solve for and .
= ...................................................
Was this exam question helpful?
The table shows some values for .
|
|
|
Complete the table.
On the grid, draw the graph of for .

Use your graph to solve the equation .
= ..................... or = ..................... or = .....................
By drawing a suitable tangent, find an estimate of the gradient of the curve at .
Write down the largest value of the integer, , so that the equation has three solutions for .
= ..................................................
Was this exam question helpful?
The table shows some values for for .
-3 | -2 | -1.5 | -1 | 0 | 1 | 1.5 | 2 | 3 | |
|
| 2.0 | 1.7 | 0 |
| -2.0 | -1.6 |
|
Complete the table.
On the grid, draw the graph of for .

On the grid, draw a suitable straight line to solve the equation for
....................... or ....................... or ......................
For , the equation has solutions. Write down the value of .
..................................................
Was this exam question helpful?
The table shows some values of .
-0.75 | -0.5 | -0.25 | 0 | 0.5 | 1 | 1.5 | 2 | 2.5 | 2.75 | |
-2.9 | -1.4 | -0.5 |
| -0.1 | -1 | -1.9 |
| -0.6 |
|
Complete the table.
On the grid, draw the graph of for .

Use your graph to complete the inequalities in for which .
.................... .................... and ....................
The equation can be solved by drawing a straight line on the grid.
i) Write down the equation of this line.
[2]
ii)On the grid, draw this line and use it to solve the equation .
= ............................................... [3]
By drawing a suitable tangent, find an estimate for the gradient of the graph of at .
Was this exam question helpful?
Complete the table of values for .
| |||||||||||
|
|
|
|
On the grid, draw the graph of for and .

i) By drawing a suitable tangent, find an estimate of the gradient of the curve at .
[3]
ii) Write down the equation of the tangent to the curve at . Give your answer in the form .
................................................ [2]
Use your graph to solve the equations.
i)
................................................ [1]
ii)
.................... or .................... or .................... [3]
Was this exam question helpful?
The table shows some values of for
0.15 | 0.2 | 0.5 | 1 | 1.5 | 2 | 2.5 | 3 | 3.5 | |
3.30 |
| 0.88 |
| -0.04 |
| -0.43 | -0.58 | -0.73 |
Complete the table.
On the grid, draw the graph of for The last two points have been plotted for you.

Use your graph to solve the equation for
= ..............................................
i) On the grid, draw the line
[2]
ii) Write down the x co-ordinates of the points where the line crosses the graph of for .
= .................... and = .................... [2]
Show that the graph of can be used to find the value of for
Was this exam question helpful?
The diagram shows the graph of where .

On the grid, draw a suitable straight line to solve the equation for .
= ...................... or = ..........................
By drawing a suitable tangent, find an estimate of the gradient of the curve at .
i) Complete the table for where for .
-3 | -2 | -1 | 0 | 1 | 2 | 3 | |
|
| 2 | 1 | 0.5 |
| 0.125 |
[3]
ii) On the grid, draw the graph of .
[3]
iii) Use your graph to find the positive solution to the equation .
= .............................................. [1]
Was this exam question helpful?
The graph of for is drawn on the grid.
And the table shows some values for .
|
|
|
i) Complete the table.
[3]
ii) On the grid, draw the graph of for .
[4]
Show that the values of where the two curves intersect are the solutions to the equation .
By drawing a suitable straight line, solve the equation for .
..............................................
Was this exam question helpful?
The table shows some values for for
0.125 | 0.25 | 0.375 | 0.5 | 0.75 | 1 | 1.5 | 2 | 2.5 | 3 | |
5.25 | 1.5 | 0.42 |
|
| 0 | 0.67 | 1.5 |
| 3.33 |
Complete the table.
On the grid, draw the graph of for

Use your graph to solve
................................................. .................................................
The equation can be solved using your graph in part (b) and a straight line.
i) Write down the equation of this straight line.
[2]
ii) Draw this straight line and solve the equation
.................... or .................... [3]
Was this exam question helpful?