Variation Models (Cambridge (CIE) IGCSE International Maths: Extended): Revision Note
Exam code: 0607

Variation Models
What is a variation model?
A variation, or proportion, model describes how one quantity varies with another
For example:
is a linear variation model and shows direct proportion
is a quadratic variation model
is a cubic variation model
is a reciprocal variation model and shows inverse proportion
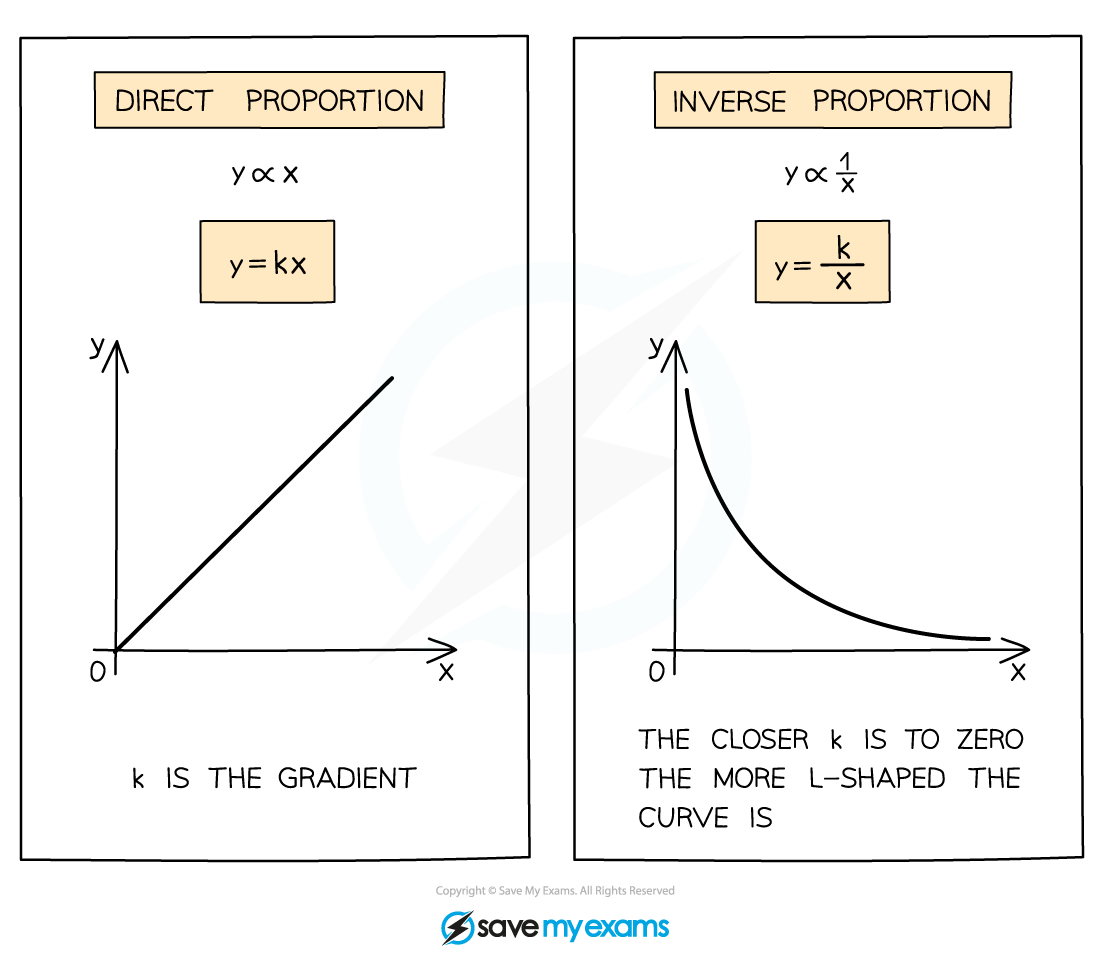
How do I use a variation model to find missing data values?
The equation of a variation model is an equation of a curve or line that models a set of data
Substitute in the x-values to find the y-values (or the other way around)
If you are not given the equation, you may have to find it using the data given
E.g. If you are told the model is linear, you can substitute a known pair of x and y values into to find
You can then use the full equation to find any missing values
Worked Example
Consider the following table of data.
1 | 3 | ||
36 | 9 |
Given that is inversely proportional to , find the values of and .
As is inversely proportional to we can write the equation
Substitute the pair of known values into the equation to find
So the full equation of the variation model is
Substitute in to find
Substitute in to find
How do I identify the best variation model for given data?
You may be asked to select the most suitable variation model for given data
Using the data to sketch a rough graph is one way to do this
You could do this on your graphic display calculator
E.g. a U-shaped graph could suggest a quadratic variation model,
If you are given a suggested variation model (or must choose the most suitable from several) you should test the values using the given data
Substitute the value of x into the suggested model, and see how close the result is to the actual value of y in the table
Do this for at least 3 data points
You will then be able to judge if the suggested model is appropriate, or select the best one
Worked Example
Consider the data in the table below.
Decide which out of a linear, quadratic, or cubic variation model would be most suitable for the data, and use this to find an equation for in terms of .
2 | 4 | 6 | |
20 | 80 | 180 |
Start by checking if the model is linear,
Using the first data point to find
Use this to check the second data point
Not close to 80, so not linear
Consider if the model is quadratic,
Use the first data point to find
Use this to check the second data point
It works for the second point, now check the third
Also correct for the third point, so this is an appropriate variation model
A quadratic variation model is suitable
Its full equation is
If a cubic model is tested, , the first point produces the equation but this does not model the other two data points accurately
Worked Example
Two variation models are suggested for the data in the table below.
Model A:
Model B:
5 | 6 | 10 | 15 | |
25 | 15 | 3 | 2 |
Determine which variation model is more suitable.
Add a row to the table for each of the suggested models
Use the same given values of (5, 6, 10, 15) to calculate the values that each model predicts
E.g. To find the value that model A predicts for
5 | 6 | 10 | 15 | |
25 | 15 | 3 | 2 | |
| 16 | 11.111... | 4 | 1.777... |
Model B: | 6.4 | 3.703... | 0.8 | 0.237... |
Compare the modelled values to the actual values
The values for Model A are much closer to the actual values than Model B
Model A is more suitable

Unlock more, it's free!
Join the 100,000+ Students that ❤️ Save My Exams
the (exam) results speak for themselves:

Was this revision note helpful?
Build on this topic
