Periods & Amplitudes (Cambridge (CIE) IGCSE International Maths: Extended): Revision Note
Exam code: 0607

Periods & Amplitudes
What are oscillating graphs?
The sine and cosine graphs are oscillating graphs
Both graphs oscillate between a maximum and a minimum point
A cycle is completed when the graph returns an initial starting point
The cycle is repeated indefinitely in both the positive and negative x directions
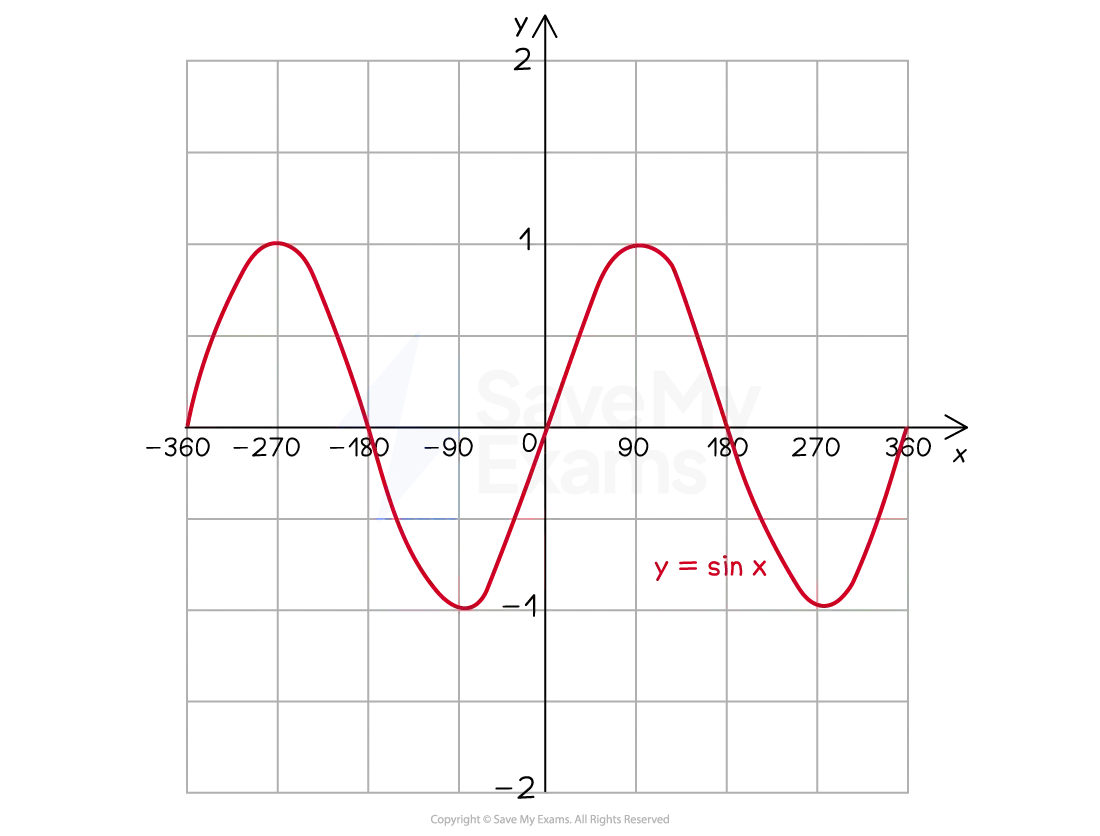
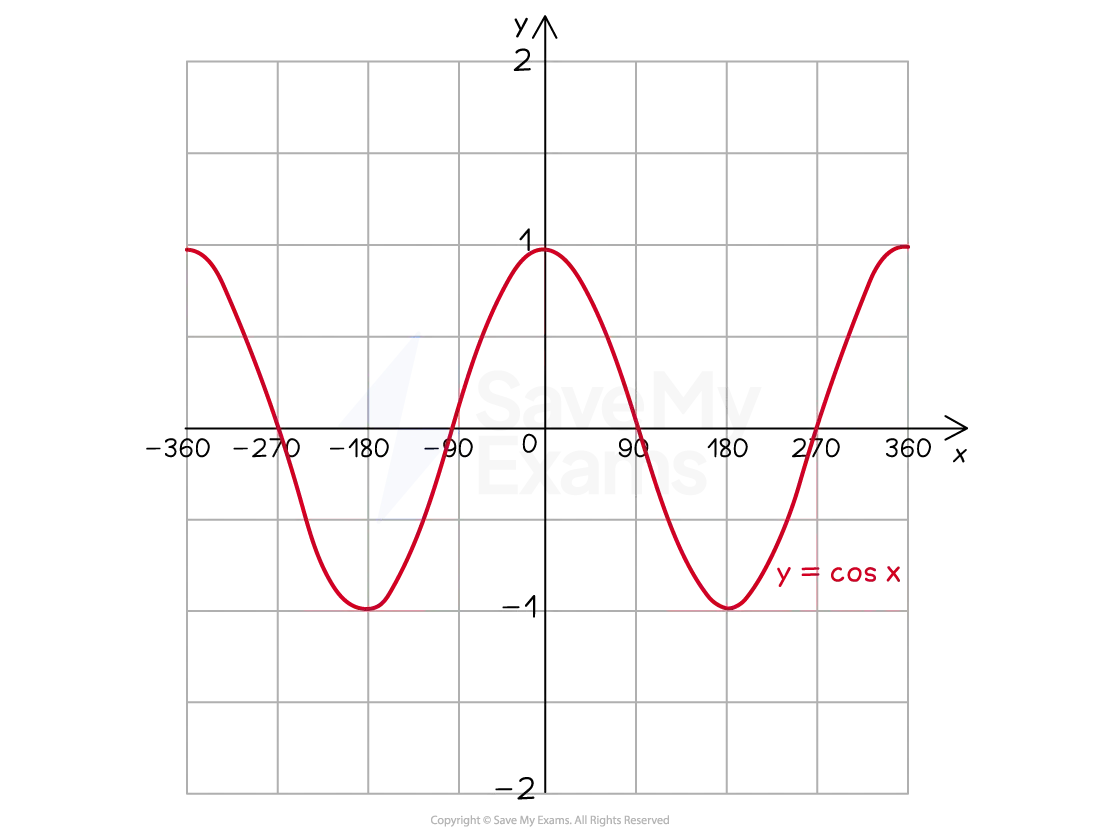
What are the features of oscillating graphs?
An oscillating graph has the following key features:
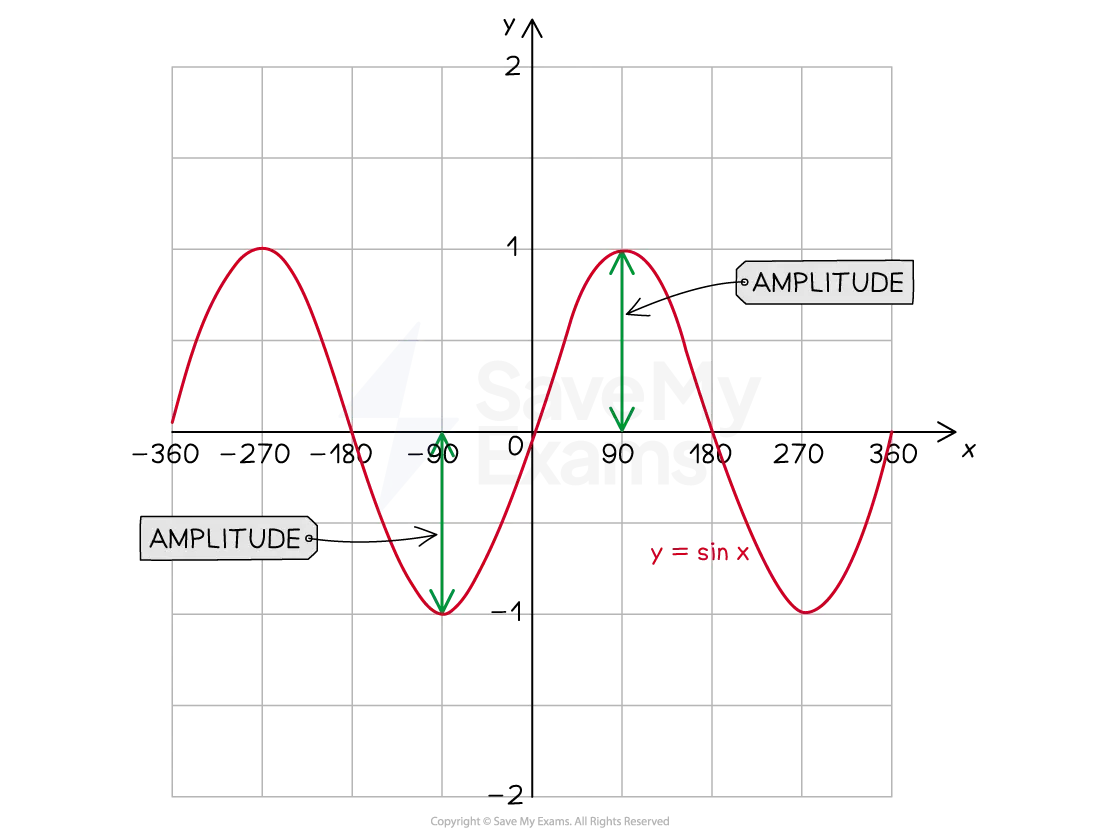
The amplitude is half the vertical distance from the maximum point to the minimum point
This is the distance from the
horizontal line of symmetry (often the x-axis) to the minimum or maximum point
E.g. For the graph the amplitude is 1
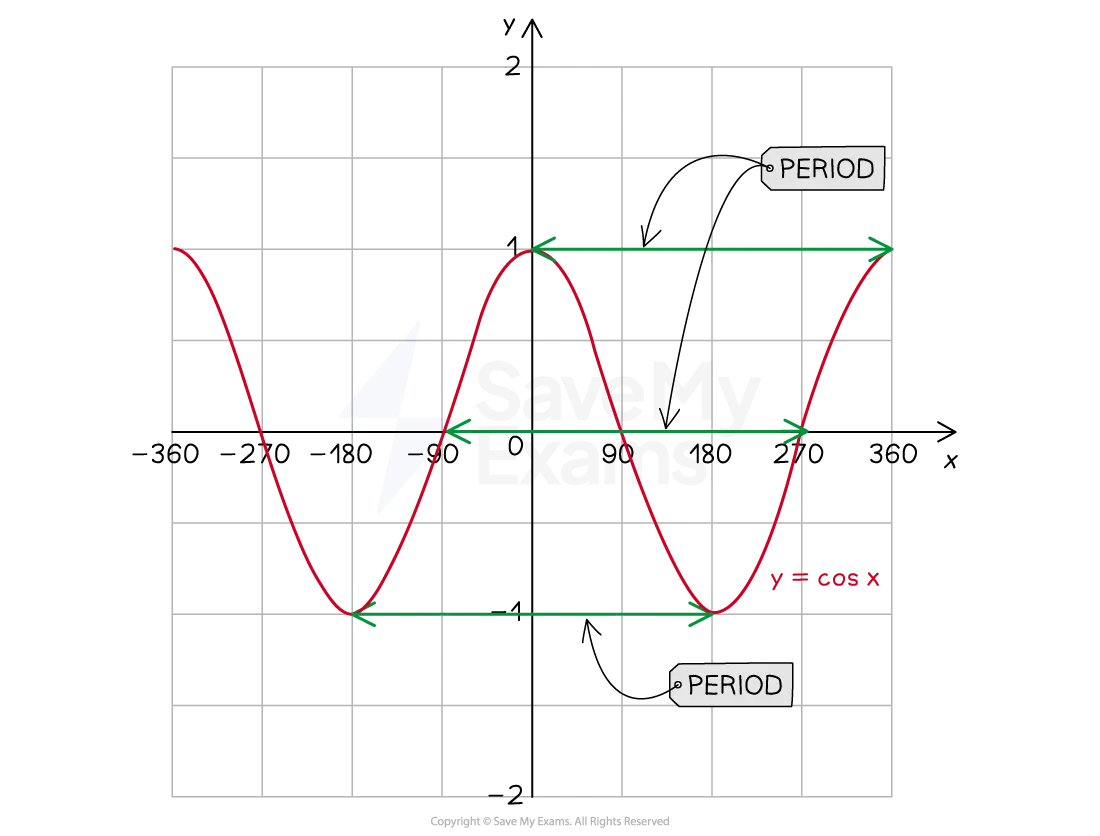
The period is the distance along the x-axis to complete a full oscillation
Maximum point to maximum point
Minimum point to minimum point
x-intercept to next but one x-intercept
E.g. For the graph the period is 360º
How do I draw an oscillating graph from its equation?
An oscillating function has equation
The represents the amplitude of the function
The bigger the value of the bigger the range of values of the function
E.g. For the graph
The amplitude is 5 units
The distance from the x-axis (horizontal line of symmetry) to the maximum/minimum point would be 5 units
E.g. For the graph
The amplitude is of a unit
The vertical distance from the line to the maximum/minimum point would be of a unit
The determines the period of the function
The bigger the value of the quicker the function repeats a cycle
The period is
A larger value of produces a shorter period
E.g. For the graph
The period is
The graph has been 'squashed' by a factor of 2 horizontally
Two complete cycles will occur in an interval of
E.g. For the graph
The period is
The graph has been 'stretched'
Half a cycle will occur in an interval of
Examiner Tips and Tricks
You can use your graphic display calculator to help you interpret or compare trigonometric graphs
Worked Example
The diagram below shows the graph with equation , where and are integer values.
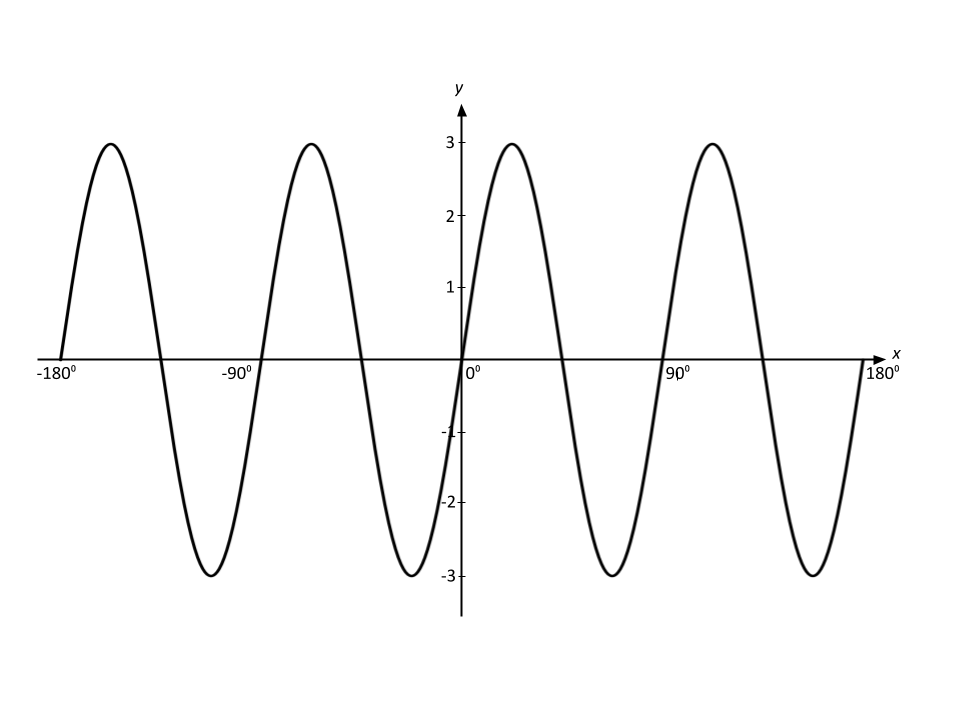
(a) Write down the period.
The graph intersects the x axis at 0, then again at 45º and again at 90º
One full cycle is complete over an interval of 90º
Period = 90º
(b) Write down the amplitude.
The graph goes to a maximum of 3 and a minimum of -3
Amplitude = 3
(c) Write down the values of and .
is the amplitude
The period is
(d) Give a reason as to why the picture cannot be modelled by .
The curve in the diagram goes through the origin
but a curve with equation of the form
would intercept the y-axis at
Any suitable reason as to how a cosine graph is different from a sine graph

Unlock more, it's free!
Join the 100,000+ Students that ❤️ Save My Exams
the (exam) results speak for themselves:

Was this revision note helpful?
Build on this topic
