Interpreting Cumulative Frequency Diagrams (Cambridge (CIE) O Level Maths): Revision Note
Exam code: 4024

Interpreting cumulative frequency diagrams
How do I use and interpret a cumulative frequency diagram?
A cumulative frequency diagram provides a way to estimate key facts about the data
median
lower and upper quartiles (and interquartile range)
percentiles
These values will be estimates as the original raw data is unknown
Cumulative frequency diagrams are used with grouped data
Points are joined by a smooth curve
This means the data is assumed to be smoothly spread out over each interval
How do I find the median, lower quartile and upper quartile from a cumulative frequency diagram?
This is all about understanding how many data values are represented by the cumulative frequency diagram
This may be stated in words within the question
If not, it will be the highest value on the frequency (y-) axis that the curve on the diagram reaches
This should be "top right" of the curve on a cumulative frequency diagram
Finding the median:
STEP 1
Find the position of the median, for data values, this will beThis is different from finding the median from a set of data values
E.g. for a list of 60 data values the median would be halfway between the 30th and 31st values
But for a cumulative frequency diagram it would just be
STEP 2
Draw a horizontal line from on the cumulative frequency (y-) axis until it hits the curveSTEP 3
Draw a vertical line from that point on the curve down to the horizontal (x-) axisThe value where that line hits the horizontal axis will be the median
Finding the lower quartile:
STEP 1
Find the position of the lower quartileFor data values this will be
STEP 2
Draw a horizontal line from on the cumulative frequency axis until it hits the curveSTEP 3
Draw a vertical line from that point on the curve down to the horizontal (x-) axisThe value where that line hits the horizontal axis will be the lower quartile
Finding the upper quartile:
STEP 1
Find the position of the upper quartileFor data values this will be
STEP 2
Draw a horizontal line from on the cumulative frequency axis until it hits the curveSTEP 3
Draw a vertical line from that point on the curve to the horizontal (x-) axisThe value where that line hits the horizontal axis will be the upper quartile
How do I find a percentile from a cumulative frequency diagram?
Percentiles split the data into 100 parts
The 50th percentile is another way of describing the median
The 25th and 75th percentiles are the same as the lower and upper quartiles (respectively)
To find the pth percentile:
STEP 1
Find the position of the pth percentileFor data values, this will be
So for the 10th percentile () with 60 data values ()
The position is
STEP 2
Draw a horizontal line from on the cumulative frequency axis until it hits the curveSTEP 3
Draw a vertical line from that point on the curve down to the horizontal (x-) axisThe value where that line hits the horizontal axis will be the pth percentile
Worked Example
A company is investigating the length of telephone calls customers make to its help centre.
The company randomly selects 100 phone calls from a particular day.
The results are displayed in the cumulative frequency diagram below.
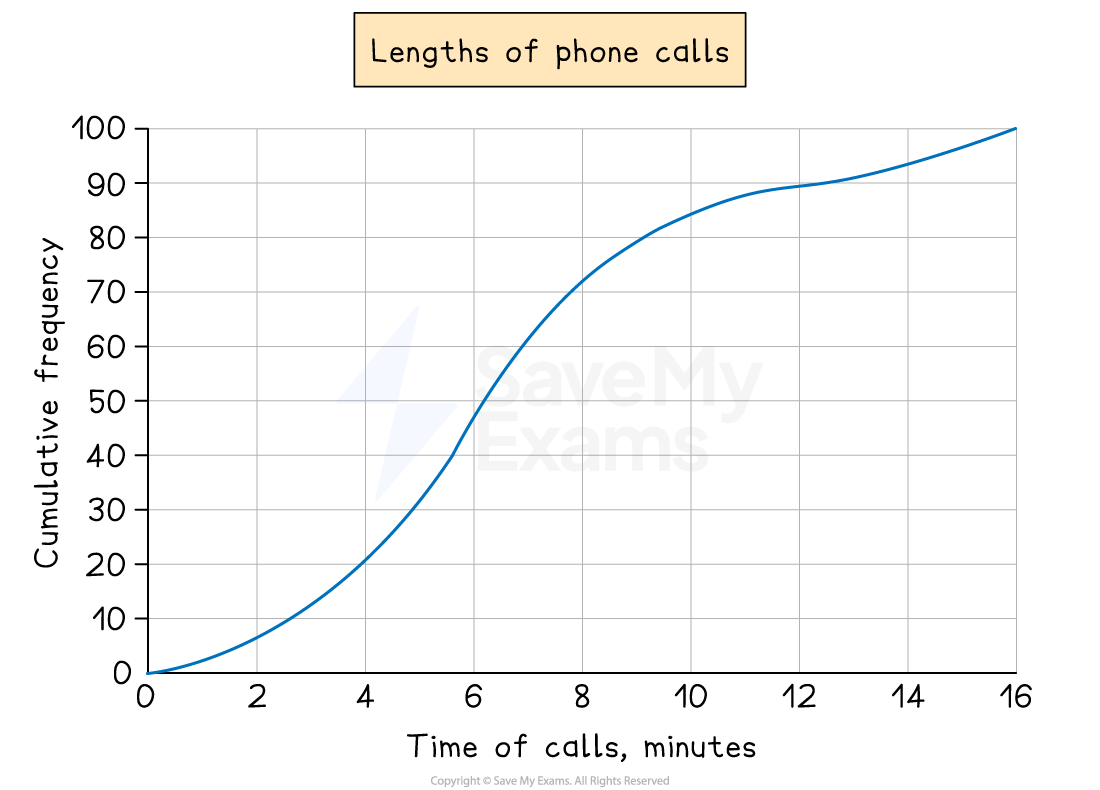
(a) Estimate the median, the lower quartile and the upper quartile.
Answer:
There are 100 pieces of data, so
So the median is the 50th value
The lower quartile is the 25th value
The upper quartile is the 75th value
Draw horizontal lines from these on the cumulative frequency axis until they hit the curve
Then draw vertical lines down to the time of calls axis and take readings
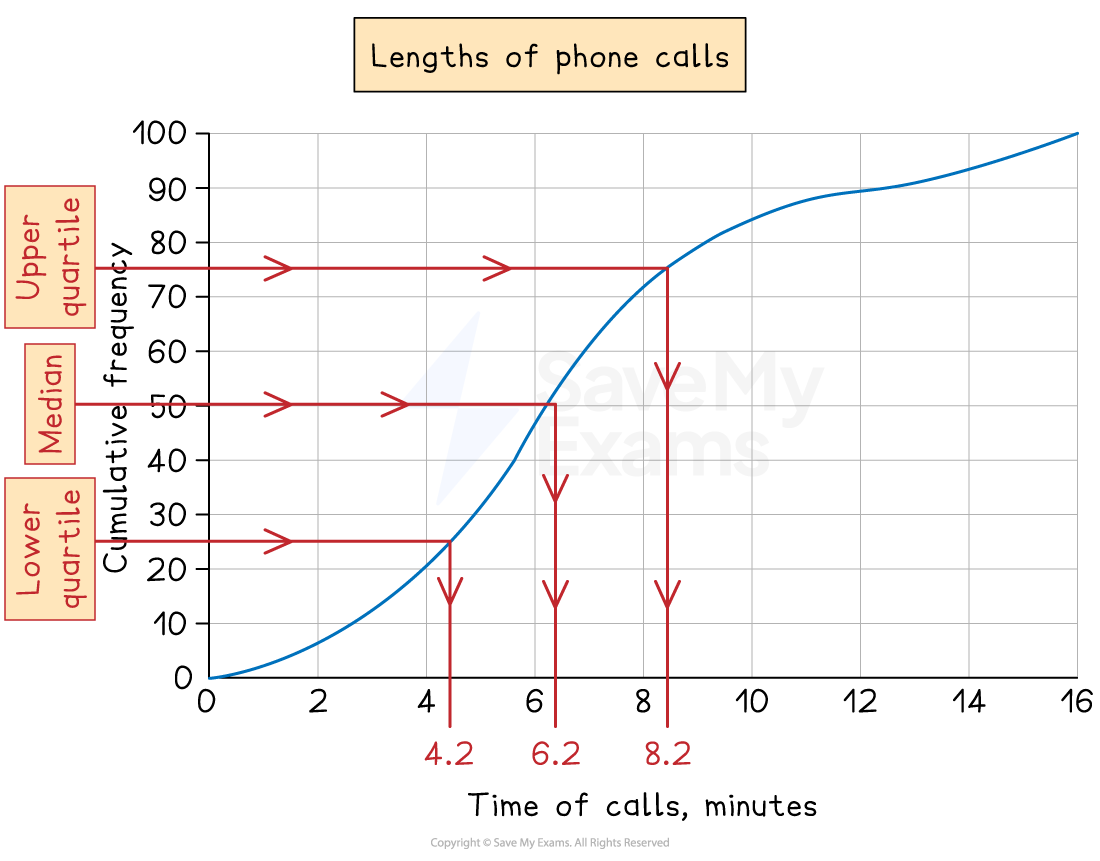
Median = 6.2 minutes (6 m 12 s)
Lower quartile = 4.2 minutes (4 m 12 s)
Upper quartile = 8.2 minutes (8 m 12 s)
There is no need to convert to minutes and seconds unless the question asks you to
However, writing 6 m 2 s or 6 m 20 s would be incorrect
(b) The company is thinking of putting an upper limit of 12 minutes on calls to its help centre.
Estimate the number of these 100 calls that would have been beyond this limit.
Answer:
Draw a vertical line up from 12 minutes on the time of calls axis until it hits the curve
Then draw a horizontal line across to the cumulative frequency axis and take a reading (in this case, 90)
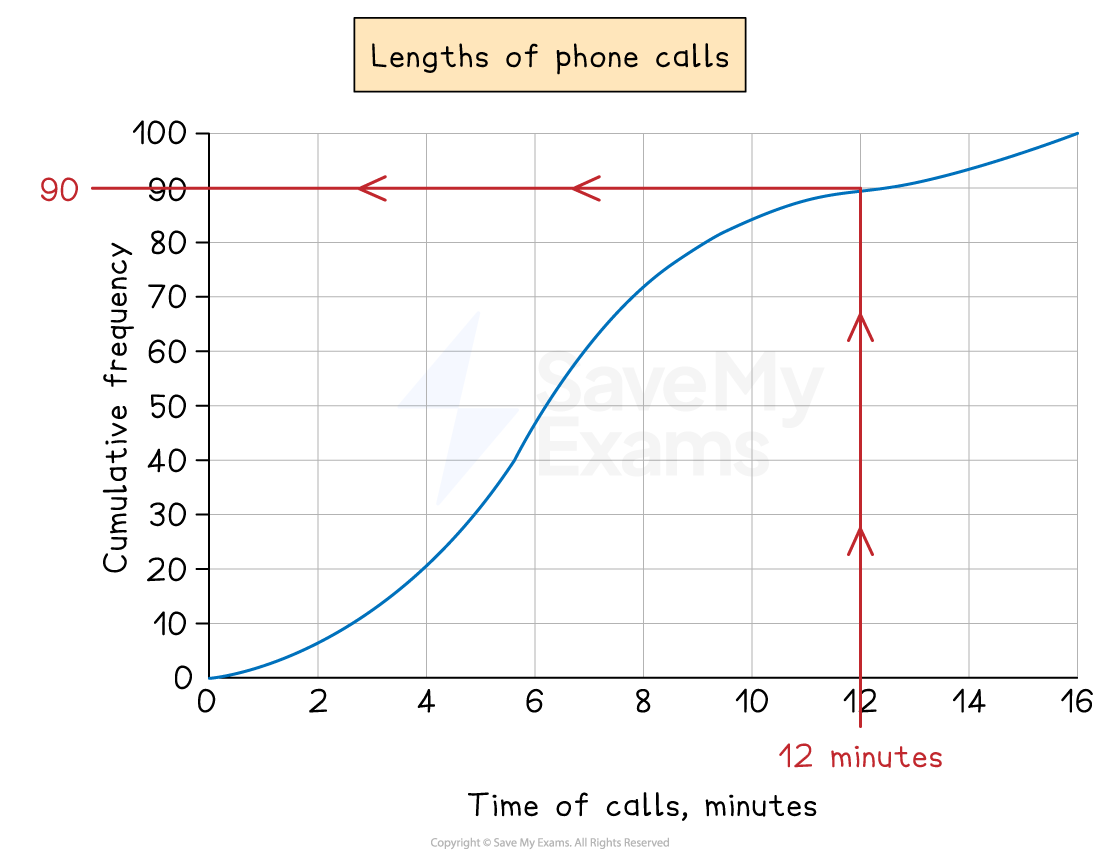
This tells us that up to 12 minutes, 90 of the calls had been accounted for
The question wants the number of calls that were greater than 12 minutes so subtract this from the total of 100
100 - 90 = 10
Approximately 10 (out of 100) calls were beyond the 12 minute limit

Unlock more, it's free!
Join the 100,000+ Students that ❤️ Save My Exams
the (exam) results speak for themselves:

Was this revision note helpful?
Build on this topic
