Bar Charts: Model Answers (IELTS Academic: Writing): Study Material

Bar charts: model answer
Worked Example
You should spend about 20 minutes on this task.
The bar chart shows the number of tourists visiting Rome, Paris and Berlin between 2018 and 2022.
Summarise the information by selecting and reporting the main features, and make comparisons where relevant.
Write at least 150 words.
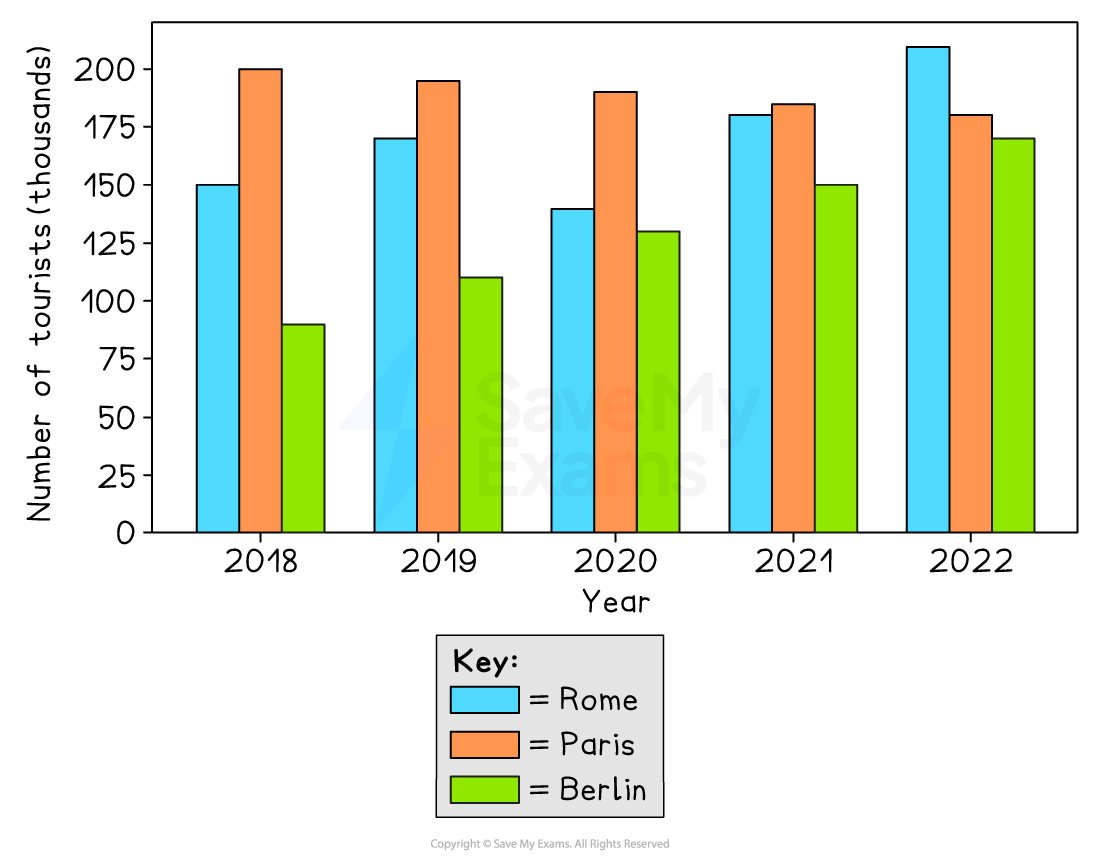
The chart provides information about tourist numbers in three European cities between 2018 and 2022, measured in thousands. Overall, Paris recorded the highest figures at the beginning of the period, whereas Rome became the most visited city by 2022. Berlin had the lowest number of tourists throughout, although its figures increased steadily.
In 2018, Paris had the highest number of visitors at 200 thousand, compared with 150 thousand in Rome and 90 thousand in Berlin. In 2019, Rome rose to 170 thousand, while Paris declined slightly to 195 thousand. Similarly, Berlin increased to around 110 thousand.
From 2020 onwards, Rome saw a significant rise, reaching 180 thousand in 2021 and peaking at 210 thousand in 2022. By contrast, Paris experienced a gradual fall, decreasing from 190 thousand in 2020 to 180 thousand in the final year. Berlin, however, grew steadily over the period, rising from 130 thousand in 2020 to approximately 170 thousand in 2022.
(155 words)
This is a good model answer because:
it paraphrases the task clearly instead of copying the question
there is a clear overview with the main trends
it selects key data only, rather than describing every bar in detail
information is grouped logically across the two body paragraphs
it includes figures to support comparisons
there is a range of grammar and vocabulary used correctly
Sign up now for IELTS Academic
or
Was this study material helpful?