Line Graphs: Model Answers (IELTS Academic: Writing): Study Material

Line graphs: model answer
Worked Example
You should spend about 20 minutes on this task.
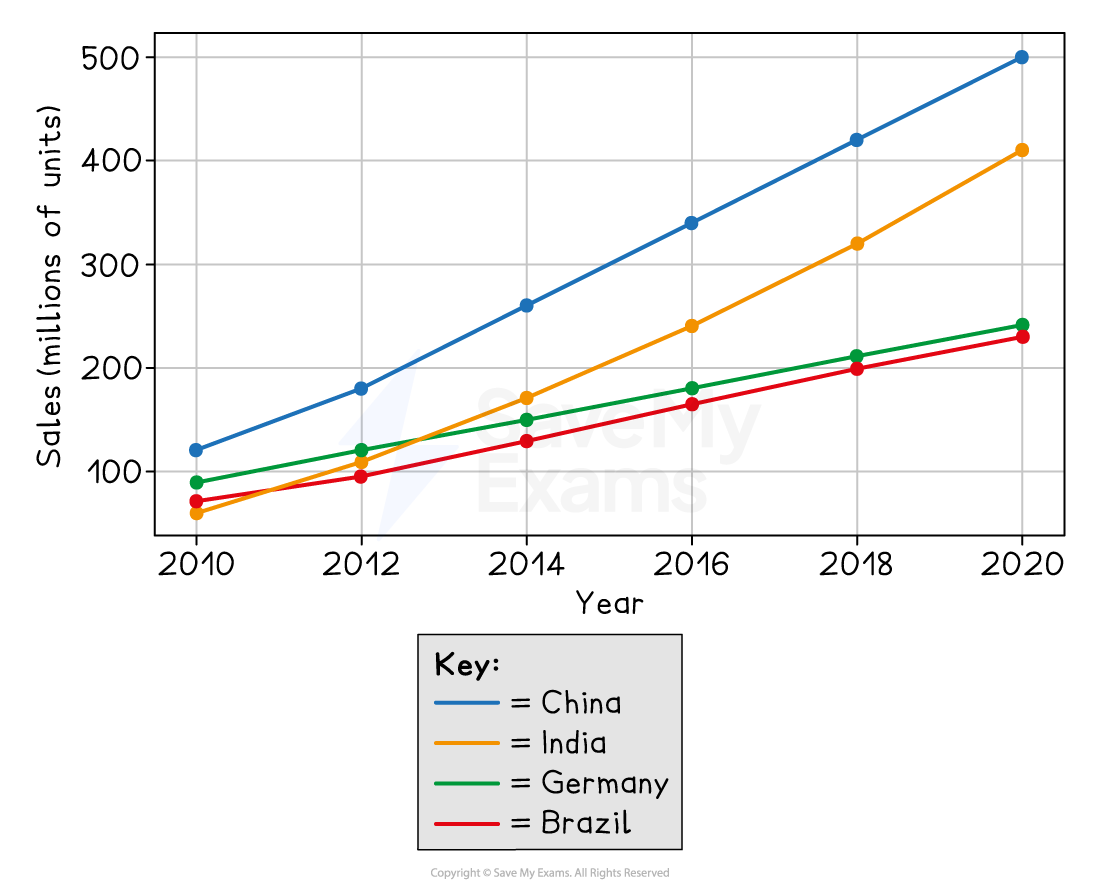
The line graph shows changes in the number of smartphones sold across four countries between 2010 and 2020.
Summarise the information by selecting and reporting the main features, and make comparisons where relevant.
Write at least 150 words.
Answer
The line graph compares smartphone sales in China, India, Germany and Brazil between 2010 and 2020, measured in millions of units. Overall, sales rose in all four countries over the period. China had the highest figures throughout, while India experienced the most dramatic growth.
In 2010, China led the group at 120 million units, followed by Germany at 90 million. Brazil and India had lower figures, at 70 million and 60 million respectively. By 2012, sales had increased in every market, with China reaching 180 million units. At this point, Germany still stood slightly higher than India, at 120 million compared with 110 million.
From 2014 onwards, China and India saw much sharper rises. China’s sales climbed from 260 million to 500 million, while India’s figure more than doubled, rising from 170 million to 410 million. Similarly, Germany and Brazil increased steadily, from 150 to 240 million and from 130 to 230 million respectively.
(154 words)
This is a good answer because:
The introduction paraphrases the task without copying it word by word
The overview highlights the main trends and key comparisons
The body paragraphs use relevant figures to support the description
The data is organised logically in time order and similar trends are grouped together
The answer uses clear, accurate language for changes and comparisons
Sign up now for IELTS Academic
or
Was this study material helpful?