Line Graphs: Introductions & Overviews (IELTS Academic: Writing): Study Material

Line graphs: introductions & overviews
Rephrasing the question
A typical line graph in IELTS Academic Writing Task 1 looks like this:
First, read the task question and look carefully at the information presented in the line graph
Make sure you understand the graph before you start writing the introduction
The introduction usually includes two parts:
An introductory sentence that rephrases the task question (one sentence)
An overview describing the main features of the graph (two sentences)
Your introductory sentence should not copy the task question
You will lose marks in “Task Achievement” if you simply copy the task question
To avoid that, use the task question as your starting point and circle the keywords in it
Think of synonyms for those keywords and use them to paraphrase the task question
Make sure your paraphrase keeps the same meaning as the task question
You do not need to paraphrase every single word (some terms, like “line graph”, can stay the same)
In your introductory sentence, do not include detailed data, describe trends or compare figures
Example of a good introductory sentence
Task question:
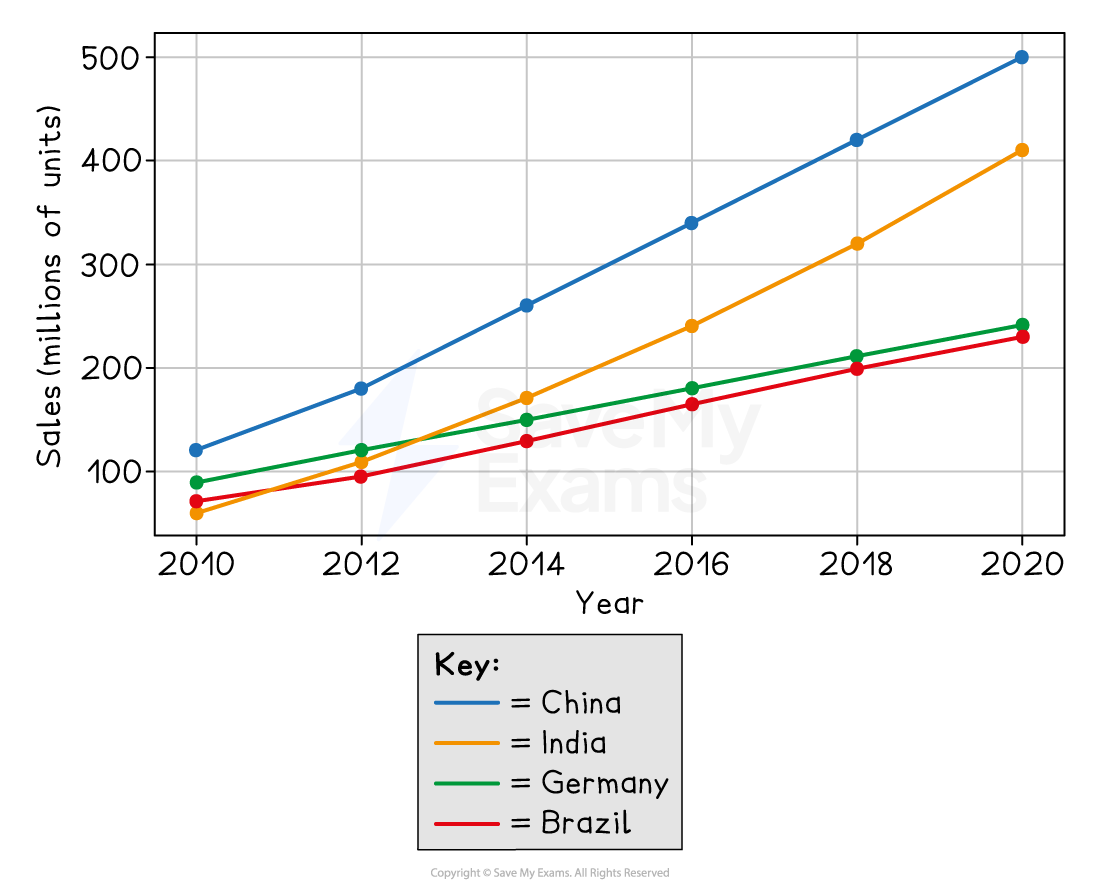
The line graph shows changes in the number of smartphones sold across four countries between 2010 and 2020
A possible introduction:
The line graph compares smartphone sales in China, India, Germany and Brazil between 2010 and 2020, measured in millions of units
Finding the overview
After your first introductory sentence, you need to write the overview
This is the part where you give an overview of the main features shown in the line graphs
Your overview should show that you understand the big picture, so focus on overall trends across the whole graph
Avoid describing small details and minor fluctuations
Try to identify which line or category was generally highest or lowest
Notice any clear increases, decreases, stability or major changes
What you should look for:
Which line(s) rose or fell overall
Which line(s) stayed fairly stable
Whether two lines moved in similar or different ways
Whether one category remained higher or lower than the others for most of the period
Any noticeable comparisons between lines
Example of a good overview
Task question:
The line graph shows changes in the number of smartphones sold across four countries between 2010 and 2020
A possible overview:
Overall, sales rose in all four countries over the period. China had the highest figures throughout, while India experienced the most dramatic growth
Examiner Tips and Tricks
You do not need to include numbers in the overview. You can do that in the body paragraphs
Sign up now for IELTS Academic
or
Was this study material helpful?