Pie Charts: Model Answers (IELTS Academic: Writing): Study Material

Pie charts: model answer
Worked Example
You should spend about 20 minutes on this task.
The pie charts show teenagers’ favourite movie types in the UK, divided by gender.
Summarise the information by selecting and reporting the main features, and make comparisons where relevant.
Write at least 150 words.
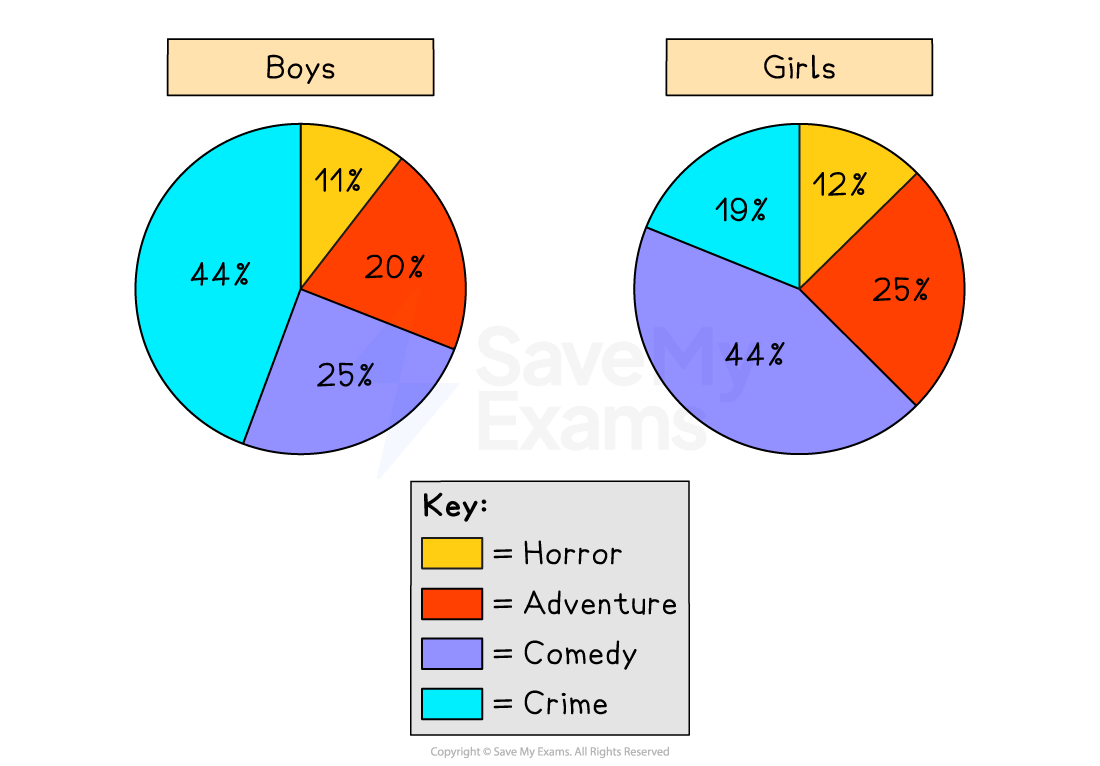
The charts compare the preferences of teenage boys and girls in the UK regarding different movie genres. Overall, crime and comedy were the most popular types of film among teenagers, whereas horror accounted for the smallest share in both groups.
In terms of the most popular categories, boys showed a clear preference for crime films, which made up 44% of their choices, compared with just 19% among girls. By contrast, comedy was far more popular with girls, accounting for 44%, while only 25% of boys preferred this genre. These figures show an opposite pattern in the two groups.
Looking at the remaining categories, adventure films were moderately popular among both genders, although girls recorded a slightly higher figure at 25%, compared with 20% for boys. Similarly, horror was the least preferred genre in both groups, representing 11% of boys and 12% of girls. Together, these two categories made up noticeably smaller proportions than crime and comedy.
(156 words)
This is a good model answer because it:
Follows a logical structure
Introduction (paraphrase + overview)
Two body paragraphs covering and comparing categories with figures
No conclusion
Uses varied comparison language that shows a range and avoids repetition
Demonstrates proportion vocabulary
Organises data logically by grouping dominant categories (crime/comedy) first, then smaller categories (adventure/horror)
Meets the required word count of at least 150 words
Sign up now for IELTS Academic
or
Was this study material helpful?