Probability from Venn Diagrams (WJEC GCSE Maths & Numeracy (Double Award): Foundation): Revision Note
Exam code: 3320

Probability from Venn Diagrams
What do the different regions mean on a Venn diagram?
This will depend on how many events there are and how the outcomes overlap
Venn diagrams show ‘AND’ and ‘OR’ statements easily
Venn diagrams also instantly show mutually exclusive events
Independence can be deduced from the probabilities involved


How do I find probabilities from Venn diagrams?
Draw, or add to a given Venn diagram, filling in as many values as possible from the information provided in the question
It is usually helpful to work from the centre outwards
i.e. fill in intersections (overlaps) first
This is particularly crucial with Venn diagrams with three events
the intersection of events A and B may include the intersection of events A, B and C
a question would make it clear if a given frequency or probability is only for events A and B , and not C
Any frequencies or probabilities not given may be able to be calculated from those that are
Use the results from Basic Probability to deduce missing frequencies or probabilities and answer questions
For independent events,
For mutually exclusive events,
Examiner Tips and Tricks
Check a completed Venn diagram that the frequencies sum to the total involved or that probabilities sum to 1.
How do I test for independence in a Venn diagram?
To test if two events A and B are independent events
use the Venn diagram to find
(from the intersection of A and B)
(from adding up all probabilities inside the A circle)
(from adding up all probabilities inside the B circle)
then check if they satisfy
If they do, A and B are independent
Worked Example
At a careers fair, 28 students were asked which types of courses they were interested in.
The results are shown in the Venn diagram below where represents science courses, represents technology courses, and represents art courses.
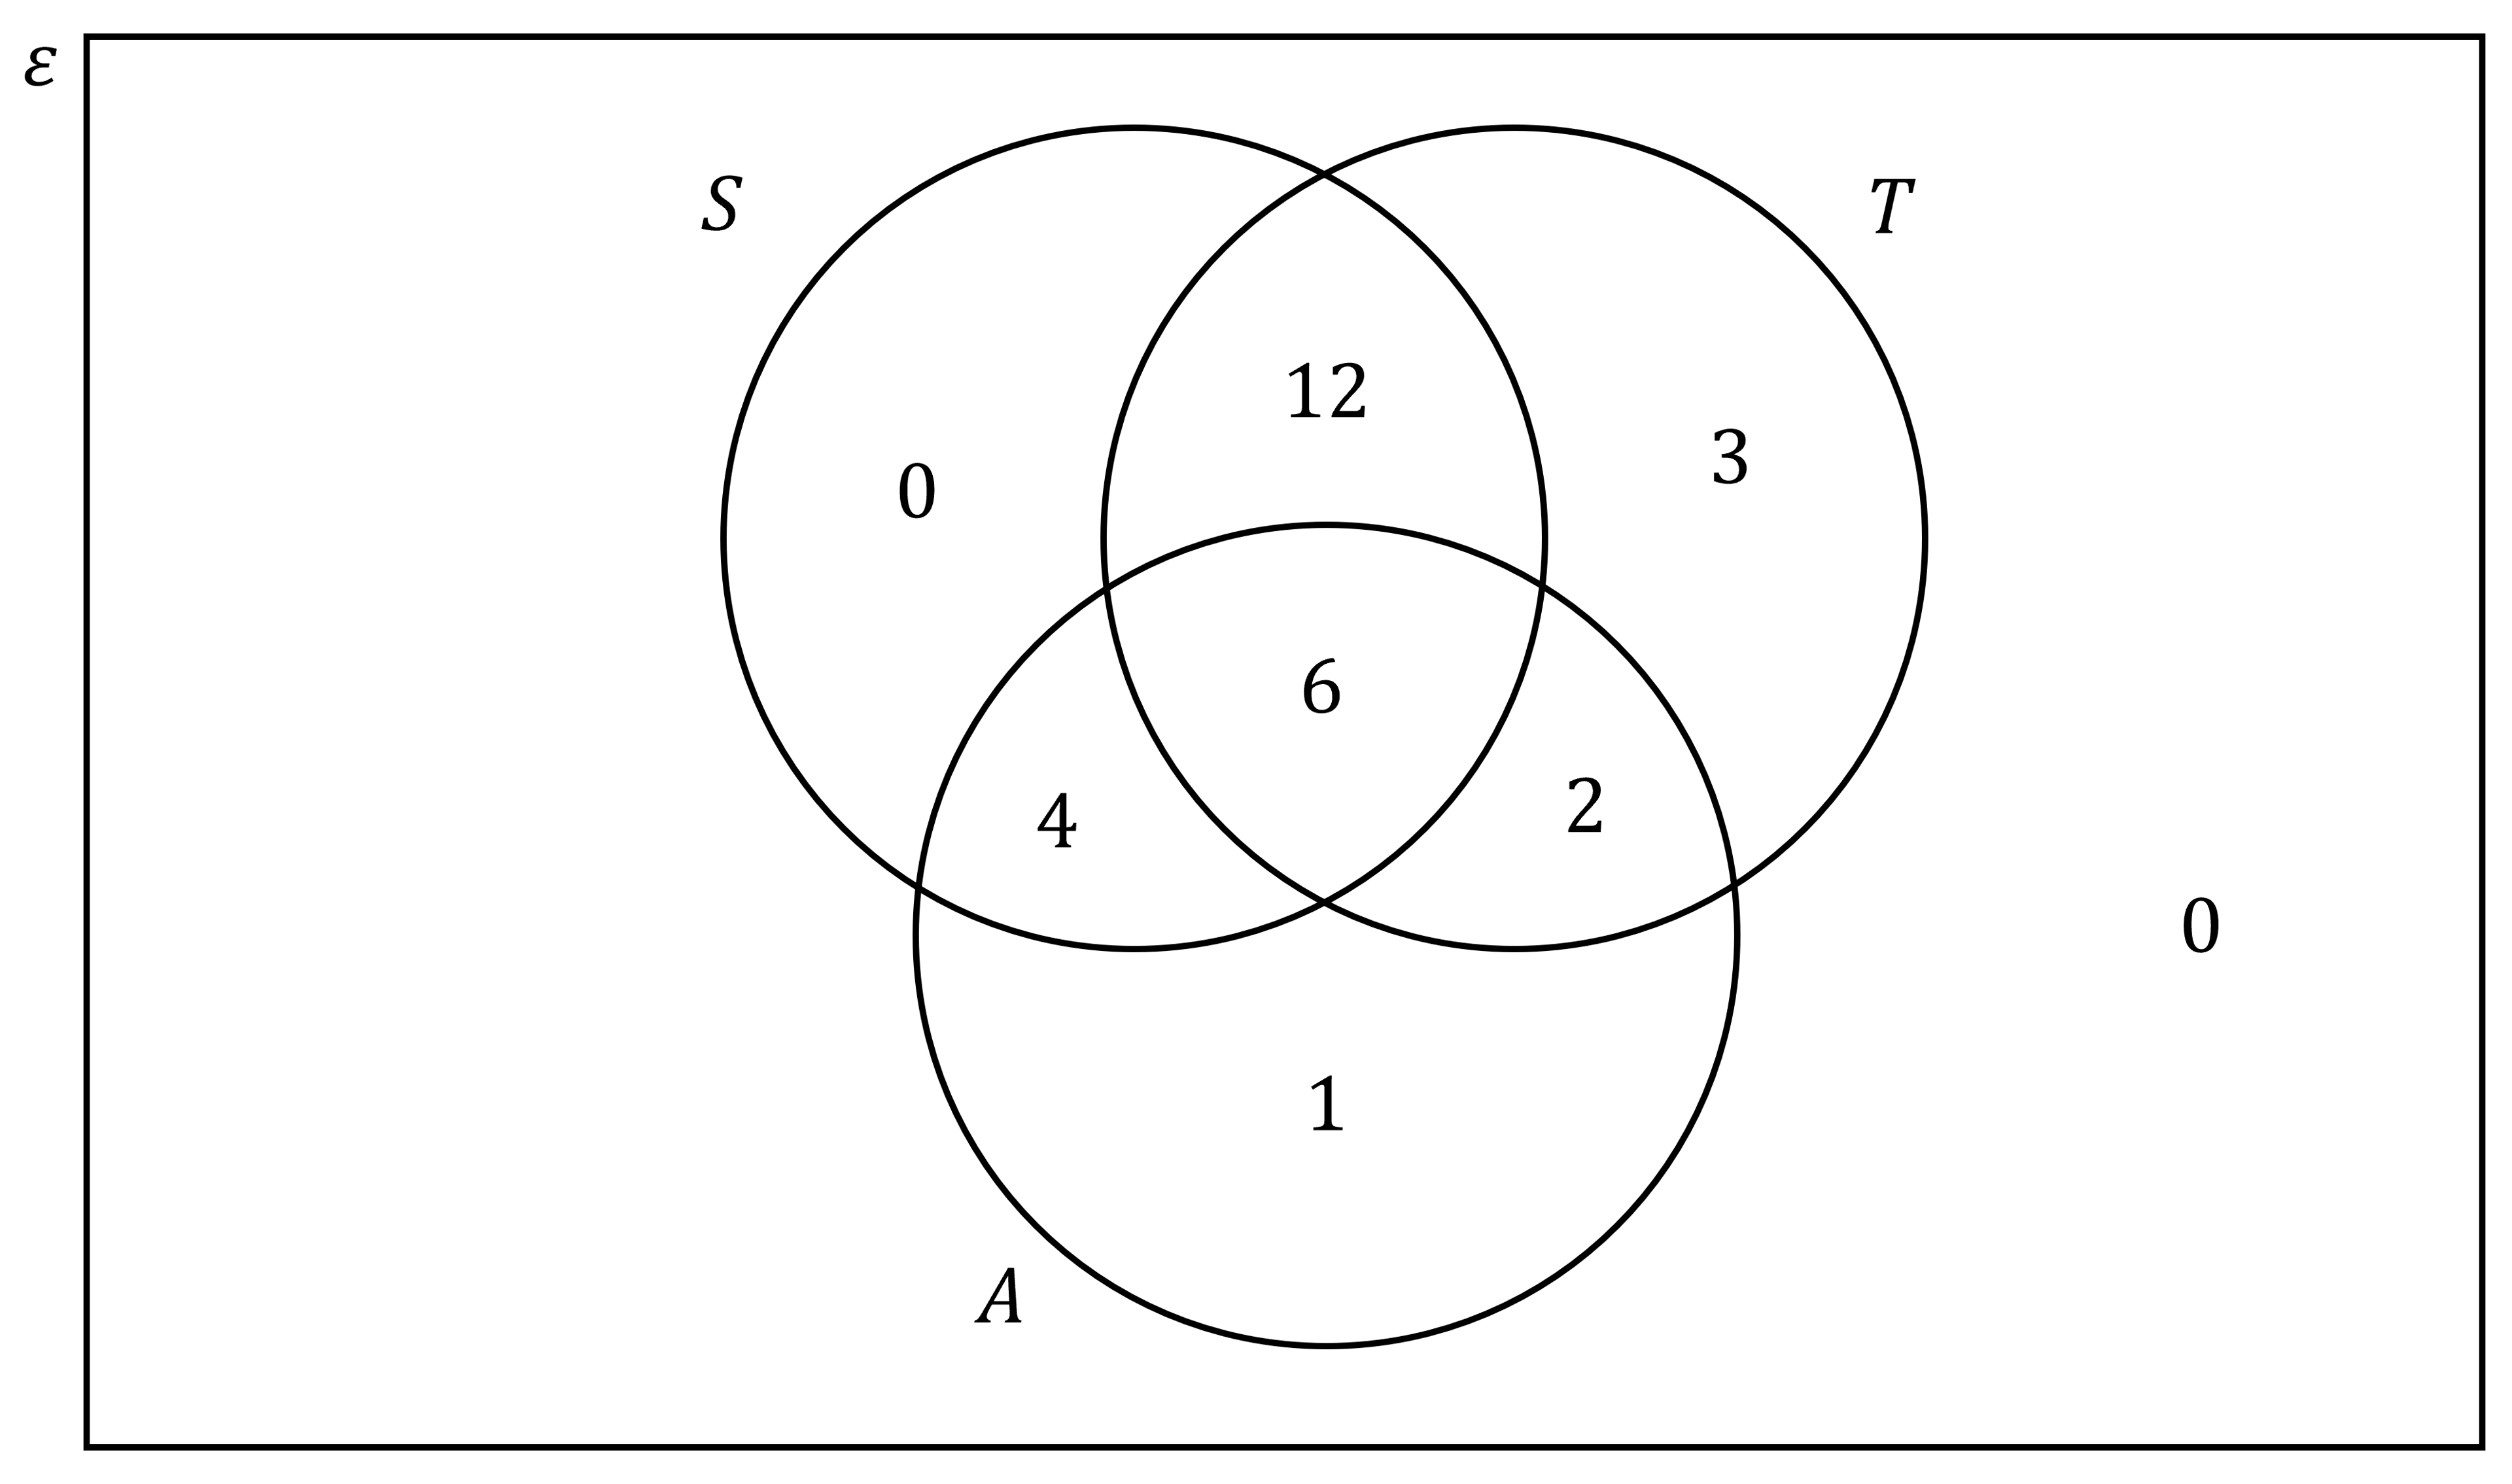
(a) A student is chosen at random. Find the probability that the student is interested in exactly two of the three subjects.
Answer:
The following sections of the Venn diagram represent students interested in exactly two subjects
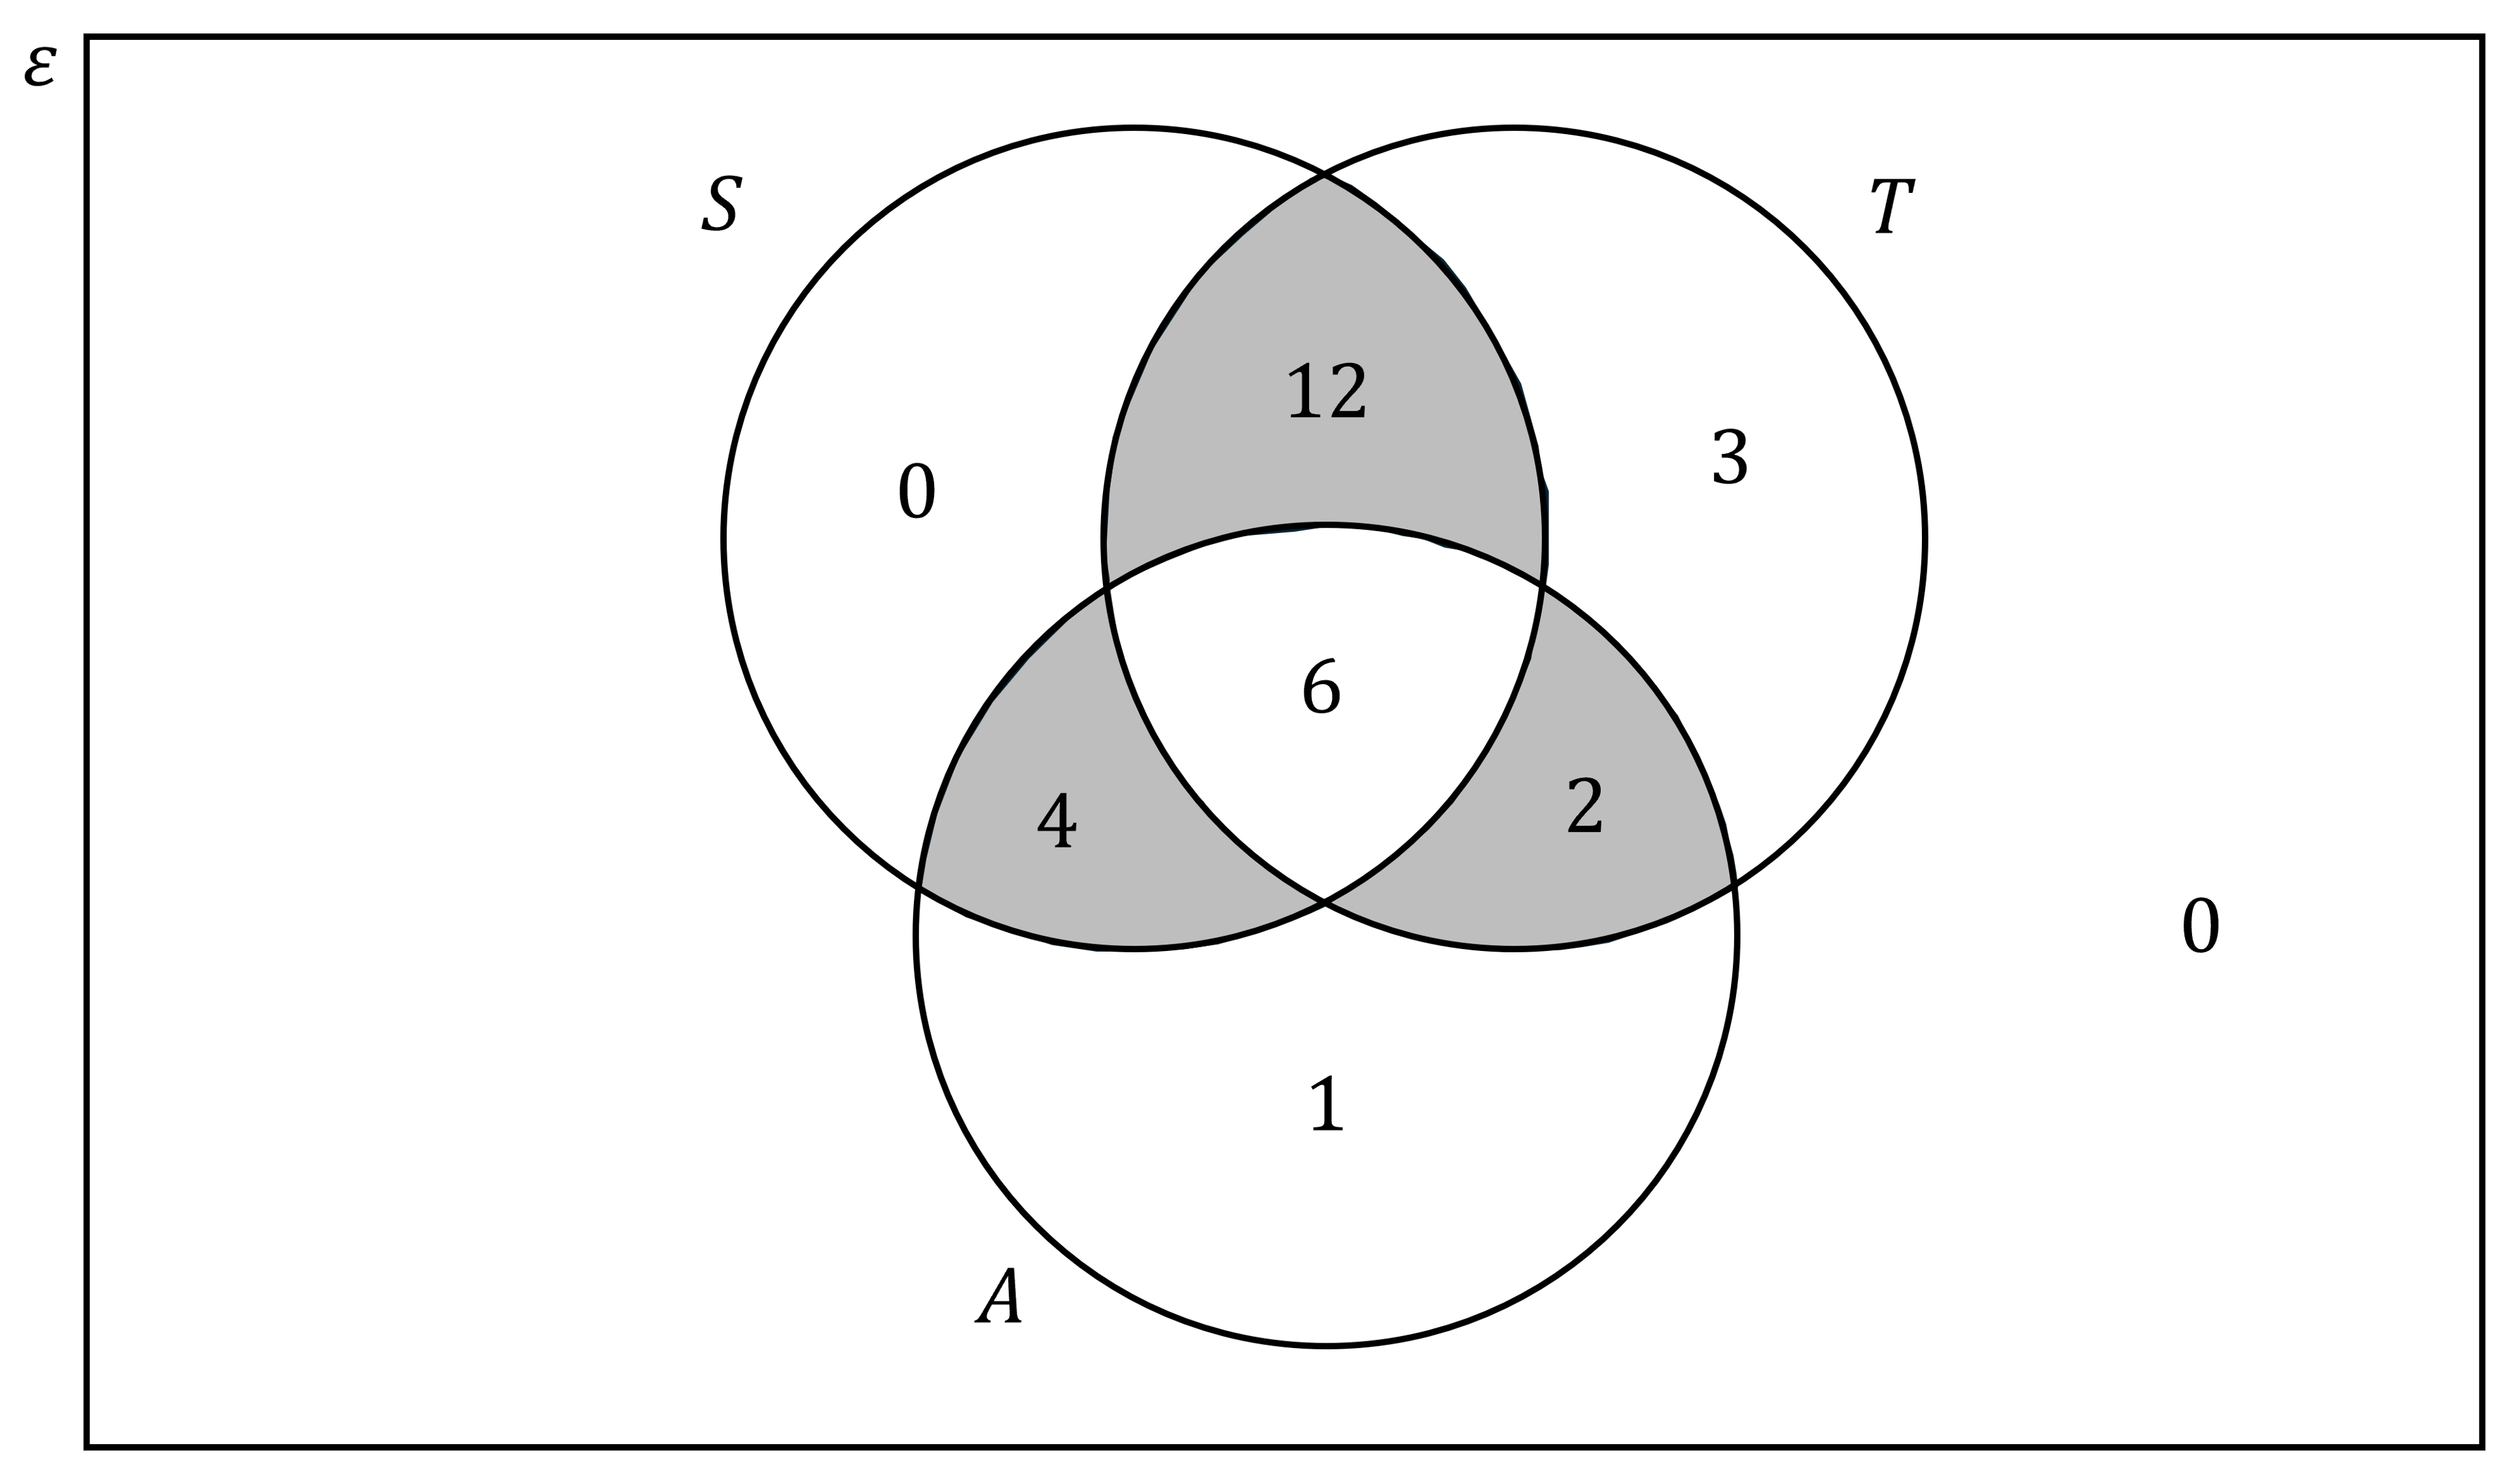
Find the total number of students interested in exactly two subjects
12 + 4 + 2 = 18
The total number of students in the diagram is 28
Write down the probability
(b) Let:
Event A be “the student is interested in Art”
Even B be “the student is interested in Science”
Show that events A and B are not independent.
Answer:
Use the definition for independence
For independent events,
Use the diagram to find which is the probability of a student being interested in Art
Use the diagram to find which is the probability of a student being interested in Science
Use the diagram to find
This is the probability that a student is interested in both art and science
Substitute these into each side of the definition for independence, then compare
If these are independent then
Compare the values and make a conclusion
In this case
Therefore events A and B are not independent

Unlock more, it's free!
Join the 100,000+ Students that ❤️ Save My Exams
the (exam) results speak for themselves:

Was this revision note helpful?