Systems in the Human Body (AQA GCSE Combined Science: Synergy: Life & Environmental Sciences): Exam Questions

Exam code: 8465

4 hours30 questions
1a
1 mark

Hormones are released by glands.

Which organ system produces hormones?

  • Circulatory system

  • Digestive system

  • Endocrine system

1b
1 mark

How are hormones transported around the body?

  • Through the bloodstream

  • Through the muscles

  • Through the nerves

2
2 marks

Rapeseed is grown to produce oil for cooking.

Describe how a sample of rapeseed oil could be tested to show it contains lipid.

3a
3 marks

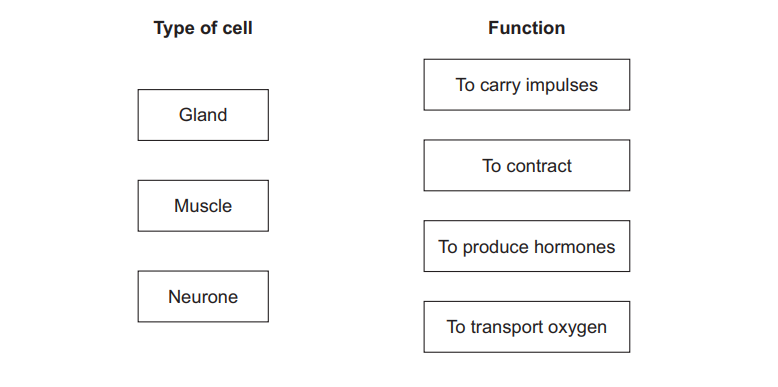
There are many different types of cell in the human body.

Each type of body cell is specialised for a different function.

Draw one line from each type of cell to the function of that cell.

Diagram for matching cell types (gland, muscle, neurone) with functions: to produce hormones, to contract, to carry impulses, plus extra option to transport oxygen
3b
1 mark

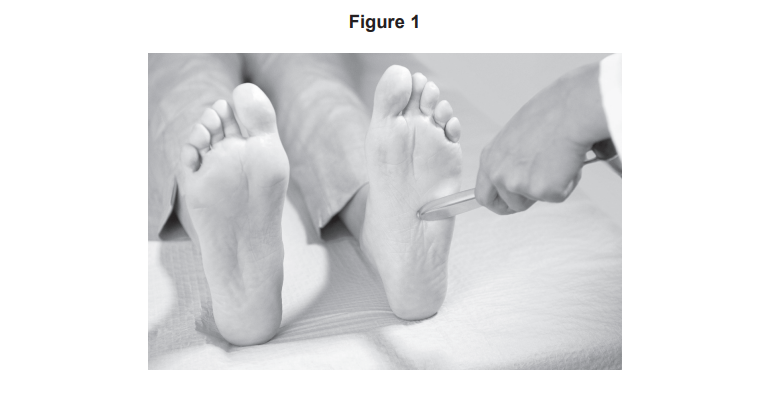
Figure 1 shows a doctor testing a reflex action of a patient.

Clinician performs reflex test on patient’s bare foot, gently stroking the sole with a blunt instrument while patient lies on an examination couch

When the doctor touches the patient's foot with a blunt rod, the patient's toes curl.

Where are the receptors in this reflex action?

  • In the brain

  • In the foot

  • In the leg

3c
1 mark

What is the coordinator in this reflex action?

  • The blunt rod

  • The central nervous system

  • The sensory neurone

3d
1 mark

What is the response in this reflex action?

  • Feeling the blunt rod

  • The blunt rod touching the skin

  • The toes curling

3e
2 marks

Muscle cells use oxygen for respiration.

Explain why muscle cells need to respire.

4a
1 mark

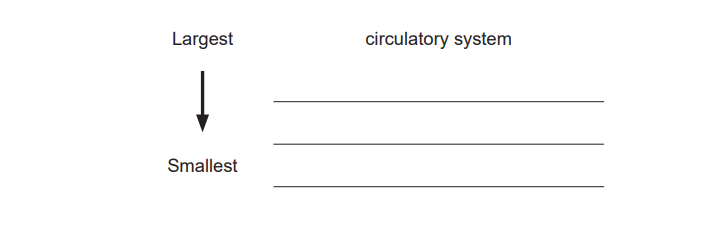
The human circulatory system transports blood around the body.

The human circulatory system is made of different structures.

Give the structures in order of size from the largest to the smallest.

Choose answers from the box.

heart

muscle cell

nucleus

The first one has been completed for you.

Diagram asking to list parts of the circulatory system from largest to smallest, with an arrow pointing down beside three blank horizontal lines.
4b
1 mark

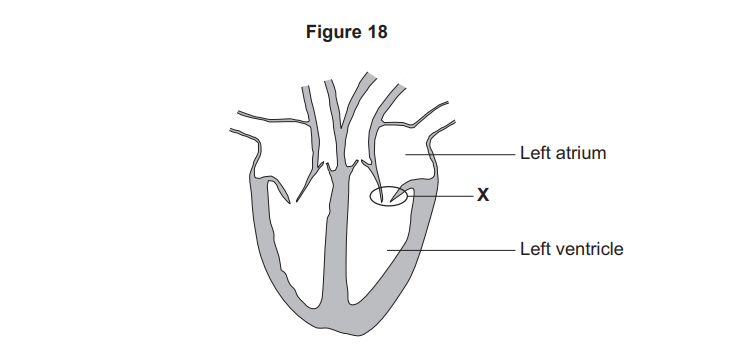
Figure 18 shows a heart.

Diagram of a vertical section of the heart showing the left atrium, left ventricle and a labelled structure X between them, likely the bicuspid valve.

The heart pumps blood from the body to the lungs.

Which route does blood travel through the heart?

  • aorta → left atrium → left ventricle → pulmonary artery

  • aorta → right atrium → right ventricle → pulmonary artery

  • vena cava → left atrium → left ventricle → pulmonary artery

  • vena cava → right atrium → right ventricle → pulmonary artery

4c
2 marks

Explain why the wall of the left ventricle is thicker than the wall of the right ventricle.

4d
1 mark

What is the function of structure X shown in Figure 18?

4e
1 mark

The heart contains a group of cells called the pacemaker.

Which part of the heart contains the pacemaker?

  • Left atrium

  • Left ventricle

  • Right atrium

  • Right ventricle

4f
1 mark

What is the function of the pacemaker?

4g
2 marks

A person started an exercise training programme to improve their health.

Table 6 shows information about the person's heart.

  • Stroke volume is the volume of blood pumped out of the heart each beat.

  • Cardiac output is the total volume of blood pumped out of the heart each minute.

Table 6

Stage of training programme

Heart rate in beats per minute

Stroke volume in cm³

Cardiac output in cm³ per minute

Before

71

65

4615

After

57

81

4617

After the training programme the person's heart rate had decreased.

Explain the effect the training programme had on the person's cardiac output.

Use Table 6.

5
1 mark

Rapeseed is grown to produce rapeseed oil for cooking.

Complete the sentence.

Choose the answer from the box.

carbohydrate

lipid

protein

Rapeseed oil is a type of .

6a
6 marks

It is important to keep our feet healthy.

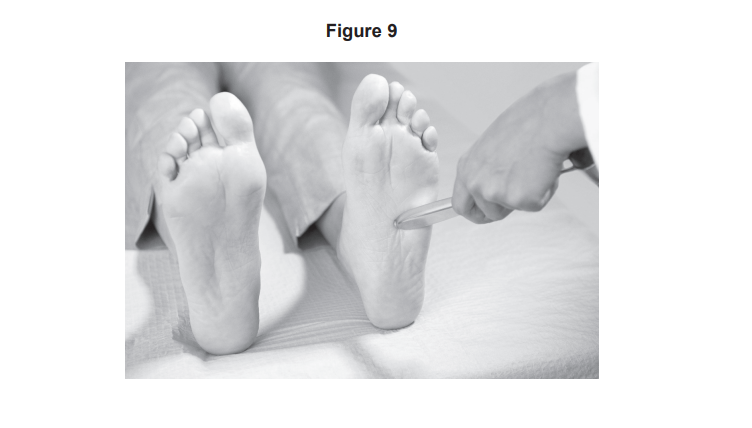
Figure 9 shows a doctor testing a reflex action of a patient.

Doctor using a blunt instrument to test sensation on the sole of a patient’s bare foot while the patient lies on an examination couch

When the doctor touches the patient’s foot with a blunt rod, the patient’s toes curl.

Describe the pathway of this reflex action.

6b
4 marks

Sometimes runners tie their shoelaces too tightly.

Tight shoes can cause muscle pain part-way through a long run.

Explain why the muscle pain starts part-way through the run.

7a
3 marks

This question is about the blood and the circulatory system.

Give the functions of red blood cells, white blood cells and platelets.

Red blood cells____________

White blood cells_____________

Platelets______________

7b
1 mark

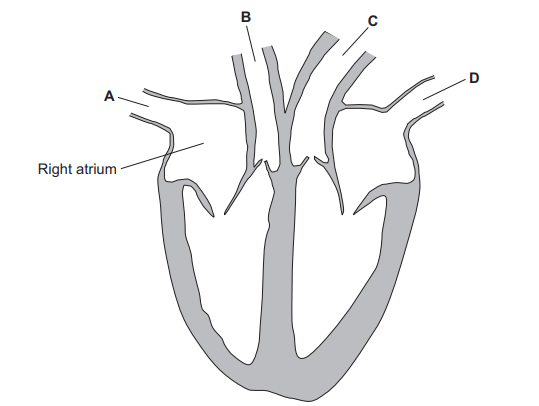
Figure 1 shows a human heart.

Figure 1

Figure 1: cross-section of the human heart with the right atrium labelled and four major blood vessels labelled A, B, C, D entering or leaving the top of the heart. A is the rightmost upper vessel (vena cava), B is the next major vessel (pulmonary artery), C is the large vessel on the patient’s left (aorta), and D is the upper-left vessel (pulmonary vein).

Draw one arrow on Figure 1 to show the movement of the blood between the left atrium and the left ventricle.

7c
1 mark

Which blood vessel carries blood from the lungs into the heart?

Tick (✓) one box.

  • A

  • B

  • C

  • D

7d
1 mark

Which blood vessel is the aorta?

Tick (✓) one box.

  • A

  • B

  • C

  • D

7e
1 mark

What structures prevent blood flowing in the wrong direction through the heart?

7f
1 mark

Heart muscle cells obtain oxygen from the blood.

Which blood vessels exchange oxygen with heart muscle cells?

Tick (✓) one box.

  • Arteries

  • Capillaries

  • Veins

7g
1 mark

Heart rate is controlled by a group of cells called the pacemaker.

Where is the pacemaker in the heart?

Tick (✓) one box.

  • Left atrium

  • Left ventricle

  • Right atrium

  • Right ventricle

7h
3 marks

Carbon monoxide is a toxic gas.

Explain why an increase of carbon monoxide in the air increases heart rate.

7i
Sme Calculator
2 marks

A person was exposed to carbon monoxide in the air for 1 hour.

During the hour the person’s heart rate increased from 80 beats per minute to 130 beats per minute.

Calculate the percentage increase in heart rate.

Use the equation:

percentage increase=final heart ratestarting heart ratestarting heart rate×100

Percentage increase = %

8a
1 mark

Starch is digested in the gut.

Why is digestion of starch needed?

  • Starch is a carbohydrate.

  • Starch molecules are insoluble.

  • Starch molecules are small.

8b
2 marks

Describe the process of starch digestion.

9
2 marks

Particulates can be harmful to people’s health when breathed in.

Large particulates are prevented from getting into the lungs by the body’s defences.

Complete the sentences.

Choose answers from the box.

acids

cilia

enzymes

mucus

sap

The cells in the trachea and bronchi produce sticky .

The particulates are moved away from the lungs using .

10a
2 marks

The small intestine (gut) is adapted to digest and absorb food molecules.

Digested food molecules pass across the wall of the small intestine into the blood.

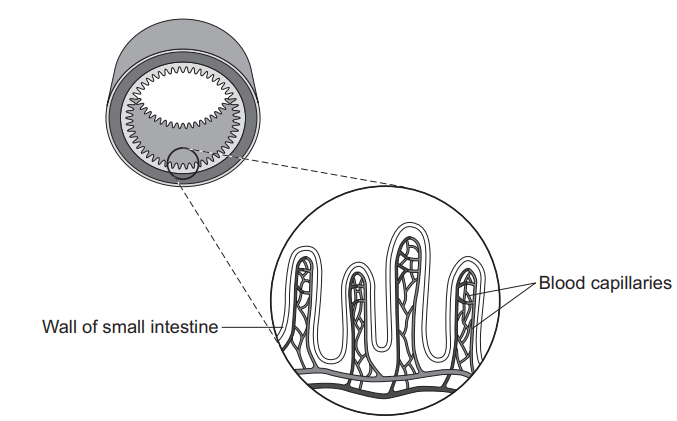
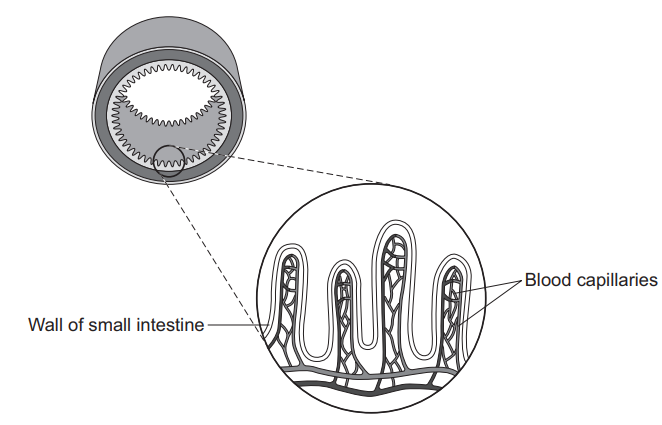
Figure 5 shows part of the wall of the small intestine.

Figure 5

Figure 5: cross-section diagram of the small intestine. A magnified inset shows the inner wall covered in many finger-like villi, each containing a dense network of blood capillaries close to its surface.

The small intestine is adapted to increase the efficiency of absorption of digested food.

Two adaptations of the small intestine are:

  • a thin wall

  • a constant blood flow through the capillaries

Describe how each adaptation allows the efficient absorption of digested food.

Thin wall

Constant blood flow

10b
1 mark

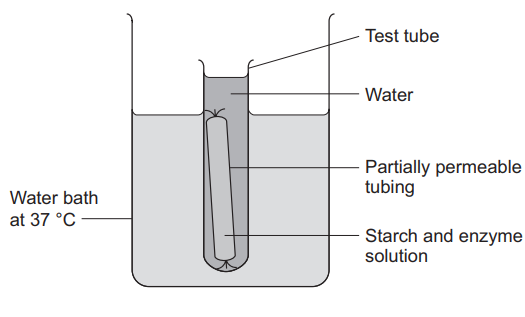
A student used partially permeable tubing to make a model of a human small intestine.

Figure 6 shows the apparatus used.

Figure 6

Figure 6: a test tube of water containing partially permeable tubing filled with starch and enzyme solution is placed in a water bath at 37 °C.

This is the method used:

  1. Add starch and enzyme solution to the tubing

  2. Take a sample of the mixture from inside the tubing and a sample of the water from the test tube. Test each sample using the iodine test and using the Benedict’s test

  3. Place the test tube into a water bath at 37 °C

  4. Repeat step 2 after 30 minutes

What type of enzyme breaks down starch?

10c
2 marks

The water bath was kept at 37 °C.

Explain why 37 °C was the most suitable temperature for the investigation.

10d
2 marks

Table 3 shows the results.

Table 3

Test

Sample tested

Iodine test

Benedict’s test

1

Mixture inside tubing at start

2

Water from test tube at start

3

Mixture inside tubing after 30 minutes

4

Water from test tube after 30 minutes

Key: ✓ positive test result; ✗ negative test result

Explain the results for test 3.

10e
3 marks

Explain the results for test 4 in table 3.

11a
1 mark

Bees feed on sugar solution produced by the flowers of plants.

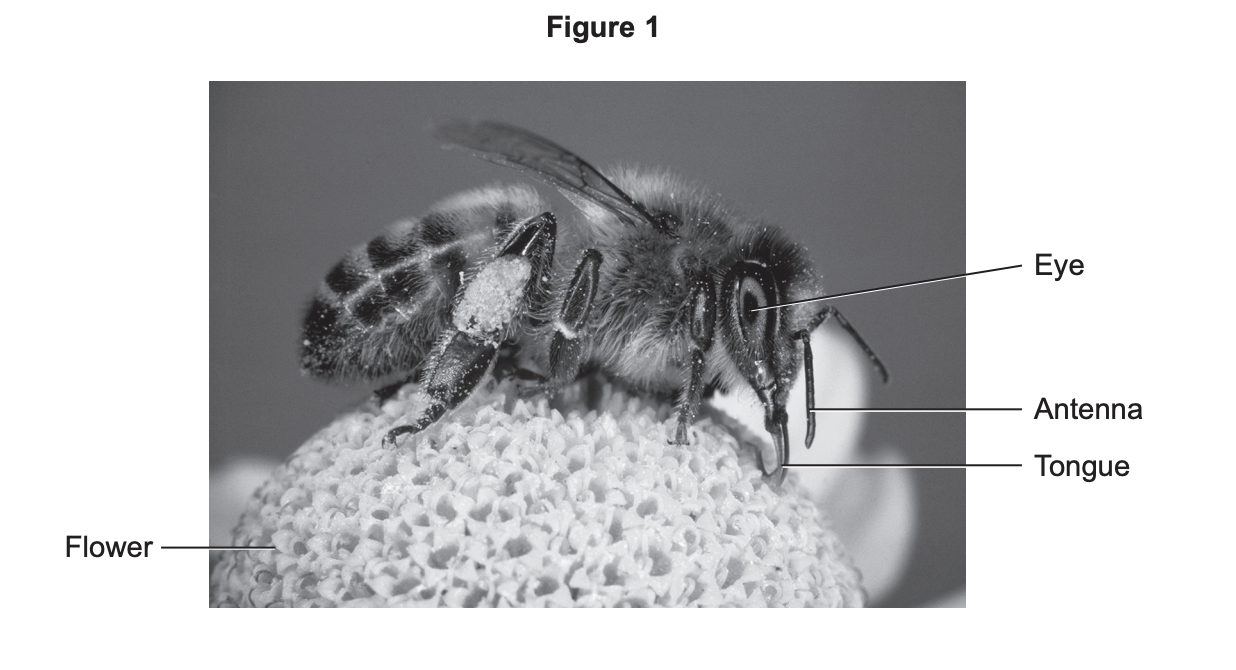
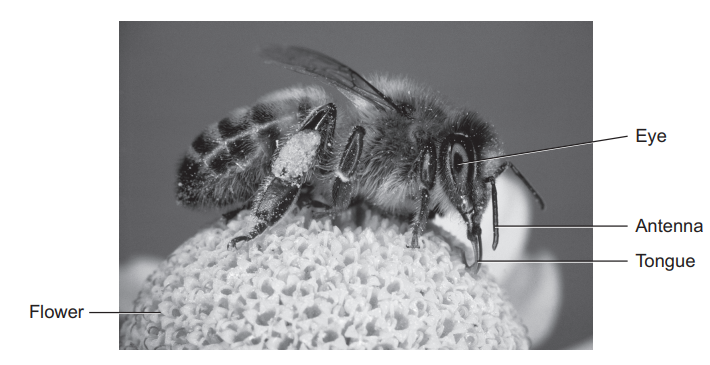
Figure 1 shows a bee feeding on a flower.

Black-and-white close-up of a bee on a flower, with labelled parts: eye, antenna, tongue and flower, showing the bee collecting pollen.

Why do bees feed on sugar solution?

Tick (✓) one box.

  • For gaseous exchange

  • To obtain energy

  • To provide proteins

11b
1 mark

Bees have a simple nervous system.

The bee nervous system has many similar features to the human nervous system.

The antenna is a sense organ.

The antenna contains specialised cells that detect stimuli.

What are cells that detect stimuli called?

Tick (✓) one box.

  • Coordinators

  • Effectors

  • Receptors

11c
1 mark

When an antenna of a bee touches sugar solution the bee automatically sticks out its tongue.

What type of action is automatic?

Tick (✓) one box.

  • A conscious action

  • A delayed action

  • A reflex action

11d
1 mark

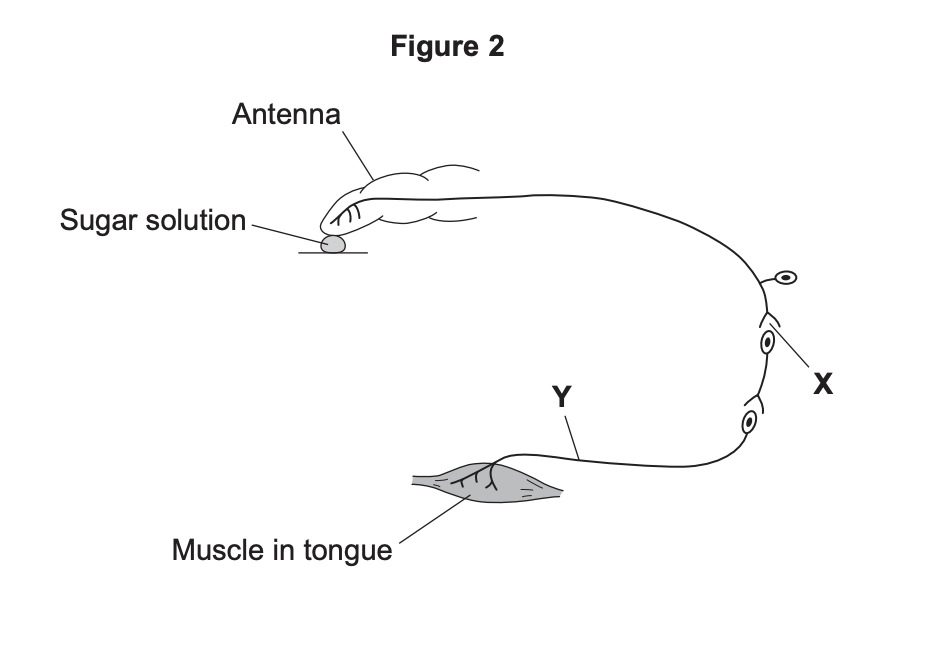
Figure 2 shows the nervous pathway taken when a bee antenna touches sugar solution.

Diagram of an insect experiment showing antenna touching sugar solution, nerve pathway labelled X, and muscle in tongue labelled Y at the other end

What is the gap labelled X?

Tick (✓) one box.

  • A gland

  • A synapse

  • An impulse

11e
1 mark

What type of neurone is Y?

Tick (✓) one box.

  • Motor neurone

  • Relay neurone

  • Sensory neurone

11f
1 mark

Eyes are sense organs that can detect electromagnetic radiation.

A bee’s eye can detect ultraviolet radiation.

Detecting ultraviolet radiation allows the bee to see the parts of the flower that produce sugar solution.

Why is it an advantage for bees to see the parts of the flower that produce sugar solution?

11g
1 mark

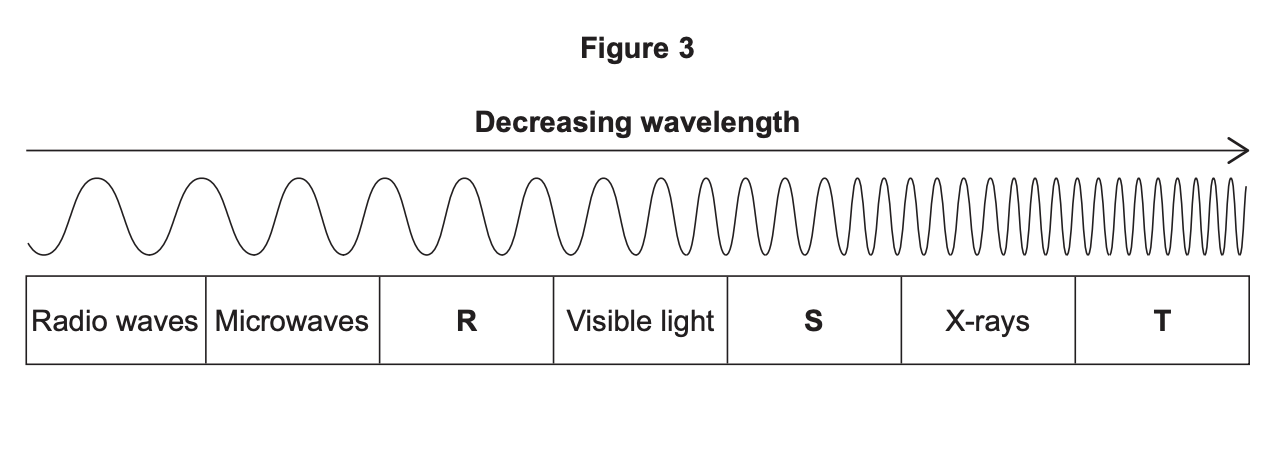
Figure 3 shows the electromagnetic spectrum.

Diagram of the electromagnetic spectrum showing decreasing wavelength from radio waves, microwaves, R, visible light, S, X-rays to T.

Which letter shows the position of ultraviolet radiation in the electromagnetic spectrum?

Tick (✓) one box.

  • R

  • S

  • T

11h
1 mark

Which part of the electromagnetic spectrum in Figure 3 has the lowest frequency?

12a
2 marks

Starch molecules are broken down into glucose molecules in the small intestine (gut).

The glucose molecules are absorbed across the wall of the small intestine into the blood.

Figure 9 shows part of the wall of the small intestine.

Figure 9

Figure 9: cross-section diagram of the small intestine. A magnified inset shows the inner wall covered in many finger-like villi, each containing a dense network of blood capillaries close to its surface.

Give two ways that the small intestine is adapted for the absorption of glucose into the blood.

Use Figure 9.

1

2

12b
3 marks

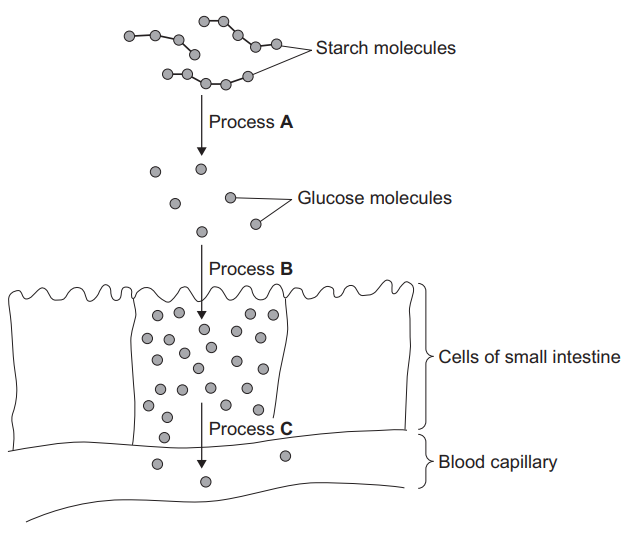
Figure 10 shows:

  • the breakdown of starch molecules

  • the movement of glucose molecules across the wall of the small intestine

Figure 10

Figure 10: starch molecules at the top are broken down by Process A into smaller glucose molecules. The glucose molecules move by Process B into the cells of the small intestine, where they accumulate at high concentration, then move by Process C into a blood capillary below.

Look at processes A, B and C in Figure 10.

Complete the sentences.

Choose answers from the box.

active transport

evaporation

diffusion

digestion

transpiration

In process A, starch molecules are broken down into glucose by the process of .

In process B, glucose molecules move into the cells of the small intestine by .

In process C, glucose molecules move from the cells of the small intestine into the blood by .

12c
1 mark

Give one reason why starch molecules cannot be absorbed into the blood.

Use Figure 10.

12d
1 mark

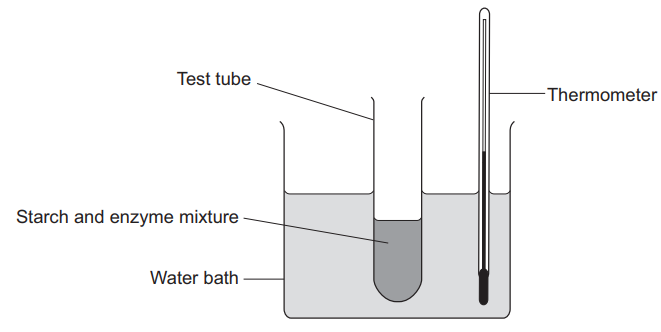
A student investigated the breakdown of starch with an enzyme and without an enzyme.

Figure 11 shows the apparatus.

Figure 11

Figure 11: a test tube containing a starch and enzyme mixture stands in a water bath. A thermometer is placed in the water bath next to the test tube.

This is the method used.

  1. Add 5 cm3 of starch and enzyme mixture to a test tube

  2. Place the test tube into a water bath at 37 °C

  3. Remove one drop of the mixture every 60 seconds and test for starch using iodine solution

  4. Repeat step 3 until the starch is broken down or until 20 minutes is reached

  5. Repeat steps 1 to 4 another three times

  6. Repeat steps 1 to 5 using 5 cm3 of starch solution with no enzyme

What colour will the iodine solution change to when starch is present?

Tick (✓) one box.

  • Black

  • Orange

  • Red

  • White

12e
1 mark

What is the dependent variable in this investigation?

Tick (✓) one box.

  • Temperature of the water bath

  • Time taken for starch to break down

  • Volume of the sample tested

12f
1 mark

Table 2 shows the results for the starch and enzyme mixture.

Table 2

Test

Time taken for starch to break down in seconds

1

300

2

420

3

60

4

360

One of the results in Table 2 is anomalous.

Which result is anomalous?

Tick (✓) one box.

  • 300 s

  • 420 s

  • 60 s

  • 360 s

12g
1 mark

What should the student do with the anomalous result?

12h
1 mark

The student removed one drop of the mixture every 60 seconds and tested the drop for starch.

How could the student improve the method?

Tick (✓) one box.

  • Test for starch every 30 seconds

  • Test for starch every 3 minutes

  • Test for starch every 10 minutes

12i
1 mark

Another student repeated the investigation.

Table 3 shows the results.

Table 3

Starch solution

Mean time taken for starch to break down

With enzyme

300 seconds

With no enzyme

Starch not broken down after 20 minutes

Give one conclusion that can be made from the results.

13
3 marks

Particulates in the air can be breathed in.

The body’s defences prevent particulates larger than 10 micrometres getting into the lungs.

Describe how the body prevents the particulates reaching the lungs and removes the particulates from the airways.

14a
1 mark

Carbon monoxide changes the amount of oxygen that blood can transport.

Which part of the blood transports oxygen?

14b
1 mark

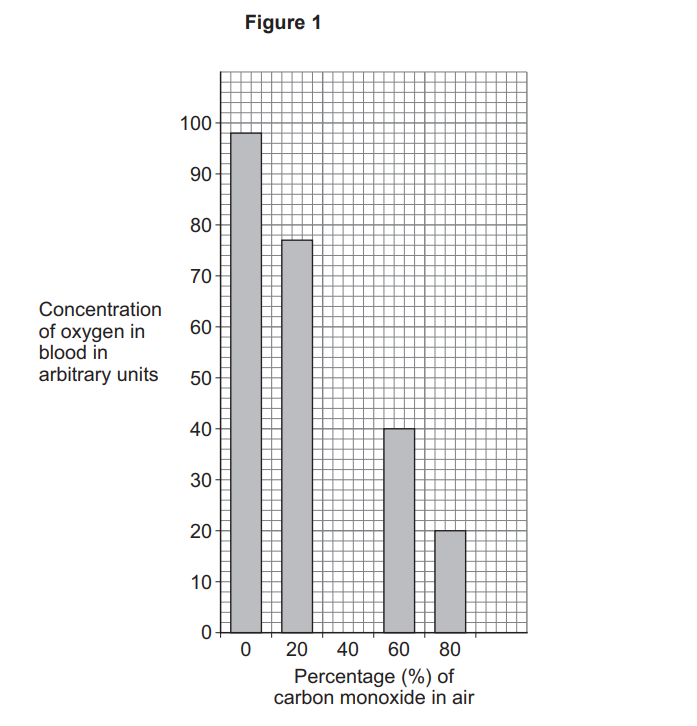
Figure 1 shows how the percentage of carbon monoxide in air affects the concentration of oxygen in blood.

Bar chart showing oxygen concentration in blood falling from about 98 to 20 arbitrary units as carbon monoxide in air rises from 0% to 80%.

When the percentage of carbon monoxide in air is 40% the concentration of oxygen in blood is 64 arbitrary units.

Complete Figure 1 to show the result for 40% carbon monoxide in air.

14c
Sme Calculator
2 marks

The percentage of carbon monoxide in air changes from 0% to 80%.

Determine the change in the concentration of oxygen in blood.

Use Figure 1.

Change = _______________ arbitrary units

14d
1 mark

Describe how increasing the percentage of carbon monoxide in air affects the concentration of oxygen in blood.

Use Figure 1.

15a
3 marks

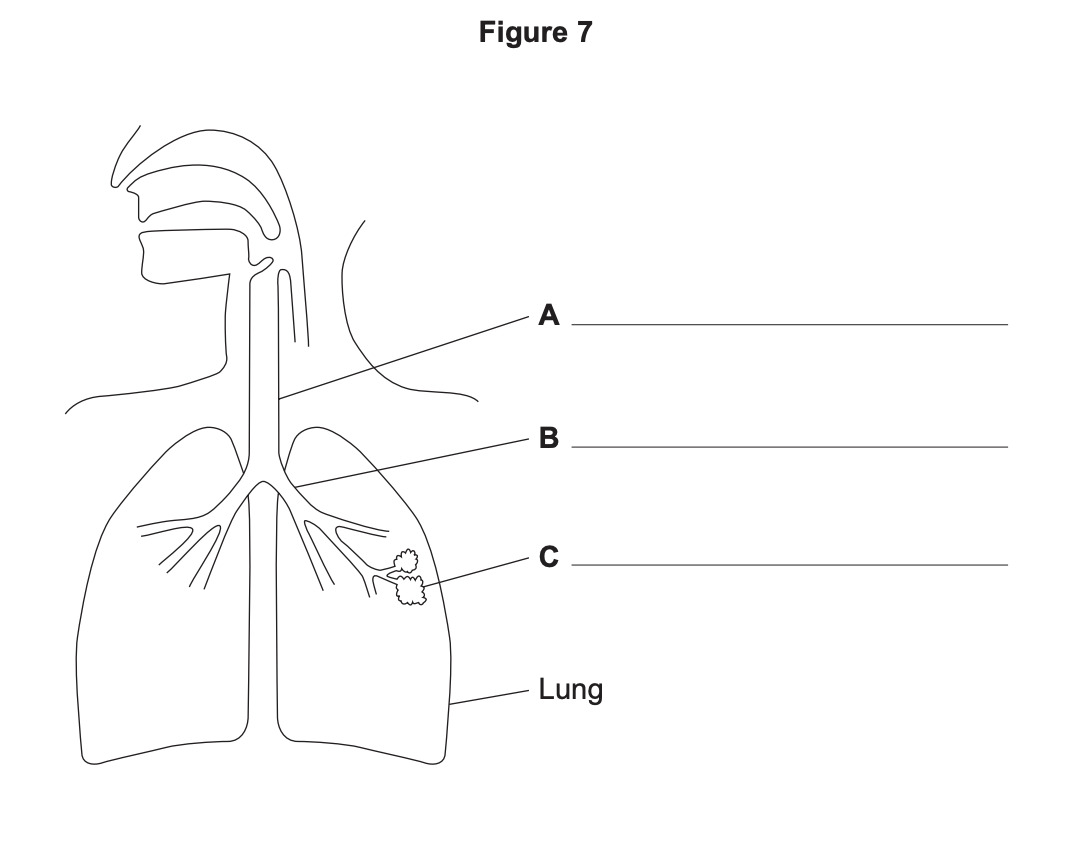
Figure 7 shows part of the human breathing system.

Diagram of the human breathing system showing mouth, trachea and lungs, with three labelled points A, B, C on airways and an alveoli cluster in the right lung

Label structures A, B and C on Figure 7.

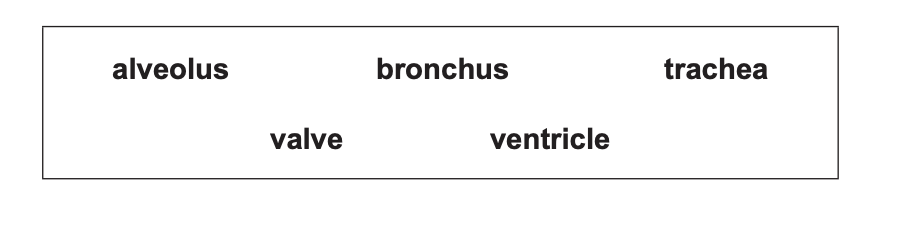
Choose answers from the box.

Diagram showing a labelled box containing the biological terms alveolus, bronchus, trachea, valve and ventricle arranged in two rows
15b
1 mark

Describe one way that lungs are adapted for gas exchange.

15c
2 marks

A student investigated the effect of surface area to volume ratio on diffusion.

The student used gel cubes with different surface area to volume ratios.

The gel cubes:

  • were pink at the start of the investigation

  • became colourless as acid diffused into the cube

This is the method used.

  1. Cut the gel into a cube with sides that are 1 cm long

  2. Place the cube in a beaker

  3. Cover the cube with acid

  4. Keep the beaker at 20 °C

  5. Record the time taken for the cube to go colourless

  6. Repeat steps 2 to 5 with cubes of different sizes

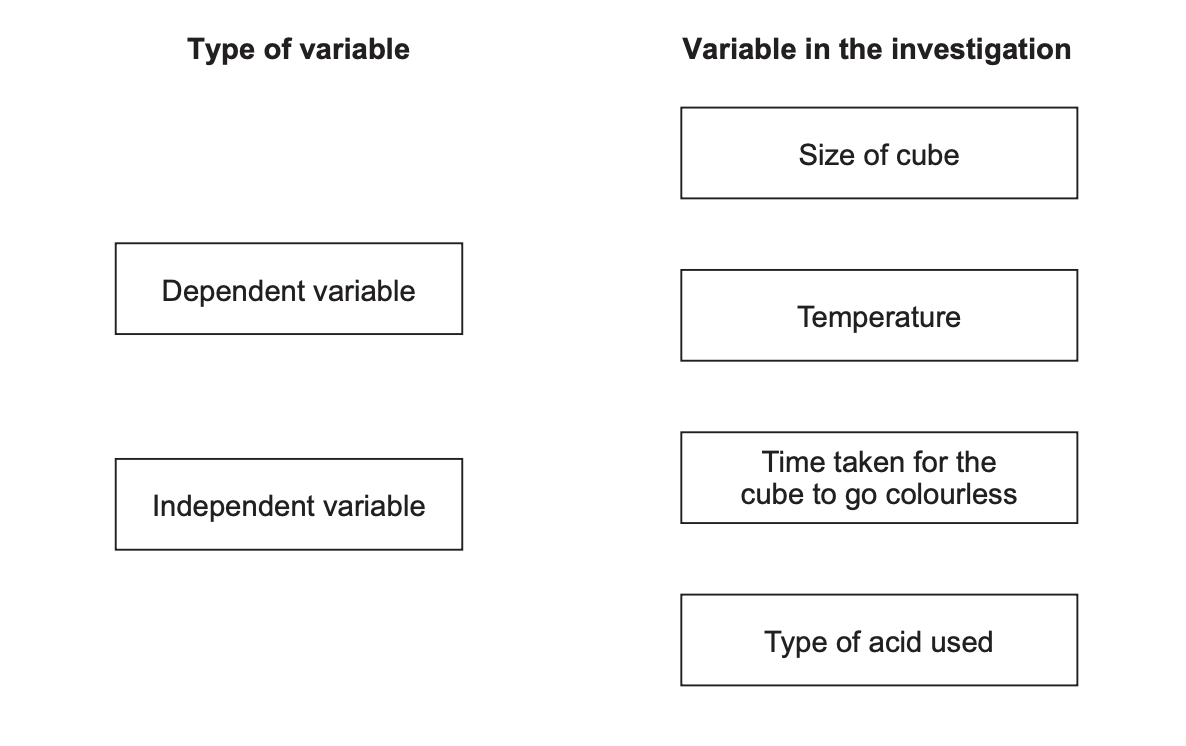
Draw one line from each type of variable to that variable in the investigation.

Diagram showing two columns: ‘Type of variable’ with dependent and independent, and ‘Variable in the investigation’ listing size of cube, temperature, time to go colourless, type of acid.
15d
Sme Calculator
3 marks

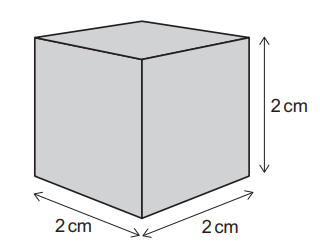
Figure 8 shows one of the cubes.

Figure 8

Diagram of a grey cube labelled Figure 8, showing all edges are 2 cm with arrows marking width, depth and height.

Calculate the surface area to volume ratio for the cube.

Complete the following steps.

The surface area of one face of the cube is 4 cm².

Calculate the total surface area of the cube

Surface area = _cm²

Calculate the volume of the cube

Volume = _cm³

Give the surface area to volume ratio of the cube _

Surface area : volume = :

15e
1 mark

Table 2 shows the results.

Table 2

Length of side of cube in cm

Time taken for the cube to go colourless in minutes

1

5

2

15

3

30

4

90

Describe the effect of increasing the size of the cube on the time taken for the cube to go colourless.

15f
1 mark

What would be an improvement to the investigation?

Tick (✓) one box.

  • Repeat the method three times and calculate a mean for each size cube.

  • Repeat the method with 5 cubes all of the same size.

  • Repeat the method with a different size beaker for each size cube.

16a
5 marks

Bees have a simple nervous system.

The bee nervous system has similar features to the human nervous system.

The bee’s antenna is a sense organ.

Figure 8 shows a bee feeding on a flower.

Figure 8

Figure 8: close-up photograph of a honey bee feeding on a white flower. Labels point to the bee’s eye, antenna and tongue, and to the flower.

Bees feed on sugar solution produced by the flowers of plants.

When an antenna of a bee touches sugar solution the bee automatically sticks out its tongue. This response is a reflex action.

Describe the nervous pathway for the reflex action.

16b
1 mark

Some species of flowers produce sugar solution that contains the chemical caffeine.

A scientist investigated the effect of caffeine on the feeding behaviour of bees. The investigation was carried out in a laboratory.

This is the method used:

  1. Feed 15 newly hatched bees on sugar solution for 24 hours

  2. Release the bees

  3. Record the number of visits made by the bees to a feeder containing sugar solution in 3 hours

  4. Repeat steps 2 and 3 for a further 2 days

The scientist then took another 15 newly hatched bees and repeated the same method using a sugar and caffeine solution.

Table 5 shows the results.

Table 5

Content of feeder

Day 1

Day 2

Day 3

Sugar solution

18

11

4

Sugar and caffeine solution

23

20

12

(Mean number of visits in 3 hours per bee)

The scientist controlled the concentration of the solutions.

Give one other variable that should have been a control variable in the investigation.

16c
4 marks

The scientist concluded that:

> ‘Caffeine affects the feeding behaviour of bees.’

Evaluate the scientist’s conclusion.

Use data from Table 5 and information from the method.

17a
3 marks

This question is about the nervous system.

A person steps on a sharp object.

The person immediately moves their foot away from the object in a reflex action.

Complete the sentences.

Choose answers from the box.

a gland

a muscle

a neurone

the skin

the spinal cord

When the person steps on the object, the receptor is in ____________ .

An electrical impulse travels from the receptor along __________.

The effector is _____________.

17b
1 mark

What is the name of the gap between two neurones?

  • A coordinator

  • A reflex arc

  • A synapse

17c
2 marks

A scientist investigated how age affects reaction time in a group of students.

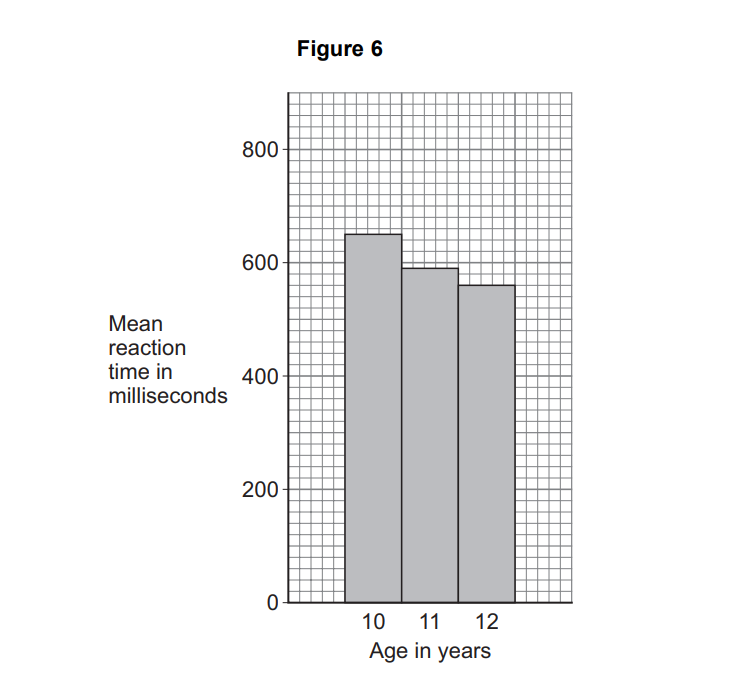
Figure 6 shows the results.

Bar chart titled Figure 6 showing mean reaction time decreasing from about 650 ms at age 10 to 600 ms at 11 and 550 ms at 12

The students had not practised the reaction time test.

Suggest two other control variables the scientists should have used.

17d
1 mark

What was the mean reaction time of 10-year-olds?

Use Figure 6.

Mean reaction time = ___________ milliseconds

17e
1 mark

How old were the students with the lowest mean reaction time?

Use Figure 6.

  • 10 years old

  • 11 years old

  • 12 years old

17f
2 marks

The scientist also measured the reaction time of 35 adults.

Describe how to calculate the mean reaction time for the 35 adults.

17g
Sme Calculator
1 mark

The reaction time of one adult was 450 milliseconds.

What is the reaction time of the adult in seconds?

1 second = 1000 milliseconds.

Reaction time = _____________seconds

18
1 mark

In multicellular organisms, cells are organised into tissues.

What is meant by a ‘tissue’?

19a
2 marks

A student investigated the effect of surface area to volume ratio on diffusion.

The student used gel cubes with different surface area to volume ratios.

  • The cubes contained indicator and an alkaline solution

  • The indicator was pink at the start of the investigation because the cubes were alkaline

  • As acid diffused into the cubes the indicator changed from pink to colourless

  • If acid had not diffused to the centre of the cube some of the cube would not have changed colour

This is the method used.

  1. Make a gel containing indicator and an alkaline solution

  2. Cut the gel into a cube with 1 cm long sides

  3. Place the cube in a beaker

  4. Cover the cube with acid

  5. After 5 minutes, remove the cube from the acid

  6. Cut the cube in half

  7. Measure the width of the area inside the cube that did not change colour

  8. Calculate the volume at the centre of the cube that did not change colour

  9. Repeat steps 3 to 8 with cubes of different sizes

Give two control variables the student should have used.

Do not refer to time in your answer.

1

2

19b
Sme Calculator
4 marks

The student calculated the percentage of the volume of each cube that had changed colour.

Table 2 shows the results.

Table 2

Length of sides of cube in cm

Volume of cube that had NOT changed colour in cm3

Percentage (%) of volume of cube that had changed colour

1

0

100

2

1

88

3

8

70

4

27

X

Calculate percentage X in Table 2.

Percentage X = %

19c
4 marks

The different sized cubes are a model for organisms of different sizes.

Explain why surface area to volume ratio is important to organisms of different sizes.

19d
2 marks

Give two limitations of using cubes to model diffusion in organisms.

1

2

20a
1 mark

This question is about respiration.

Complete the sentence.

Choose the answer from the box.

balanced

exothermic

photosynthetic

Respiration releases energy, therefore respiration is ____________ .

20b
1 mark

Yeast is a type of fungus.

A student investigated how temperature affects respiration in yeast.

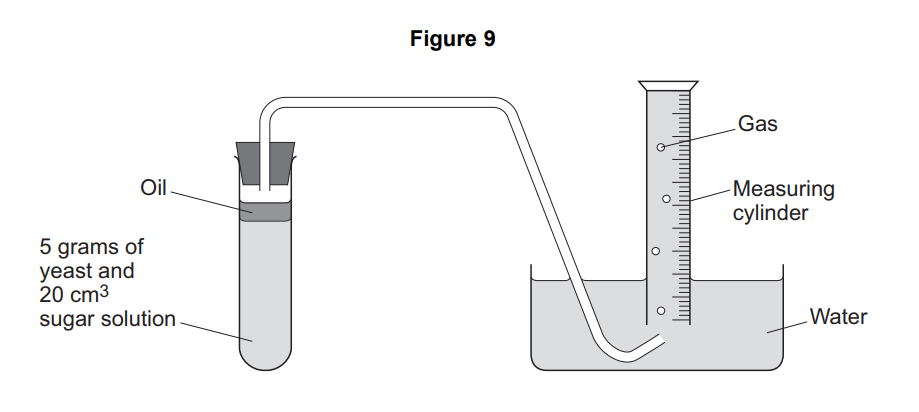
Figure 9 shows some of the apparatus used.

Diagram of fermentation: test tube with 5 g yeast and 20 cm³ sugar solution under oil, delivering gas through a tube into an inverted measuring cylinder in water.

The yeast produces a gas. The gas passes through the layer of oil and is collected in the measuring cylinder.

The oil above the yeast and sugar solution prevents oxygen from entering the solution.

What type of respiration occurs in the yeast when no oxygen is present?

20c
2 marks

This is the method used.

  1. Place yeast and sugar solution in a test tube.

  2. Add a thin layer of oil.

  3. Place the test tube in a water bath at 5 °C.

  4. After 10 minutes set up the apparatus as shown in Figure 9.

  5. Record the volume of gas collected in 1 hour.

  6. Repeat steps 1 to 5 at different temperatures.

Give two control variables the student used in the investigation.

20d
1 mark

Table 3 shows the results.

Table 3

Temperature in °C

Volume of gas produced in cm³

5

0.8

10

1.6

15

2.4

20

3.2

25

4.0

Complete the sentence.

Choose the answer from the box.

decreased

stayed the same

increased

As the temperature increased, the volume of gas produced_ .

20e
1 mark

Why should the data from Table 3 be presented as a line graph and not as a bar chart?

Tick (✓) one box.

  • Bar charts are too simple

  • Temperature is a continuous variable

  • Volume of gas is a categoric variable

20f
4 marks

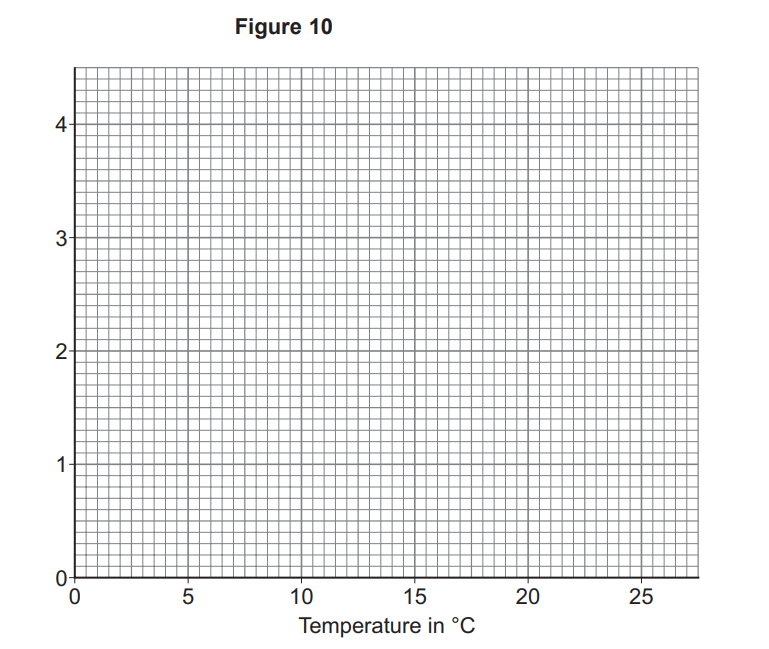
Complete Figure 10.

You should:

  • label the y-axis

  • plot the data from Table 3

  • draw a line of best fit.

Blank grid graph titled Figure 10, with x‑axis labelled “Temperature in °C” from 0 to 25 and y‑axis from 0 to 4, ready for plotting data
20g
1 mark

Predict the volume of gas that would be produced at 7 °C.

Use Figure 10.

Volume = ____________ cm³

20h
1 mark

The student repeated the investigation at 60 °C.

Suggest why gas was not produced by the yeast at 60 °C.

21a
1 mark

Our nervous system controls our reactions.

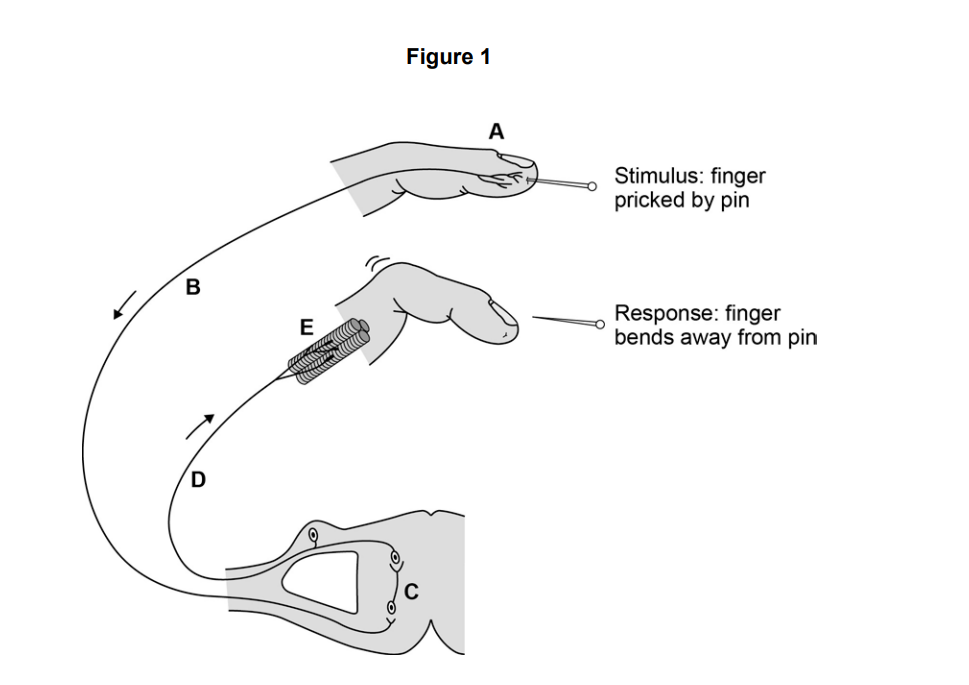
Figure 1 shows the part of the nervous system involved in the rapid response to a stimulus

Diagram of a reflex arc: finger pricked by pin, nerve impulses travel via spinal cord to muscles, causing the finger to bend away.

What is this type of rapid response called?

Tick one box.

  • Circular action

  • Fast action

  • Forced action

  • Reflex action

21b
3 marks

Features of the nervous system are labelled A, B, C, D and E on Figure 1

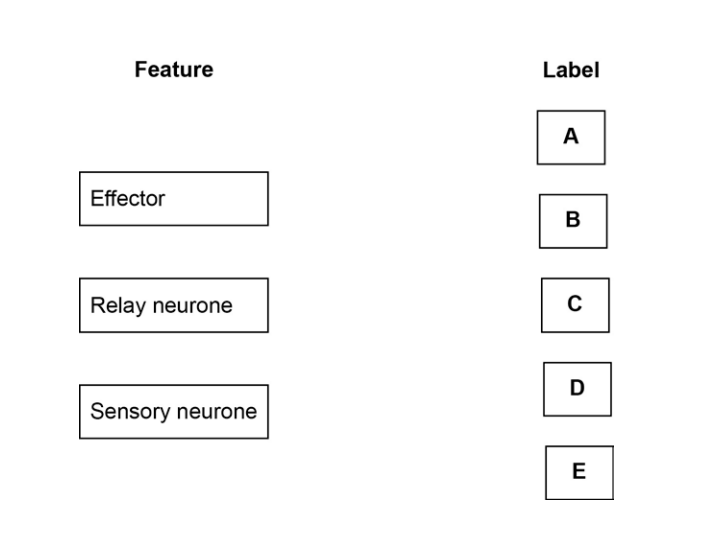
Draw one line from each feature to the correct label from Figure 1.

Matching task table showing features: Effector, Relay neurone and Sensory neurone on the left, and labels A, B, C, D, E in boxes on the right
21c
1 mark

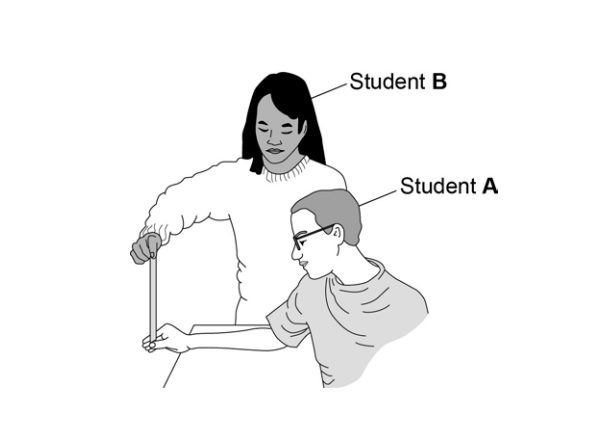
Two students compare their reactions using a ruler.

Method:

  1. Student A sits with his elbow on a table top.

  2. Student B holds the ruler so the bottom of the ruler is level with the top of student A's thumb.

  3. Student B drops the ruler.

  4. Student A catches the ruler.

  5. Record the drop distance.

  6. Repeat steps 1 to 5 four more times.

  7. Repeat the whole experiment with student A dropping the ruler and student B catching it.

Illustration of Student B holding a vertical ruler while Student A sits, arm outstretched on a table, ready to catch or measure something.

Both students are right-handed.

The students are testing the hypothesis:

the drop distance of the ruler is smaller when a right-handed person uses their right hand to catch the ruler.

Student A uses his right hand to catch the ruler.

Student B uses her left hand to catch the ruler.

Complete the sentence. Use an answer from the box.

control

dependent

independent

The drop distance was the variable.
21d
1 mark

Table 1 shows the students' results.

Student

Drop distance in cm

Test 1

Test 2

Test 3

Test 4

Test 5

A

17.5

15.5

15.0

23.5

17.0

B

20.5

?

19.5

21.0

19.0

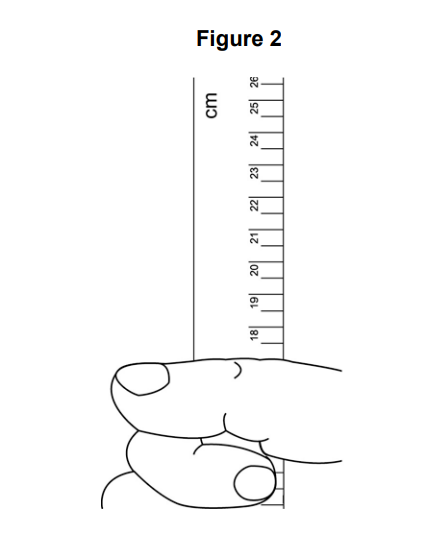
Figure 2 shows student B's Test 2 result

Diagram labelled Figure 2 showing a hand gripping the bottom of a vertical centimetre ruler, with the index finger aligned near the 18 cm mark

Use Figure 2 to complete the missing result for Test 2.

Write the answer in Table 1.

21e
1 mark

What was the resolution of the ruler the students used? (Smallest divisions on the ruler are at every 0.5 cm.)

Tick one box.

  • 0.1 cm

  • 0.5 cm

  • 1 cm

  • 10 cm

21f
2 marks

One of the results in Table 1 is anomalous.

Identify the anomalous result.

Give the reason why you chose your answer.

21g
1 mark

The students are testing the hypothesis:

the drop distance of the ruler is smaller when a right-handed person uses their right hand to catch the ruler.

The results in Table 1 are not a good test of the hypothesis.

What is one reason why?

Tick one box.

  • The drop distances are very variable

  • The drop distance for Student A is sometimes bigger than the drop distance for Student B

  • The results are for the left and right hands of different people

  • The drop distances are not measured accurately enough

22a
Sme Calculator
3 marks

The nervous system allows humans to respond to their surroundings.

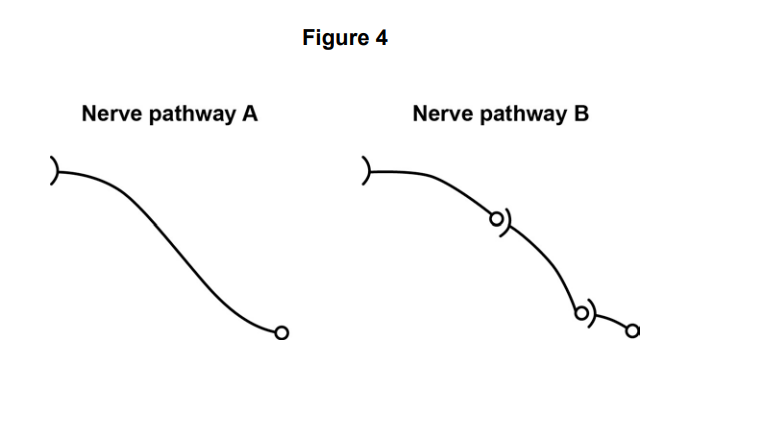
Figure 4 shows two nerve pathways.

Figure showing nerve pathway A as a single curved line, and pathway B as a similar line with two branching points ending in small open circles

Nerve pathway A is 92 cm long.

A nerve impulse travels along pathway A at 76.2 m/s.

Calculate how long it takes for the nerve impulse to travel the length of the pathway.

Use the equation:

distance=speed×time

Time = __________s

22b
3 marks

Nerve pathways A and B are the same length.

The nerve impulse takes longer to travel along pathway A than along pathway B.

Use Figure 4 to explain why.

22c
1 mark

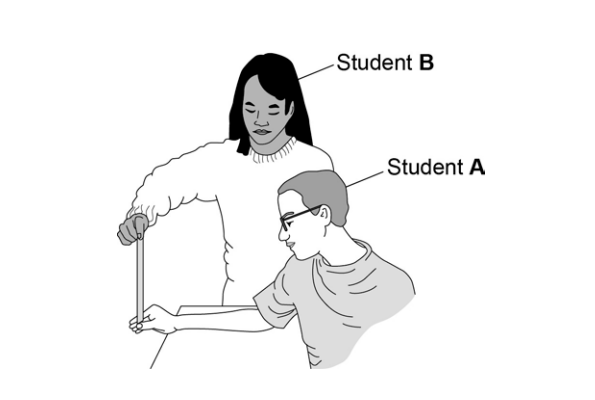
Two students compare their reactions using a ruler.

Method used:

  1. Student A sits with his elbow on a table top.

  2. Student B holds the ruler so the bottom of the ruler is level with the top of student A's thumb.

  3. Student B drops the ruler.

  4. Student A catches the ruler.

  5. Record the drop distance.

  6. Repeat steps 1 to 5 four more times.

  7. Repeat the whole experiment with student A dropping the ruler and student B catching it.

Illustration of Student A sitting with arm outstretched while Student B stands, holding a vertical ruler near A’s hand for a classroom experiment

Both students are right-handed.

Student A uses his right hand to catch the ruler.

Student B uses her left hand to catch the ruler.

Table 2 shows the students' results.

Table 2

Student

Drop distance in mm

Test 1

Test 2

Test 3

Test 4

Test 5

Student A – right hand

203

167

140

156

163

Student B – left hand

230

211

279

215

264

What is the range of student A's results?

22d
3 marks

The students are testing the hypothesis:

The drop distance of the ruler is smaller when a right-handed person uses their right hand to catch the ruler.

The students' results in Table 2 are not a good test of the hypothesis.

Suggest what the students should have done to test the hypothesis.

22e
Sme Calculator
4 marks

Student A's mean reaction time was 0.19 s.

Mean reaction time can be calculated using the equation:

Mean reaction time=2×drop distance (m)9.8

Calculate the mean reaction time for Student B.

Give your answer to two significant figures.

Student B's results are repeated here to help you answer the question.

Drop distance in mm

Test 1

Test 2

Test 3

Test 4

Test 5

Student B – left hand

230

211

279

215

264

Mean reaction time = _______________s

23a
1 mark

Funnel-web spiders produce poison to kill prey.

The poison enters the prey when the spider bites the prey.

The poison contains a protein.

What is a protein?

Tick (✓) one box.

  • A chain of glucose molecules

  • A long chain of amino acids

  • A small insoluble molecule

23b
1 mark

What reagent is used to test for protein?

24a
1 mark

This question is about the nervous system.

A person steps on a sharp object. The person immediately moves their foot away from the object.

The response is a pain withdrawal reflex.

Describe two ways that a reflex action is different from a conscious action.

24b
6 marks

Describe how the nervous system causes the reflex action after stepping on the sharp object.

24c
1 mark

Table 1 shows information about two types of reaction time.

Table 1

Description

Example

Simple reaction time (SRT)

Time taken to respond to a predictable event.

A runner starting a race when there is a sound signal.

Choice reaction time (CRT)

Time taken to respond when a decision about how to respond is needed.

Deciding which team member to throw a ball to.

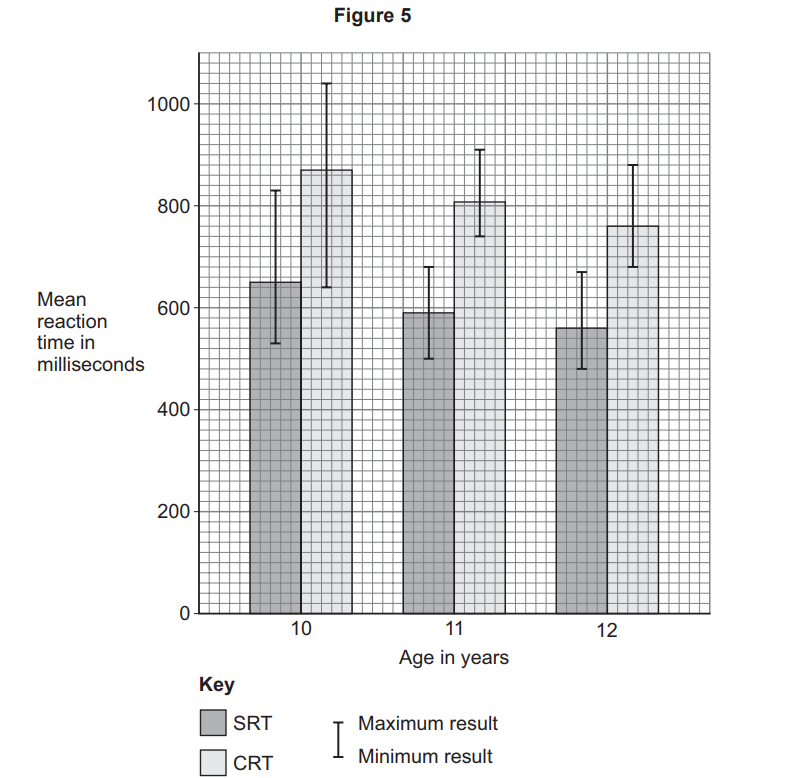
Scientists investigated how the age of students affects SRT and CRT.

Figure 5 shows the results

Bar chart (Figure 5) showing mean simple and choice reaction times with error bars for 10–12-year-olds; reaction times decrease slightly with age.

In the investigation the sex, physical health and mental health of the students were control variables.

Suggest one other control variable the scientists should have used.

24d
Sme Calculator
3 marks

Determine the size of the range of CRT for students aged 11 years.

Give your answer in seconds.

Size of range = __________seconds

24e
2 marks

A student stated:

'The age of students affects their reaction time.'

Evaluate the student's statement.

Use Figure 5.

25
1 mark

What is the function of blood vessel C? (C is the pulmonary vein from the lungs.)

Tick one box.

  • To take blood from the heart around the body

  • To take blood from the body to the heart

  • To take blood from the heart to the lungs

  • To take blood from the lungs to the heart

26a
1 mark

A student investigates the rate of respiration in maggots.

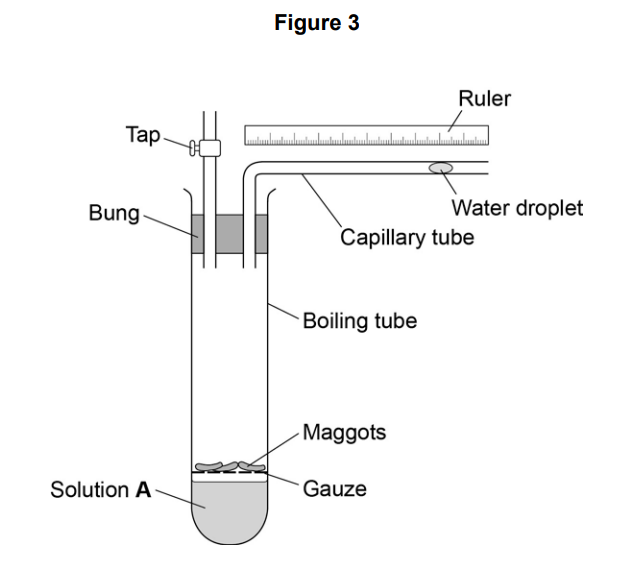
Figure 3 shows the equipment he uses.

Diagram of a boiling tube respirometer with maggots over gauze above solution A, bung and tap connected to a capillary tube, water droplet and ruler.

Why does the student put the maggots on gauze?

26b
4 marks

When maggots respire they take in a gas from the air and release a different gas.

Solution A absorbs the gas released.

At the start of the investigation the student records the distance of the water droplet from the bend in the capillary tube.

Explain what happens to the water droplet as the maggots respire.

26c
1 mark

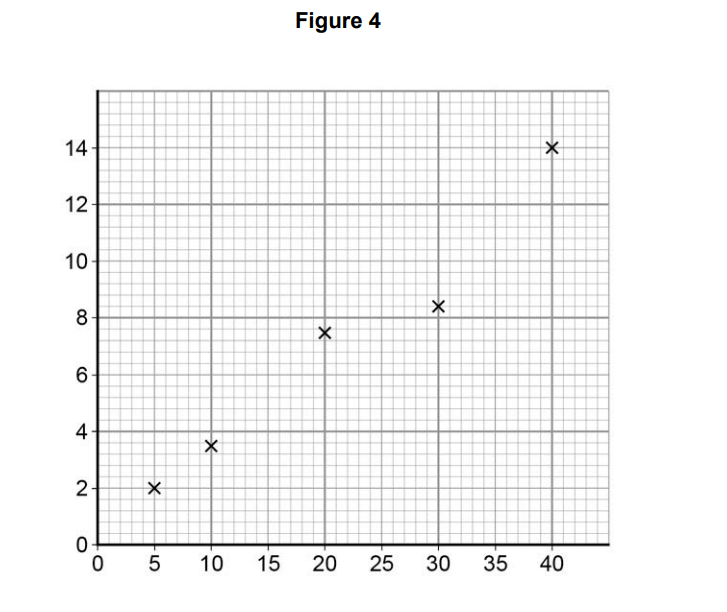
Table 1 shows the results the student calculated.

Table 1

Temperature in °C

Rate of respiration in units

5

2.2

10

3.5

20

7.5

30

8.4

40

14.0

The student uses his results to plot the graph in Figure 4.

Label the x and y axis.

Scatter graph titled “Figure 4” with five plotted crosses rising from left to right on an unlabeled grid, showing a positive relationship between x and y.
26d
1 mark

How could the student find out if the result at 30 °C is anomalous?

26e
1 mark

Suggest what the value at 30 °C should be to fit the pattern of the graph.

27a
2 marks

Funnel-web spiders produce a poison to kill prey.

The poison enters the prey when the spider bites the prey.

The poison contains a protein.

A scientist tested the spider poison for protein.

Describe the test for protein and the colour change that would be seen when the poison is tested.

Description of test: ________

Colour change from ________ to ________

27b
2 marks

Animals produce protease enzymes.

Explain why protease enzymes do not protect animals that are bitten by funnel-web spiders.

28a
1 mark

Hormones are released from glands.

Which gland produces hormones to control other glands in the endocrine system?

Tick one box.

  • Adrenal

  • Ovary

  • Pituitary

  • Thyroid

28b
Sme Calculator
2 marks

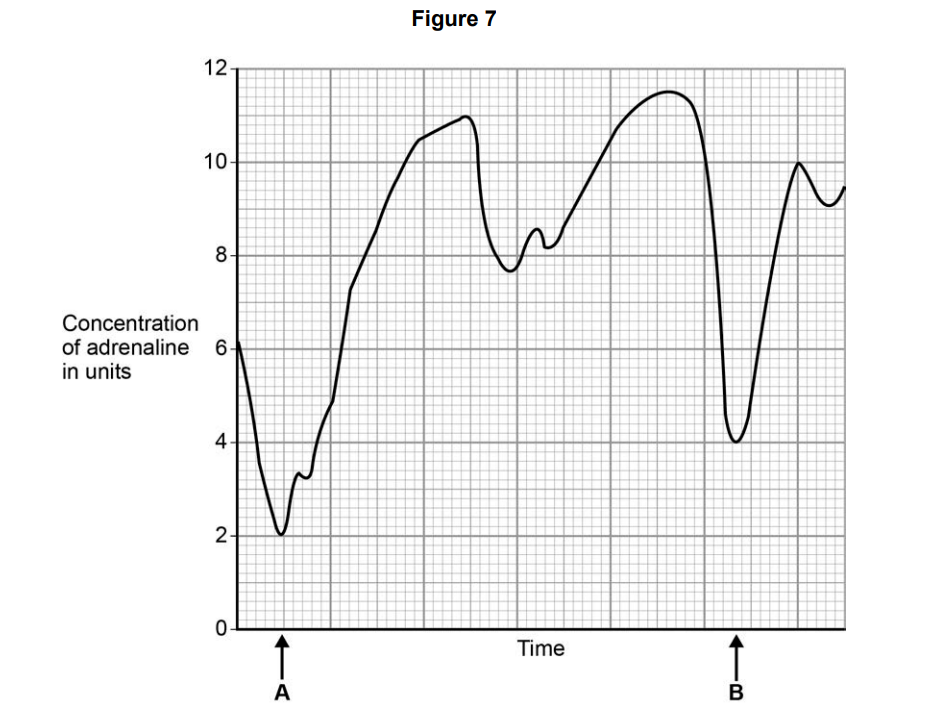
Figure 7 shows the level of adrenaline in a man's bloodstream while he was watching a 12-minute film.

Line graph of adrenaline concentration against time, showing irregular rises and falls, with marked points A early and B later on the time axis.

Calculate the percentage increase in adrenaline after point B.

Percentage increase in adrenaline =______

28c
2 marks

Suggest why the percentage increase in adrenaline after point B is different from the percentage increase after point A.

28d
2 marks

Adrenaline causes changes in the body to prepare for a 'fight or flight' response.

What changes in the man's body are caused by adrenaline?

29
1 mark

A person is given a measles vaccination by injection.

There is a small amount of bleeding from the wound.

What is the role of platelets after the person receives the injection?

Tick (✓) one box.

  • To begin phagocytosis

  • To cause the blood to clot

  • To release antitoxins

30a
2 marks

Red blood cells contain haemoglobin.

Describe how the shape and internal cell structure of a red blood cell are adaptations to its function.

Shape: _____________

Internal cell structure: _______

30b
3 marks

Explain why a high concentration of carbon monoxide in the air causes a person to become seriously ill.