Fertilisers used by farmers can accidentally enter lakes.
In 2016, Natural Resources Wales reported that 12 lakes contained high levels of nitrates from fertilisers.
Suggest how the fertilisers accidentally entered these lakes.
Students used a computer to model the effect of fertiliser on dissolved oxygen content and bacteria numbers in a lake, after adding fertiliser.
The results are shown in Graph 2.1.
Graph 2.1
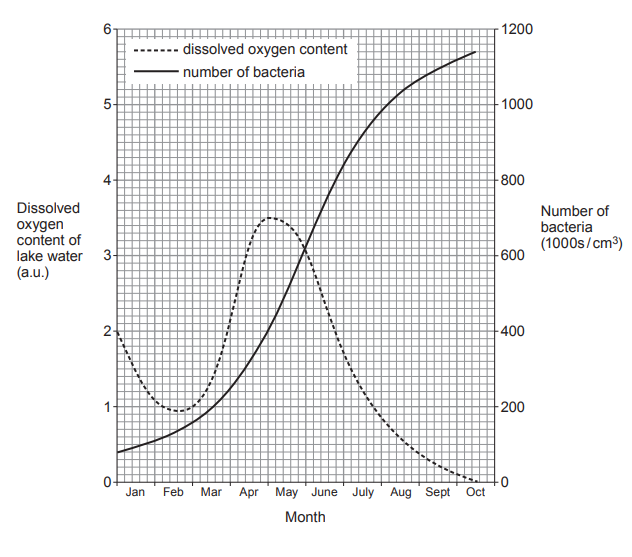
(i) Calculate the percentage increase in dissolved oxygen from the start of March to the start of May.
[2]
Increase = ................................... %
(ii) Explain why the dissolved oxygen content and number of bacteria change from May to September.
[3]
(iii) Suggest why the increase in the number of bacteria was slow in January and February.
[1]
Was this exam question helpful?
![[Figure: Photo of people harvesting kelp from the shore in Canada]](https://cdn.savemyexams.com/cdn-cgi/image/f=auto,width=3840/https://cdn.savemyexams.com/uploads/2026/08/32247-4b.png)
![Image 7.1 – Intensively farmed chickens
[Figure: photograph of intensively farmed chickens kept closely together in a shed]
Image 7.2 – Free-range chickens
[Figure: photograph of free-range chickens with access to outdoor space]](https://cdn.savemyexams.com/cdn-cgi/image/f=auto,width=3840/https://cdn.savemyexams.com/uploads/2026/08/60548-7-1.png)
![[Figure: Map of Europe showing rivers and canals (Danube, Rhine, Rhone, Loire, Seine, Ludwig Canal, Dnieper, Don, Black Sea, English Channel) where killer shrimp are found, with dates when they were first recorded at various points along each waterway]](https://cdn.savemyexams.com/cdn-cgi/image/f=auto,width=3840/https://cdn.savemyexams.com/uploads/2026/09/19724-8b.png)
![[Figure: news photograph showing dark red "red tide" waters off the coast of Florida]](https://cdn.savemyexams.com/cdn-cgi/image/f=auto,width=3840/https://cdn.savemyexams.com/uploads/2026/08/17576-6.png)
![[Figure: Image 3.1 — a marine food web diagram showing plant plankton, animal plankton, sand eels, shrimps, large fish, puffins, skua and gulls with arrows showing feeding relationships]](https://cdn.savemyexams.com/cdn-cgi/image/f=auto,width=3840/https://cdn.savemyexams.com/uploads/2026/08/42733-3-1.png)
![[Figure: Photograph of Skomer Island, source: walesonline.co.uk]](https://cdn.savemyexams.com/cdn-cgi/image/f=auto,width=3840/https://cdn.savemyexams.com/uploads/2026/08/12828-3-c.png)
![[Figure: Image 3.1 — a pyramid of biomass with five trophic levels (Trophic Level 1 at the base to Trophic Level 5 at the top), with Trophic Level 1 labelled 100% and Trophic Level 2 labelled 10%, and Trophic Levels 3, 4 and 5 labelled with blank percentages]](https://cdn.savemyexams.com/cdn-cgi/image/f=auto,width=3840/https://cdn.savemyexams.com/uploads/2026/08/56094-3-1.png)
![[Figure: Photograph of three types of lichen — bushy, leafy and crusty]](https://cdn.savemyexams.com/cdn-cgi/image/f=auto,width=3840/https://cdn.savemyexams.com/uploads/2026/08/30414-4a.png)
![[Figure: A drawing showing wood A on the west side and wood B on the east side, separated by a factory, with an arrow showing the usual direction of wind blowing from west to east]](https://cdn.savemyexams.com/cdn-cgi/image/f=auto,width=3840/https://cdn.savemyexams.com/uploads/2026/08/33932-4b.png)
![[Figure: Photograph of an aphid on a plant stem]](https://cdn.savemyexams.com/cdn-cgi/image/f=auto,width=3840/https://cdn.savemyexams.com/uploads/2026/08/36311-3a.png)
![[Figure: Map 1 showing the east coast of the USA, with New York and New Jersey labelled, together with the locations of the former '12-Mile Site', the former '106-Mile Industrial Waste Site', and the '106-Mile Site' in the Atlantic Ocean. (All data from the US Environmental Protection Agency Report to Congress, Sept 1995)]](https://cdn.savemyexams.com/cdn-cgi/image/f=auto,width=3840/https://cdn.savemyexams.com/uploads/2026/08/13105-8a.png)
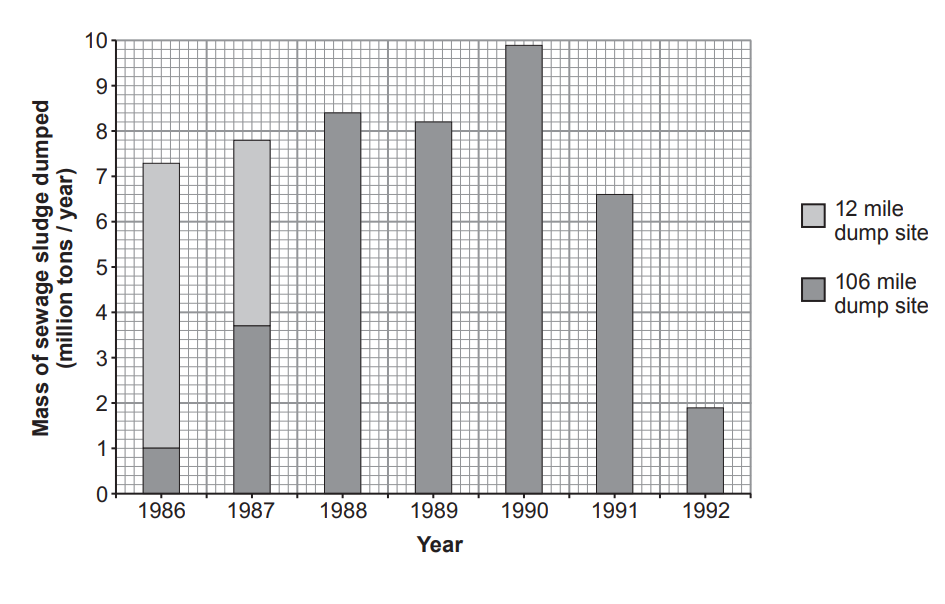
![[Figure: Graph showing the annual disposal of sewage sludge (in million tons/year) at the '12 mile' and '106 mile' dump sites from 1986 to 1992]](https://cdn.savemyexams.com/cdn-cgi/image/f=auto,width=3840/https://cdn.savemyexams.com/uploads/2026/08/64048-8ai.png)
![[Figure: Map 2 showing the movement of drifting buoys tracked by satellite from the '106-Mile Site', with New York, New Jersey, and the former '12-Mile Site' also labelled]](https://cdn.savemyexams.com/cdn-cgi/image/f=auto,width=3840/https://cdn.savemyexams.com/uploads/2026/08/22977-8aiii.png)
![[Figure: Chart showing indicator species (Mayfly nymph, Caddis fly larva, Freshwater shrimp, Stonefly nymph, Hoglouse, Bloodworm, Worm (Tubifex), Rat-tailed maggot) grouped into pollution level groups A-E: Group A = little or no pollution, Group B = slight pollution (if none from A), Group C = medium pollution (if none from A or B), Group D = high pollution (if none from A, B or C), Group E = very high pollution (no live animals found)]](https://cdn.savemyexams.com/cdn-cgi/image/f=auto,width=3840/https://cdn.savemyexams.com/uploads/2026/09/45162-6aii.png)
![[Figure: Bar graph titled 'Graph showing the number of indicator species found in each of the streams 1, 2 and 3', showing number of indicator species (y-axis, 0-1000) for Mayfly nymph, Stonefly nymph, Caddis fly larva, Freshwater shrimp, Hoglouse, Bloodworm, Worm (Tubifex), and Rat-tailed maggot (x-axis), with separate bars for Stream 1, Stream 2, and Stream 3]](https://cdn.savemyexams.com/cdn-cgi/image/f=auto,width=3840/https://cdn.savemyexams.com/uploads/2026/09/28651-6aiii.png)
![[Figure: Food web diagram for a woodland showing oak trees, trees and bushes, herbs (trophic level A - producers) connected to beetles, insects, moths, other leaf eaters (trophic level B - primary consumers), connected to shrews, voles, small birds (trophic level C - secondary consumers), connected to owls, weasels (trophic level D - tertiary consumers)]](https://cdn.savemyexams.com/cdn-cgi/image/f=auto,width=3840/https://cdn.savemyexams.com/uploads/2026/09/58856-3a.png)
![[Figure: Pyramid of numbers (numbers / 0.1 hectare) and pyramid of biomass (grams / 0.1 hectare) for a food chain in this food web. The pyramid of numbers shows trophic level A as a very large number of individuals despite representing very few actual organisms in the pyramid of biomass, where trophic level A has a biomass of 5 139 000 g/0.1 hectare and trophic level B has a biomass of 2 500 g/0.1 hectare]](https://cdn.savemyexams.com/cdn-cgi/image/f=auto,width=3840/https://cdn.savemyexams.com/uploads/2026/09/44479-3aii.png)