Response & Regulation (WJEC GCSE Science (Double Award): Biology): Exam Questions

Exam code: 3430

3 hours21 questions
1a
1 mark

Year 11 students investigated the effect of age on reaction time. They used the following method:

  • Five teachers of different ages were selected.

  • Each teacher sat at a computer waiting for the letter X to appear on the screen.

  • When the X appeared, the teacher pressed the space bar.

  • The time taken for each teacher to react was recorded by the computer.
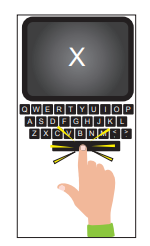
Child’s hand pressing the X key on a cartoon keyboard, matching the large letter X displayed on a computer screen above

The results are shown in Graph 4.

Graph 4
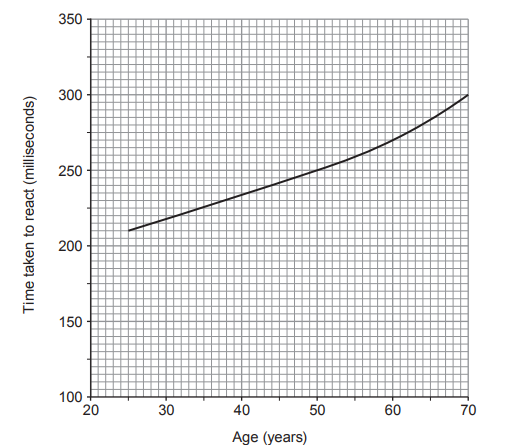
Line graph showing reaction time increasing from about 210 ms at age 25 to about 300 ms at age 70, indicating slower reactions with older age.

State the conclusion that can be made from the results shown in Graph 4.

1b
2 marks

State two variables that should have been controlled to make this a fair test.

1.

2.

1c
1 mark

State what the students should do to have more confidence in their results.

1d
4 marks

(i) State the stimulus being detected in this investigation.

[1]

..........

(ii) State how information travels along neurones.

[1]

..........

(iii) State the two parts of the central nervous system.

[2]

  1. ..........

  2. ..........

2a
4 marks

Diabetes is a condition that causes a person's blood glucose level to become too high. The percentage of the Welsh population that were being treated for diabetes between 2014 and 2020 is shown in Table 6.1.

Table 6.1

Year

Percentage of Welsh population being treated for diabetes

2014

5.4

2015

5.6

2016

5.7

2017

5.9

2018

6.0

2019

6.1

2020

6.2

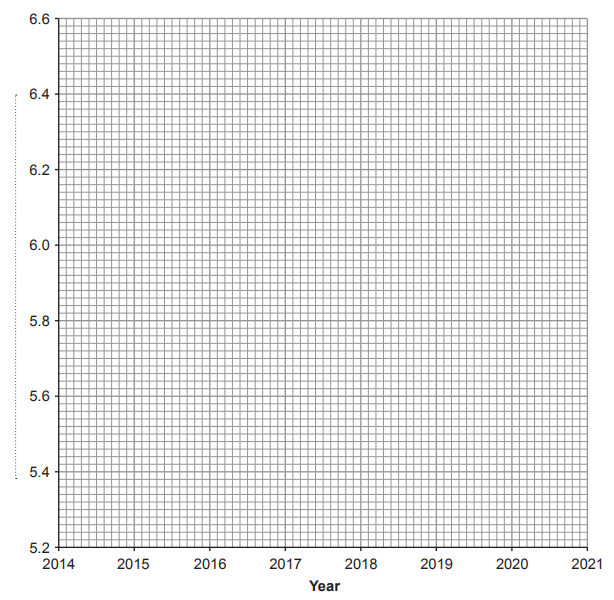
Use the data in Table 6.1 to complete Graph 6.2 by:

[4]

(i) Labelling the y axis;

(ii) Plotting the points;

(iii) Using a ruler to join the plots.

Graph 6.2

Blank grid chart titled “Year”, with x‑axis from 2014 to 2021 and y‑axis from 5.2 to 6.6, showing no data points or plotted lines
2b
4 marks

(i) Describe the trend shown in Graph 6.2.

[1]

..........

(ii) If the trend shown between 2019 and 2020 continued, estimate the percentage of the population that was treated for diabetes in 2021. Extend your line on Graph 6.2 to show how you reached this answer.

[2]

Percentage = ..........

(iii) Suggest one reason why the percentage of people being treated for diabetes is lower than the actual percentage of people who have diabetes.

[1]

..........

2c
1 mark

State the name of the hormone that lowers the blood glucose level.

..........

2d
3 marks

(i) Describe the chemical test you would use in a school laboratory to test a urine sample for the presence of glucose. You do not need to include the result in your answer.

[2]

..........

(ii) Suggest a colour that would be observed if a sample of urine from a diabetic was tested for the presence of glucose.

[1]

..........

3a
2 marks

Draw straight lines to join each sense organ to the stimulus it detects.

One has been done for you.

[Figure: Original layout shows the sense organs (nose, tongue, ear, eye) and stimuli (sound, chemicals in the air, light, chemicals in food and drink) as two columns joined by straight lines, with ear–sound already joined as the example]
3b
3 marks

Complete the following sentences using words from the box.

brain

reflex

electrical

spinal cord

neurone

The central nervous system is made up of the .............................................. and .............................................. .

The type of response shown by the body which is fast, automatic and often protective is called a .............................................. action.

4
6 marks

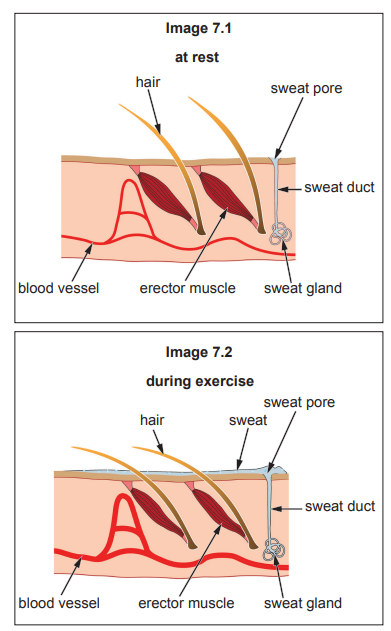
When we exercise, our body temperature rises and must be brought down. Images 7.1 and 7.2 show the appearance of the structures present in the skin of an athlete at rest and during exercise.

Two skin cross-sections compare at rest and during exercise, labelling hair, erector muscle, blood vessels, sweat glands, ducts and pores with sweat on skin

Use Image 7.1 and Image 7.2 to describe some changes that take place in the structures in the skin during exercise.

Explain how changes in blood flow and sweat production help cool the athlete down when exercising.

5a
2 marks

Image 5.1 shows a reflex arc.

Image 5.1

[Figure: diagram of a reflex arc showing the spinal cord and the neural pathway from a receptor through sensory, relay and motor neurones to an effector, labelled "spinal cord"]

On Image 5.1 of the reflex arc label:

(i) the sensory neurone;

[1]

(ii) the effector.

[1]

5b
2 marks

State two properties of a withdrawal reflex action.

1.

2.

5c
7 marks

A group of Year 11 students carried out an experiment to measure reaction time. The group was divided into five pairs of students (Pairs A to E). One member of each pair (the holder) held a 30 cm ruler with the 0 cm reading between the index finger and thumb of the other member (the catcher). This is shown in Image 5.2.

Also shown in Image 5.2 is a Reaction Timer – Distance to Time Converter.

Image 5.2

[Figure: diagram of the ruler-drop reaction time experiment, showing a person's hand holding a ruler above another person's hand positioned to catch it, alongside a Distance to Time Converter scale for converting the ruler-drop distance into a reaction time in seconds]
  • The holder would, without warning, release the ruler and the catcher should catch it as quickly as possible.

  • The distance the ruler fell was read against the top surface of the catcher's thumb.

  • This was repeated a further 4 times for each pair of students.

  • The distance the ruler fell was converted to a reaction time by reading off the time, in seconds, on the Distance to Time Converter.

The results are recorded in Table 5.3.

Table 5.3

Reading

Pair A

Pair B

Pair C

Pair D

Pair E

Distance (cm)

Time (s)

Distance (cm)

Time (s)

Distance (cm)

Time (s)

Distance (cm)

Time (s)

Distance (cm)

Time (s)

1

15

0.18

19

0.20

27

0.24

15

0.18

21

0.21

2

12

0.16

19

0.20

27

0.24

12

0.16

17

0.19

3

11

0.15

15

0.18

25

0.23

9

0.14

15

..........

4

11

0.15

12

0.16

23

0.22

27

0.24

..........

0.15

5

9

0.14

11

0.15

19

0.20

7

0.12

8

0.13

Mean

12

0.16

15

0.18

24

0.23

14

0.17

..........

..........

(i) Complete the distance and time columns for Table 5.3 by reading off the Distance to Time Converter and calculating the means for both the distance and time for Pair E.

Space for working

[3]

(ii) I. Identify the anomalous reading in Table 5.3 for Pair D and give its value below.

[1]

Anomalous reading: .......... cm

II. Suggest one reason for this anomalous reading.

[1]

(iii) State which of the Pairs A – D had the fastest mean reaction time.

[1]

(iv) State the effect of repeat readings on speed of reactions.

[1]

5d
2 marks

Coffee contains caffeine, which is a natural stimulant. The students extended their experiment by investigating the effect of drinking coffee on reaction times. The students wanted to make sure that their investigation into the effects of caffeine was a fair test.

Suggest two variables the students should have controlled to ensure a fair test.

1.

2.

6a
3 marks

Image 2.1 shows a section through the human skin.

Image 2.1

![[Figure: Image 2.1 — a cross-section diagram of human skin with three unlabelled structures A, B and C pointed to by lines, along with a hair, sweat duct and sweat pore]](https://cdn.savemyexams.com/uploads/2026/08/37432-2.png){width=579 height=300}

A ...............................................................

B ...............................................................

C ...............................................................

Label parts A, B and C on Image 2.1 using words from the box.

sweat duct

blood vessel

erector muscle

sweat pore

hair

sweat gland

6b
1 mark

State one way the skin reacts to cool us down when we get too hot.

7a
3 marks

Geraint is reading a book.

Young man in a hooded jacket sits against a tree in a green forest, reading an old book on his lap, surrounded by moss and soft natural light

Complete the following sentences by choosing the correct words from the list below.

[3]

signals

receptors

impulses

messages

neurones

Geraint's eyes have ....................................................... that detect light reflected from the book.

Information about the light is turned into ....................................................... which travel to the brain along nerve cells called ....................................................... .

7b
5 marks

Scientists investigated the effect of drinking alcohol on the speed and accuracy of reading a paragraph of text.

The scientists took 24 men and split them into two groups, A and B.

  • The men in group A each drank 500 cm3 of beer containing 5 % alcohol.

  • The men in group B each drank 500 cm3 of non-alcoholic beer.

  • Both groups were then given a piece of text to read out loud.

  • The time taken to read the text and the number of errors made were recorded.

  • The means for each group were then calculated.

The results are shown in Table 3.

Table 3

Group

Mean time to complete the reading (s)

Mean number of errors

A

65

3

B

58

0

(i) State two conclusions that you can make from the results about the effect of alcohol on reading.

[2]

Conclusion 1 ..........................................

Conclusion 2 ..........................................

(ii) State two ways in which the method shown made sure the men in group A each drank the same amount of alcohol.

[2]

1.

2.

(iii) Group B is the control. Explain the importance of the control group in this investigation.

[1]

8a
2 marks

State the meaning of the term hormone.

8b
9 marks

The glucose, insulin and glucagon levels in the blood of a non-diabetic were monitored over an 8 hour period. Graph 7 shows the results.

Graph 7

[Figure: line graph, x-axis "Time (hours)" 0 to 8, y-axis "Level of substance (arbitrary units)" 0 to 170; three lines plotted for glucose, insulin and glucagon, with glucose and insulin fluctuating together between roughly 70 and 110 arbitrary units, and glucagon rising during the 1st hour then falling as glucose/insulin rise after a meal]

(i) Suggest what the band running across Graph 7 between 70 and 110 arbitrary units represents.

[1]

(ii)

I. Use Graph 7 to describe the relationship between the level of insulin and glucose in the blood.

[1]

II. Name the homeostatic mechanism, occurring in the body, which maintains this relationship.

[1]

(iii) Explain why the glucagon level rises during the 1st hour of the monitoring.

[3]

(iv) A high carbohydrate meal was eaten during this investigation. Use Graph 7 to identify the time at which the meal was eaten. Tick (√) one box below to indicate your answer.

[1]

At:

1 h

2 h

3 h

4 h

5 h

6 h

7 h

8 h

...........

...........

...........

...........

...........

...........

...........

...........

(v) The results for a Type 1 diabetic would be different to those shown in Graph 7. Add labelled lines to Graph 7 to show how each of the following would appear in a Type 1 diabetic. Your lines must stay between the hours indicated below.

[2]

I. the glucose line between 2–4 hours

II. the insulin line between 1–4 hours

9a
2 marks

Image 7.1 shows a section through human skin.

Image 7.1

[Figure: diagram of a cross-section through human skin, unlabelled]

On Image 7.1, use arrows to label:

[2]

I. the sweat duct

II. a blood vessel

9b
6 marks

Scientists investigated the effect of air temperature on both the skin temperature and core body temperatures of five volunteers. Core body temperature is the temperature of the internal organs of the body.

  • The five volunteers were placed in a temperature controlled laboratory at −20 °C.

  • The volunteers wore bathing suits and were kept at the temperature for 5 minutes after which their skin and core temperatures were recorded.

  • The experiment was then repeated at other air temperatures over the next six days, each day at a different air temperature.

The skin temperatures at different air temperatures are shown in Table 7.2. The mean core body temperatures are shown on Graph 7.3.

Table 7.2

Air temperature (°C)

Skin temperature of volunteers (°C)

Mean skin temperature (°C)

Volunteer number

1

2

3

4

5

−20

21.4

22.0

22.6

21.8

21.5

21.9

−10

23.3

23.2

22.8

22.9

23.0

23.0

0

23.8

24.2

24.4

23.5

23.9

24.0

10

25.7

25.3

25.9

25.2

25.2

25.5

20

28.3

28.1

28.5

27.9

27.8

28.1

30

33.0

32.3

32.7

32.4

32.2

32.5

40

38.5

40.2

39.3

40.2

39.1

...........

(i) Complete Table 7.2 by calculating the mean skin temperature of the five volunteers at a temperature of 40 °C.

[1]

(ii) I. Plot the mean skin temperature against the left-hand y-axis on Graph 7.3. The first two points have been plotted for you.

[2]

II. Join the plots with a ruler.

[1]

The mean core body temperature is already plotted against the right-hand y-axis.

Graph 7.3

[Figure: line graph with x-axis "Air temperature (°C)" from −20 to 40, left-hand y-axis "Mean skin temperature (°C)" from 20 to 40, right-hand y-axis "Mean core body temperature (°C)" from 35 to 39; the mean core body temperature line is already plotted, and the first two mean skin temperature points (at −20°C and −10°C) are already plotted]

III. From Graph 7.3 determine the mean core body temperature when the air temperature is 25 °C.

[1]

Mean core body temperature when air temperature is 25 °C = .............................. °C

IV. From Graph 7.3 state the relationship between the skin temperature and the core body temperature.

[1]

9c
2 marks

(i) Place a tick (✓) in one of the boxes below to show the processes which occur in the skin when air temperature is low.

[1]

blood vessels constrict, sweating reduces, hairs lowered on skin surface, shivering occurs

blood vessels dilate, sweating reduces, hairs raised on skin surface, shivering occurs

blood vessels constrict, sweating reduces, hairs raised on skin surface, shivering occurs

blood vessels constrict, sweating increases, hairs raised on skin surface, shivering occurs

(ii) Place a tick (✓) in one of the boxes below to show the processes which occur in the skin when air temperature is high.

[1]

blood vessels dilate, sweating increases, hairs lowered on skin surface, shivering occurs

blood vessels dilate, sweating increases, hairs lowered on skin surface, no shivering

blood vessels constrict, sweating increases, hairs lowered on skin surface, no shivering

blood vessels dilate, sweating decreases, hairs lowered on skin surface, no shivering

10a
6 marks

Image 3.1 shows the homeostatic control of glucose levels in the blood of a person.

Image 3.1

[Figure: Image 3.1 — a flow diagram showing homeostasis of normal blood glucose level at the centre. On one side: blood glucose level increases → box 1 releases insulin into the blood → body cells absorb glucose → blood glucose level decreases → back to homeostasis. On the other side: blood glucose level decreases → box 2 releases glucagon into the blood → box 3 converts glycogen to glucose → blood glucose level increases → back to homeostasis]

(i) Complete the information in boxes 1, 2 and 3 in Image 3.1 by writing in the name of the organ responsible.

[3]

(ii) State the meaning of the term homeostasis.

[1]

(iii) Insulin and glucagon belong to a group of chemicals which are produced in one part of the body but carry out their function in another part of the body. State the name of this group of chemicals.

[1]

(iv) Image 3.1 shows that a fall in the level of glucose in the blood brings about a series of responses that result in its increase. State the name of this mechanism of control.

[1]

10b
6 marks

Anwen and Rhys were each given an identical volume and concentration of glucose solution to drink. The concentration of glucose and of insulin in their blood was measured at regular intervals over the following 150 minutes. The results are shown in Graph 3.2.

Graph 3.2

[Figure: Graph 3.2 — glucose and insulin in blood plasma (arbitrary units) plotted against time (0–150 minutes) for both Anwen and Rhys, showing four curves: Anwen glucose, Rhys glucose, Anwen insulin and Rhys insulin. Anwen's glucose curve starts higher, falls more slowly and does not return to the starting level; Anwen's insulin curve stays lower than Rhys's throughout]

(i)

I. Describe three pieces of evidence from Graph 3.2 which show that Anwen has diabetes.

1.

2.

3.

[3]

II. State whether Anwen has Type 1 or Type 2 diabetes and explain your answer.

[1]

(ii) State two ways in which diabetes can be treated.

1.

2.

[2]

11a
2 marks

The diagram shows a section through human skin.

[Figure: Diagram of a cross-section through human skin with arrows pointing to two unlabelled structures for the candidate to identify]

On the diagram, use arrows to label the:

I. sweat gland;

II. erector muscle.

11b
5 marks

Some GCSE students decided to investigate the effect of temperature on sweating.

This is their method.

Volunteers sat in a small room, the temperature of which could be finely controlled.

Strips of cobalt chloride paper were placed in small wire baskets which were held 2 mm above the surface of the skin of the arm of the volunteers.

Cobalt chloride paper turns from a blue to purple to pink colour in the presence of water vapour, as shown below.

[Figure: Diagram of a colour scale showing cobalt chloride paper changing from blue to purple to pink with increasing absorption of water vapour, labelled 'Colour standard']

The time taken for the cobalt chloride paper to change to the colour of the standard was recorded. The results are shown in the table below.

Volunteer No.

Room temp (°C)

Time taken for cobalt chloride paper to change to colour of standard (s)

Mean

Trial No. 1

Trial No. 2

Trial No. 3

1

15

363

387

376

375

2

20

321

304

309

311

3

25

287

289

265

280

4

30

221

230

202

218

5

35

187

176

167

...........

(i) Complete the table by calculating the mean time for volunteer number 5.

[2]

(ii) Using these results only, what conclusion can be drawn about the effect of temperature on sweating?

[1]

(iii) Alun, one of the boys in the class, said that 'we can also conclude, from the results, that the effect of temperature differs in different people'.

The rest of the class disagreed with this. State why they disagreed.

[1]

(iv) Explain why the final colour change of the cobalt chloride paper is compared with a standard.

[1]

11c
2 marks

Explain the source of the water vapour which turned the cobalt chloride paper pink.

12a
4 marks

James eats a meal that contains glucose. A datalogger was used to record James' blood glucose levels before, during and after the meal. The data are shown in Table 7.1.

Table 7.1

Time

Blood glucose level (a.u.)

12.00 midday

85

1.00 pm

80

2.00 pm

100

3.00 pm

125

4.00 pm

130

5.00 pm

105

6.00 pm

95

7.00 pm

85

Graph 7.2 shows the changes in James' blood glucose level. The normal blood glucose range is also shown.

Graph 7.2

[Figure: Graph 7.2 — James' blood glucose level (a.u., 60–200) plotted against time (12.00 midday to 7.00 pm), with a maximum normal blood glucose level line and a minimum normal blood glucose level line both shown, and the curve rising from 85 to a peak of 130 at 4pm then falling back to 85 by 7pm]

(i) Describe the trend shown in Graph 7.2 between 1.00 pm and 7.00 pm.

[2]

(ii) State the range of James' blood glucose level.

...................................................................................................

[1]

(iii) Suggest how Graph 7.2 would be different in a person with diabetes.

[1]

12b
3 marks

(i) People with diabetes may have glucose in their urine. Describe the chemical test that could be carried out to test for the presence of glucose.

[2]

(ii) State the result you would expect if James' urine was tested for the presence of glucose using this chemical test.

...................................................................................................

[1]

12c
1 mark

Glucose levels are controlled by hormones. State the name of the hormone that lowers blood glucose levels.

13
4 marks

Sarah produced the drawing below. It shows one of the blood cells she looked at under the microscope.

[Figure: Drawing of a white blood cell, with a line labelled A to A1 drawn across its width]

(i) Name the type of white blood cell shown in the drawing above.

..................................................................................................

[1]

(ii) The actual size of the white blood cell, across the line A – A1, was 20 µm (20 micrometres). There are 1000 µm in 1 mm.

I. Measure the length of the line A – A1 in the diagram above.

length of the line A – A1 = ......................... mm

[1]

II. Calculate how many times bigger Sarah's drawing is than the actual blood cell.

Magnification = × ........................

[2]

14a
2 marks

The diagram shows a section through the skin.

[Figure: Diagram of a cross-section through the skin, with structures X and Y labelled]

State the name of structures:

(i) X ............................................................

[1]

(ii) Y ............................................................

[1]

14b
8 marks

Carwyn investigated the control of body temperature.

He set up a model to demonstrate the action of sweat using the apparatus shown below.

[Figure: Diagram of two 250 cm3 conical flasks (A and B) each containing water and a thermometer through a cotton wool bung. Flask A is wrapped in dry towelling; Flask B is wrapped in towelling soaked in water]

At the start of the investigation, Carwyn added 250 cm3 of water at 80 °C to each flask. He then recorded the temperature of the water in both flasks at two minute intervals for ten minutes, as shown in the results table.

Time (minutes)

Temperature of water in flask A — dry towelling (°C)

Temperature of water in flask B — wet towelling (°C)

0

80

80

2

79

73

4

78

65

6

77

58

8

76

54

10

75

51

(i) Complete the graph of the results by:

I. plotting the points for flask B

II. using a ruler to join your plots.

[Figure: Grid with axes 'Temperature of flask (°C)' (y-axis, 0–90) against 'Time (min)' (x-axis, 0–10), with flask A's line already plotted]

[3]

(ii) In Carwyn's model, the towelling represents the skin surface.

Using the results from flask B, explain the effect of sweat on human body temperature.

[3]

(iii) Heat stroke is a condition in which body temperature becomes dangerously high.

Use the results from flask A to conclude why people who do not drink enough water during very hot weather may suffer heat stroke.

[2]

15
6 marks

Reaction time can be measured using the following method.

[Figure: Diagram showing an experimenter holding a 30 cm ruler above the open hand of a seated subject]
  1. The experimenter holds a 30 cm ruler just above the hand of the subject.

  2. The ruler is dropped.

  3. The subject then catches the ruler as quickly as possible.

  4. The distance travelled by the ruler between steps 2 and 3 gives a measure of reaction time.

You have two solutions of coffee, one with caffeine and one without (decaffeinated coffee).

Describe how you would test the effect of drinking coffee with caffeine on the reaction time of a class of 20 Year 11 students. Include at least two variables which should be kept the same in order to make it a fair test.

[You are not required to write out steps 1–4 above in your answer.]

16a
4 marks

Negative feedback mechanisms maintain optimum conditions inside the body.

(i) State what is meant by the term negative feedback.

[2]

(ii) State three factors that are controlled within the body to maintain optimum conditions.

....................................................................

....................................................................

....................................................................

[2]

16b
5 marks

Hypoglycaemia is a condition which occurs when blood glucose levels fall to a dangerously low concentration. The normal blood glucose range is between 4.0 and 7.5 mmol/l.

(i) Suggest two reasons which could cause the blood glucose level in a person with insulin-dependent diabetes to fall below 4.0 mmol/l.

[2]

(ii) Explain why a glucagon injection may be used to treat severe hypoglycaemia.

[3]

17a
2 marks

Give one harmful effect that may result from each of the following lifestyle choices.

(i) eating excess salt (sodium chloride)

(ii) smoking cigarettes

[2]

17b
6 marks

Many people who smoke cigarettes would like to stop.

One method aimed at helping people stop smoking is by using an e-cigarette as shown in the photograph.

[Figure: Photograph of a person's hand holding an e-cigarette]

In 2016, 838 young people living in Wales were asked about using an e-cigarette.

Some of those questioned were cigarette smokers who had tried using e-cigarettes to help them cut down or stop smoking tobacco. [ASH survey 2016]

The bar chart shows how trying e-cigarettes affected their cigarette smoking.

[Figure: Bar chart titled 'Effect on number of cigarettes smoked after trying e-cigarettes', showing percentage of people (y-axis, 0-40%) for four categories (x-axis): smoked fewer (approximately 25%), smoked more (approximately 5%), smoked the same (approximately 36%), and stopped smoking (approximately 34%)]

(i) How successful was using e-cigarettes in helping young people cut down or stop smoking? Use all the results in the bar chart to justify your answer.

[4]

(ii) The original sample involved 838 young people. A second survey is planned to include 10 000 people. Suggest two factors which should be considered in the selection of the people to take part in the second survey, to make it more representative of the population of Wales.

[2]

18a
4 marks

(i) Complete the following sentences about sense organs using some of the words from the list below.

impulses

signs

stimuli

messages

signals

Sense organs respond to specific ...................................................... by sending information in the form of ...................................................... which are carried to the central nervous system.

[2]

(ii) State the name of:

I. the specialised nerve cells that carry the information to the central nervous system;

..........................................................................

[1]

II. an organ that processes information received from sense organs.

..........................................................................

[1]

18b
5 marks

Jed investigated the hearing of some year 11 pupils and their teachers.

He asked 12 pupils and 12 teachers to say if they could hear a buzzer when he sounded it at each of five distances away from the two groups. The same buzzer was pressed for each person.

The results are shown in the table.

Distance from buzzer (m)

Number hearing buzzer

Year 11 pupils

Teachers

5

12

12

10

12

12

15

12

12

20

11

7

25

8

2

(i) Give one conclusion that Jed can make from this investigation.

[1]

(ii) State one way in which Jed's investigation is a fair test.

[1]

(iii) What else should Jed have done to make sure the investigation was a fair test?

[1]

(iv) Jed thought that increasing the sample size would improve his confidence in his conclusion.

Describe how Jed would increase the sample size in this investigation. Explain why it would improve his confidence in his conclusion.

[2]

19a
2 marks

Read the following article about diabetes.

In type 1 diabetes, the cells of the pancreas that make insulin are destroyed by cells of the immune system.

You are more likely to develop it, if diabetes runs in your family.

The immune system may be triggered to act on the pancreas by a virus, pollutants, or stress causing type 1 diabetes.

In type 2 diabetes, not enough insulin is produced or cells in the liver fail to respond to the insulin that is produced. It is more likely to occur if it runs in your family, but there are also several risk factors.

These include:

  • certain lifestyle choices

  • certain ethnic origins

  • age

Despite a rapid rise in the incidence of diabetes, there has been a 28% fall in the number of deaths from diabetes-related conditions in Wales between 2009 and 2013. This shows there has been some success in how diabetes has been managed but early diagnosis is vital.

A spokesperson for a charity promoting diabetes awareness in Wales said:

"Type 2 diabetes can be prevented, but there is no way of preventing type 1. Looking after your own health can reduce the risk of developing type 2 diabetes."

Use the above information and your own knowledge to answer the following questions.

(i) Give the reason why people at high risk of developing diabetes should be tested regularly.

[1]

(ii) Does the evidence given in the article support the claim that "type 2 diabetes can be prevented" in every individual? Give reasons for your answer.

[1]

19b
2 marks

Explain one way in which "looking after your own health can reduce the risk of developing type 2 diabetes".

19c
3 marks

Explain what would happen in the body if the "cells in the liver fail to respond to the insulin that is produced".

20
6 marks

Describe how excessive heat applied to the skin of the hand can result in rapid withdrawal of the hand.

(Diagrams will not gain credit)

21a
2 marks

In a study of physical fitness levels, experts analysed a survey of adults in which they were asked how much they had exercised in the previous four weeks.

The report of the survey, which involved 1615 people, claimed that 30% of the British population did no exercise.

Reported in Daily Telegraph 05/06/15

Using the above information, calculate the number of people in the survey who did no exercise.

Number of people = .............................................

21b
1 mark

Why was it important to use a large number of people in this survey?