State the meaning of the term variation and give its two main causes.
Image 6.1 shows a giraffe (Giraffa sp.) feeding on the leaves of a tree. Their height allows them to feed on the leaves both low down and high up in trees.
Image 6.1
![[Figure: photograph of a giraffe reaching up to feed on leaves high in a tree]](https://cdn.savemyexams.com/cdn-cgi/image/f=auto,width=3840/https://cdn.savemyexams.com/uploads/2026/08/5201-6-1.png)
Graph 6.2 shows the range of heights, in metres, of adult giraffes against the percentage of the population at each height range. Each giraffe was measured to the nearest 0.1 m.
Graph 6.2
![[Figure: bar graph showing percentage of giraffe population against height range categories from "Up to 4.7" through to "Over 6.5" metres, x-axis labelled Giraffe height (m), y-axis labelled % of population]](https://cdn.savemyexams.com/cdn-cgi/image/f=auto,width=3840/https://cdn.savemyexams.com/uploads/2026/08/2117-6-2.png)
(i) Name the type of variation shown in Graph 6.2.
[1]
(ii) Desertification is where a relatively dry area of land becomes a desert. It is caused by a variety of factors, such as climate change and global warming.
Since 1920 the Sahara Desert has increased in area by 10%, extending south by over 250 km. This southwards extension of the Sahara Desert is continuing at the present time. One effect of this is that trees become fewer and further apart.
![Image 6.3
[Figure: map of Africa showing the regions (in red) occupied by the different species of giraffe]
Image 6.4
[Figure: map of Africa showing the present area of the Sahara Desert and the predicted southwards extension of the desert]](https://cdn.savemyexams.com/cdn-cgi/image/f=auto,width=3840/https://cdn.savemyexams.com/uploads/2026/08/15209-6-3.png)
I. Suggest how the predicted southwards extension of the Sahara Desert would affect the distribution of the giraffe in Africa.
[1]
II. Explain, in terms of natural selection, how the southwards extension of the Sahara Desert would affect the height ranges of the giraffe. Include in your answer how Graph 6.2 would change.
[4]
Was this exam question helpful?
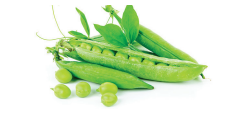
![[Figure: photograph of pea pods growing on pea plants]](https://cdn.savemyexams.com/cdn-cgi/image/f=auto,width=3840/https://cdn.savemyexams.com/uploads/2026/08/14604-2-1.png)
![![Figure: scattergraph grid with x-axis "Length of pod (cm)" (0-8) and y-axis unlabelled (0-7), with the first three points from Table 2.2 already plotted]](https://cdn.savemyexams.com/cdn-cgi/image/f=auto,width=3840/https://cdn.savemyexams.com/uploads/2026/08/25178-2-1-graph.png)
![[Figure: Sketch diagram comparing a male and female fruit fly (Drosophila melanogaster), showing distinguishing features between the sexes]](https://cdn.savemyexams.com/cdn-cgi/image/f=auto,width=3840/https://cdn.savemyexams.com/uploads/2026/09/36681-3a.png)
![[Figure: Photograph of a banded snail, Cepaea nemoralis]](https://cdn.savemyexams.com/cdn-cgi/image/f=auto,width=3840/https://cdn.savemyexams.com/uploads/2026/08/51084-8a.png)
![[Figure: Bar chart showing number of snails at each mass (y-axis, 0-70) for mass ranges from 10.0-10.9 g to 17.0-17.9 g (x-axis), with separate bars for Site A and Site B. Site A's distribution is centred around lower mass ranges; Site B's distribution is centred around higher mass ranges and is more spread out]](https://cdn.savemyexams.com/cdn-cgi/image/f=auto,width=3840/https://cdn.savemyexams.com/uploads/2026/08/11750-8aii.png)