1a2 marks

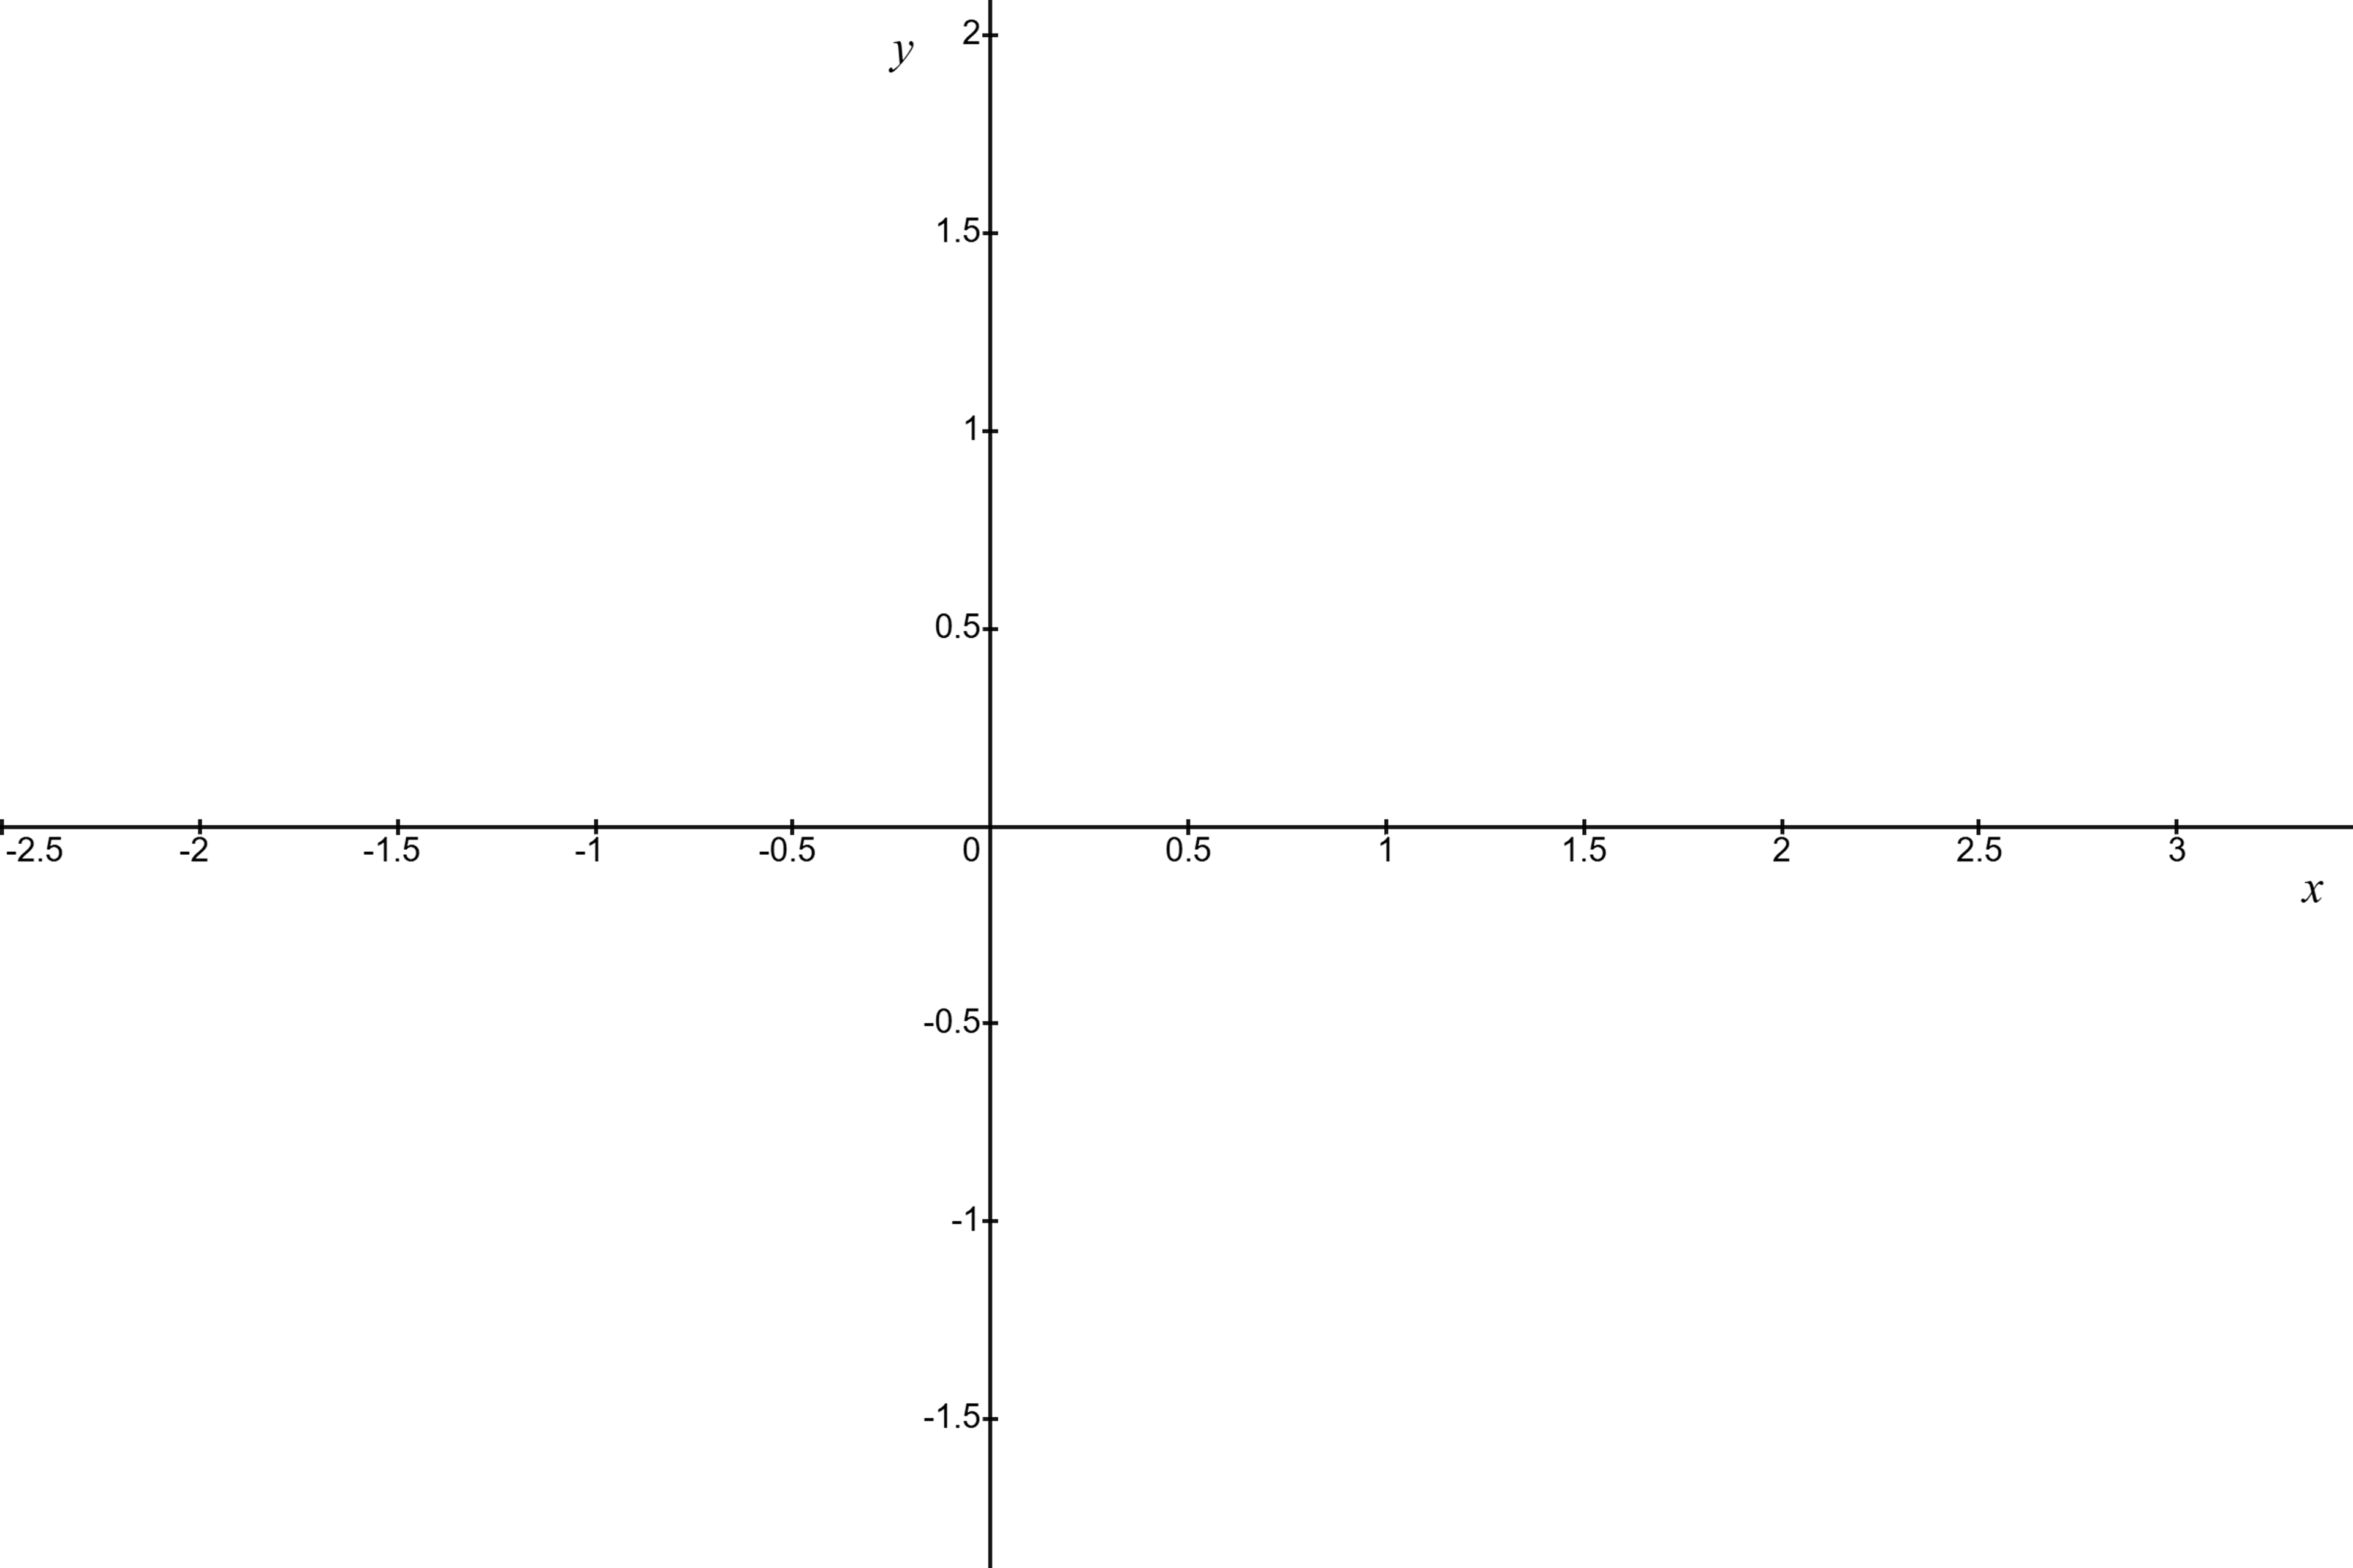
On the diagram, sketch the graph of for
1b2 marks
On the diagram, sketch the graph of for
1c1 mark
Find when
Was this exam question helpful?
Exam code: 0607
On the diagram, sketch the graph of for
On the diagram, sketch the graph of for
Find when
Was this exam question helpful?
Find the value of
.......................
Was this exam question helpful?

for
On the diagram, sketch the graph of .
Find the coordinates of the local maximum.
( ...................... , ......................)
Find the zeros of the graph of
Was this exam question helpful?

On the diagram, sketch the graphs of and for
Use your graphs to solve .
Use your graphs to solve .
Was this exam question helpful?
Use a graphical method to solve the inequality.
Show a sketch of the graph.
Was this exam question helpful?

for
On the diagram, sketch the graph of .
Find the coordinates of the local minimum point.
Write down the equations of the three asymptotes of the graph of .
The equation has no solutions.
Write down the range of values of .
By sketching another graph on the diagram, solve the equation for .
Was this exam question helpful?
A medicine delivery company uses drones to deliver medications to remote mountain villages.
A radar system is used to control the drones, as long as the controller is within a certain distance from the drone, called the radar visibility, metres,
A model for the radar visibility, metres, at different altitudes, metres up a particular mountain is
On the diagram, sketch the graph of against .

Find, correct to the nearest metre,
(i) the minimum visibility,
[1]
(i) the altitude for which the visibility is at its minimum.
[1]
Write down a reason why the visibility given by the model might be different to the actual visibility.
Was this exam question helpful?

for
On the diagram, sketch the graph of .
Write down the coordinates of the local maximum.
The equation has exactly 2 solutions.
Find the values of .
for
On the diagram, sketch the graph of .
Solve .
Was this exam question helpful?
The curve is drawn on a grid.
A line is drawn on the same grid.
The points of intersection of the line and the curve are used to solve the equation
Find the equation of the line in the form
..................................................
Was this exam question helpful?
On the diagram, sketch the graphs of and .
Solve.
Solve.
Find the coordinates of the minimum point of where .
Was this exam question helpful?
The graph of has one asymptote. The equation of the asymptote is .
Draw the graph of on your calculator. Use this to sketch the graph of on the axes provided.
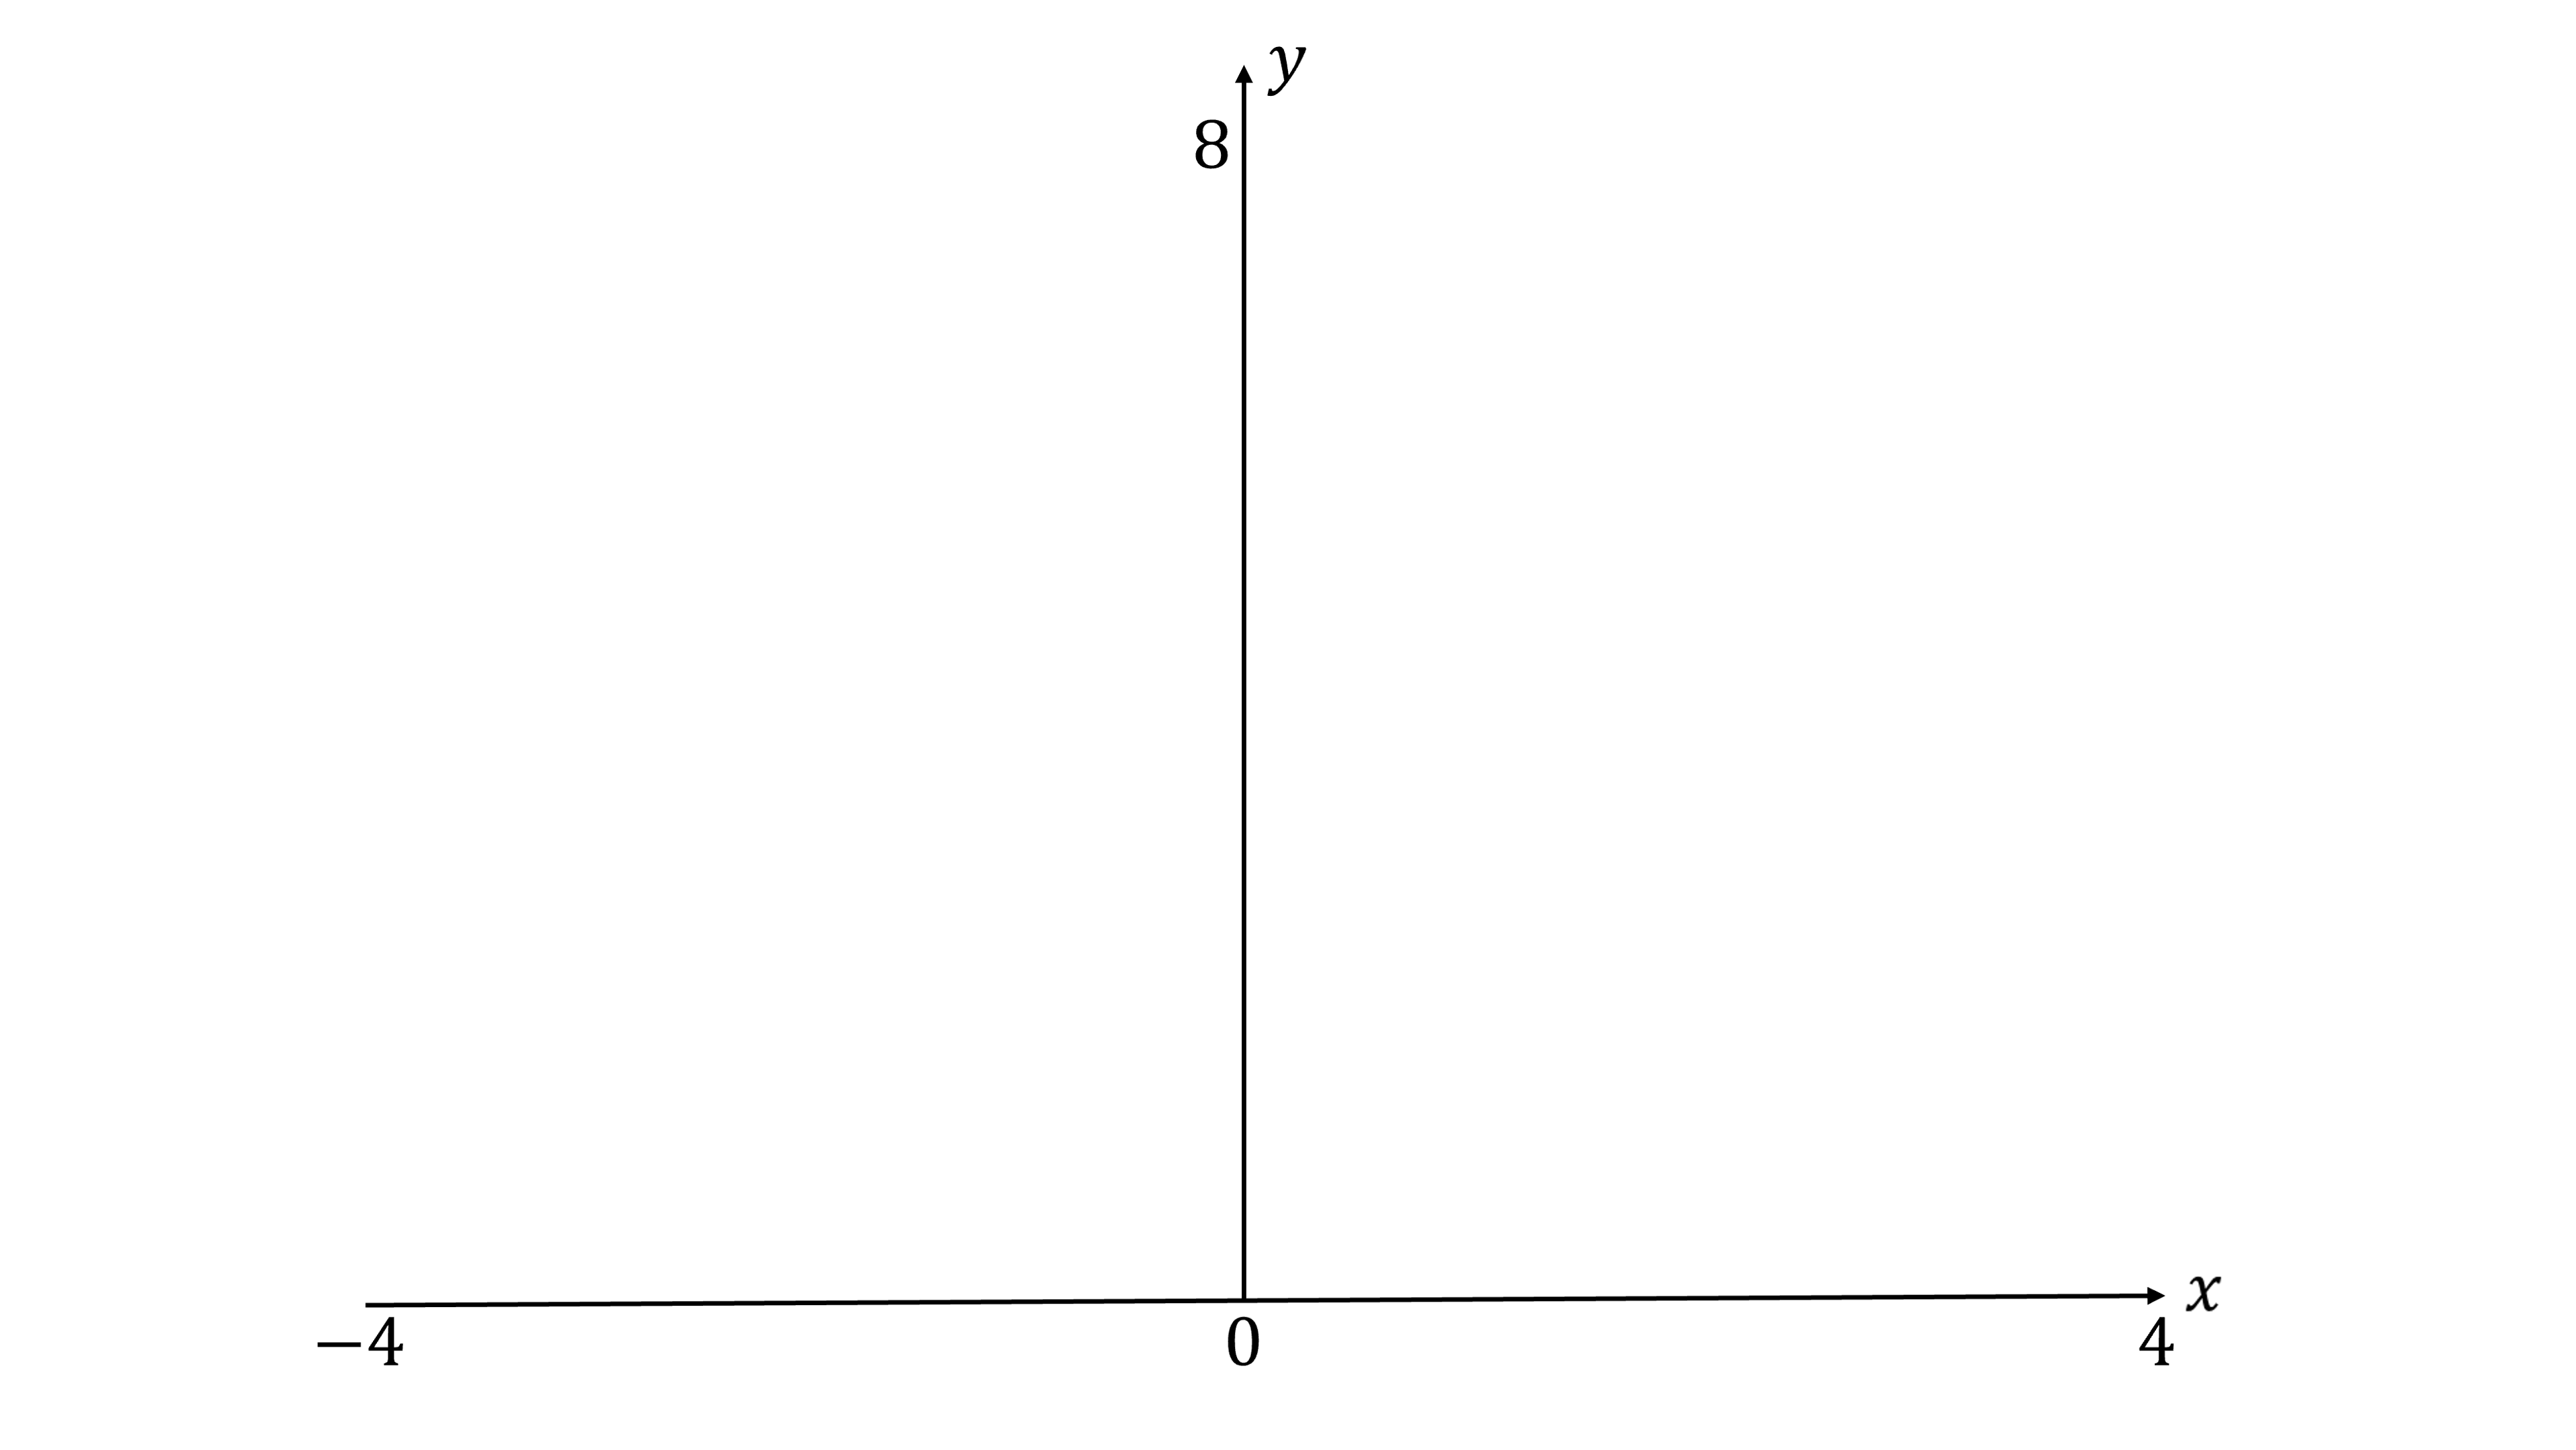
Label clearly the -intercept and the asymptote.
Solve the following equation.
Give your answers to 2 decimal places where appropriate.
Solve the following inequality.
The solutions in part (b) are also solutions to the equation below, where and are positive integers.
Find and .
Was this exam question helpful?

On the diagram sketch the graph of for values of between and
Write down the equations of the asymptotes parallel to the ‑axis.
Find the zeros of the graph of .
(i) On the diagram, sketch the graph of for
[1]
(ii) Use your graphs to solve .
[3]
(iii) Solve .
[3]
Was this exam question helpful?

On the diagram, sketch the graph of for
On the same diagram, sketch the graph of for
Solve for
Solve for
Was this exam question helpful?

Sketch the graph of for values of between and .
Write down the equations of the asymptotes parallel to the -axis.
(i) Find the coordinates of the local maximum.
(............ , ............) [2]
(ii) Find the coordinates of the local minimum.
(............ , ............) [2]
(iii) Write down the range of values of for which has exactly one solution.
[2]
(i) Solve the equation
[3]
(ii) Find the solutions to the inequality
[3]
Was this exam question helpful?
The graph of is shown below.
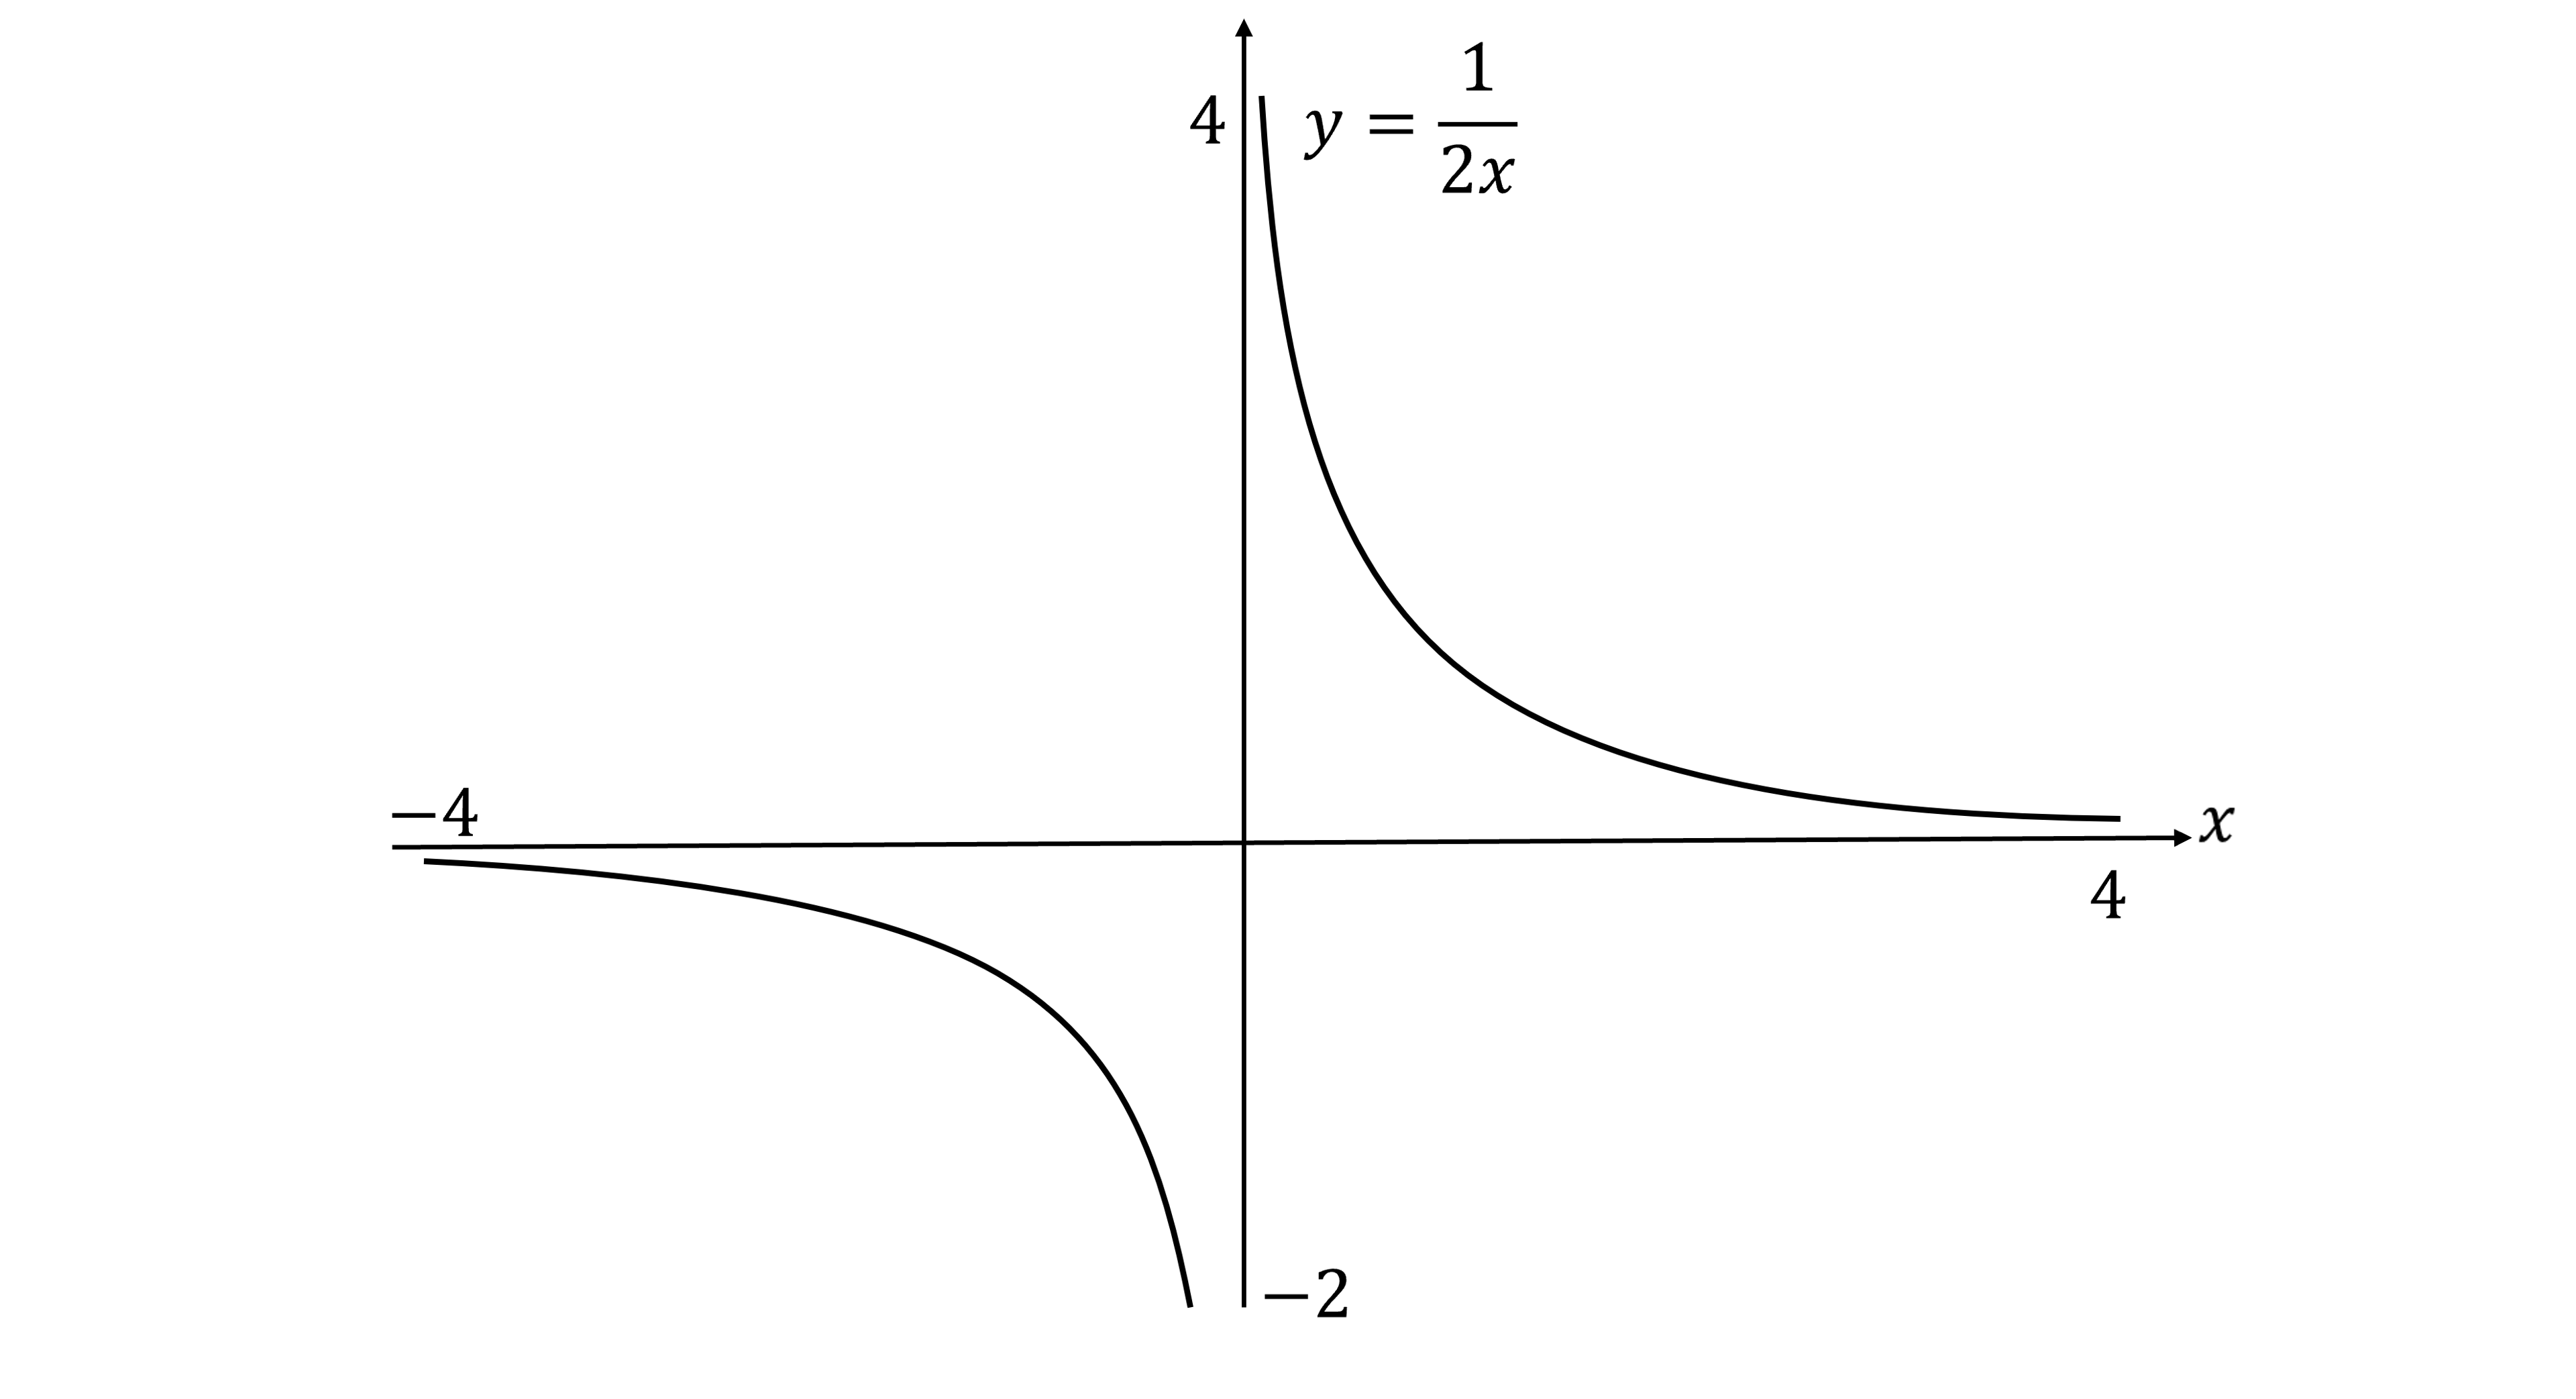
Write down the equations of any asymptotes.
On the same diagram, sketch the graph of .
Label clearly the coordinates of any turning points and any intercepts with the coordinate axes.
If , solve the following inequality.
Give your answer to 2 decimal places.
Was this exam question helpful?