Cumulative Frequency (Cambridge (CIE) IGCSE International Maths: Extended): Exam Questions

Exam code: 0607

3 hours30 questions
1a
Sme Calculator
1 mark

Sue works for a company that delivers parcels.

One day the company delivered  80 parcels.
The table shows information about the weights, in kg, of these parcels.

Weight ( w kg)

Frequency

0<w1

19

1<w2

17

2<w3

15

3<w4

12

4<w5

10

5<w6

7

Complete the cumulative frequency table.

Weight ( w kg)

Cumulative frequency

0<w1


0<w2


0<w3


0<w4


0<w5


0<w6


1b
Sme Calculator
2 marks

On the grid opposite, draw a cumulative frequency graph for your table.

PLKM_EeP_q7b-easy-6-4-cumulative-frequency-edexcel-gcse-maths
1c
Sme Calculator
3 marks

Sue says,

   "75 % of the parcels weigh less than 3.4 kg."

Is Sue correct?
You must show how you get your answer.

2a
Sme Calculator
1 mark

The grouped frequency table gives information about the times, in minutes, that 80 office workers take to get to work. 

Time (t minutes)

Frequency

0<t20

5

20<t40

30

40<t60

20

60<t80

15

80<t100

8

100<t120

2

Complete the cumulative frequency table.

Time (t minutes)

Cumulative frequency

0<t20


0<t40


0<t60


0<t80


0<t100


0<t120


2b
Sme Calculator
2 marks

On the grid, draw the cumulative frequency graph for this information.

q11b-easy-6-4-cumulative-frequency-edexcel-gcse-maths
2c
Sme Calculator
3 marks

Use your graph to find an estimate for the percentage of these office workers who take more than  90 minutes to get to work.

3
Sme Calculator
3 marks

The cumulative frequency graph shows the times, in minutes, each of 100 children spent exercising in one week.

cie-igcse-2020-oct-nov-p4-tz1-q3biii

 Use the cumulative frequency diagram to find an estimate of  

i) the 60th percentile,

 .......................................... min [1]

ii) the number of children who spent more than 3 hours exercising.

 [2]

1a
Sme Calculator
3 marks

160 students record the amount of time, t hours, they each spend playing computer games in a week.
This information is shown in the cumulative frequency diagram.

cie-igcse-2019-may-jun-p2-tz3-q23a

Use the diagram to find an estimate of

i) the median,  

 .......................................... hours [1]

ii) the interquartile range.  

.......................................... hours [2]

1b
Sme Calculator
2 marks

Use the diagram to complete this frequency table.

Time (t hours)

0<t2

2<t4

4<t6

6<t8

8<t10

10<t12

Frequency

20


24

12

4

2a
Sme Calculator
1 mark

The cumulative frequency graph shows information about the times 80 swimmers take to swim 50 metres.

q5a-hrd-6-4-cumulative-frequency-edexcel-gcse-maths

Use the graph to find an estimate for the median time.

2b
Sme Calculator
3 marks

A swimmer has to swim 50 metres in 60 seconds or less to qualify for the swimming team.

The team captain says,

   "More than 25% of swimmers have qualified for the swimming team."

Is the team captain right?
You must show how you got your answer.

3
Sme Calculator
6 marks

The height, h cm, of each of 120 plants is measured.
The cumulative frequency diagram shows this information.

cie-igcse-2020-oct-nov-p4-tz2-q4a

Use the cumulative frequency diagram to find an estimate of

i) the median,

   ............................................ cm [1]

ii) the interquartile range,  

............................................ cm [2]

iii) the 60th percentile,

 ............................................ cm [1]

iv) the number of plants with a height greater than 40cm.

 [2]

4a
Sme Calculator
2 marks

A school nurse records the height, h cm, of each of 180 children.
The table shows the information.

Height (h cm)

60<h70

70<h90

90<h100

100<h110

110<h115

115<h125

Frequency

8

26

35

67

28

16

Complete the cumulative frequency table below.

Height (h cm)

h70

h90

h100

h110

h115

h125

Cumulative Frequency


180

4b
Sme Calculator
3 marks

On the grid below, draw a cumulative frequency diagram.

cie-igcse-2018-oct-nov-p4-tz1-q4d
4c
Sme Calculator
6 marks

Use your cumulative frequency diagram to find an estimate of

i) the interquartile range,

.......................................... cm [2]

ii) the 7 0th percentile,

.......................................... cm [2]

iii) the number of children with height greater than 106 cm.

[2]

5
Sme Calculator
10 marks

The time taken for each of 120 students to complete a cooking challenge is shown in the table.

 Time (t minutes)

20<t25

25<t30

30<t35

35<t40

40<t45

 Frequency

44

32

28

12

4

i) Complete the cumulative frequency table.

Time (t minutes)

t20

t25

t30

t35

t40

t45

Cumulative frequency

0

44


[2]

ii) On the grid, draw a cumulative frequency diagram to show this information.

HzVc06Br_cie-igcse-2018-may-jun-2-p4-q2bii

[3]

iii) Find the median time.

......................................... min [1]

iv) Find the interquartile range.

......................................... min [2]

v) Find the number of students who took more than 37 minutes to complete the cooking challenge.

[2]

6a
Sme Calculator
1 mark

The table shows information about the speeds of  100 lorries.

Speed (s) in km/h

Frequency

0<s20

2

20<s40

9

40<s60

23

60<s80

31

80<s100

27

100<s120

8

Complete the cumulative frequency table for this information.

Speed (s) in km/h

Cumulative frequency

0<s20

2

0<s40


0<s60


0<s80


0<s100


0<s120


6b
Sme Calculator
2 marks

On the grid, draw a cumulative frequency graph for your table.

q5a-easy-6-4-cumulative-frequency-edexcel-gcse-maths
6c
Sme Calculator
2 marks

Find an estimate for the number of lorries with a speed of more than  90 km/h.

1a
Sme Calculator
2 marks

The cumulative frequency graphs show information about the times taken by 100 male runners and by 100 female runners to finish the London marathon. 

q6-hrd-6-4-cumulative-frequency-edexcel-gcse-maths

A male runner is chosen at random.

Find an estimate for the probability that this runner took less than 4 hours to finish the London marathon.

1b
Sme Calculator
4 marks

Use medians and interquartile ranges to compare the distribution of the times taken by the male runners with the distribution of the times taken by the female runners.

2
Sme Calculator
3 marks

The cumulative frequency graph gives information about the weights, in grams, of 90 bags of sweets.

q11-4ma1-1h-qp-jan21-paper1-igcse-maths

Roberto sells the bags of sweets to raise money for charity.
Bags with a weight greater than d grams are labelled large bags and sold for 3.75 euros each bag.

The total amount of money he receives by selling all the large bags is 93.75 euros.

Find the value of d.

3a
Sme Calculator
6 marks

The cumulative frequency diagram shows information about the time taken, t seconds, for a group of girls to each solve a maths problem.

cie-igcse-2019-oct-nov-p4-tz2-q2

Use the cumulative frequency diagram to find an estimate for

i) the median,


.................................................. s [1]

ii) the interquartile range,


.................................................. s [2]

iii) the 20th percentile,


.................................................. s [1]

iv) the number of girls who took more than 66 seconds to solve the problem.


[2]

3b
Sme Calculator
6 marks

i) Use the cumulative frequency diagram to complete the frequency table.

Time (t seconds)

0<t20

20<t40

40<t60

60<t80

80<t100

Frequency

6


4


[2]

ii) Calculate an estimate of the mean time.


.................................................. s [4]

3c
Sme Calculator
3 marks

A group of boys solved the same problem. The boys had a median time of 60 seconds, a lower quartile of 46 seconds and an upper quartile of 66 seconds.

i) Write down the percentage of boys with a time of 66 seconds or less.


................................................ % [1]

ii) Howard says

"The boys' times vary more than the girls' times."

Explain why Howard is incorrect.

 [2]

4a
Sme Calculator
3 marks

The cumulative frequency diagram shows information about the distance, d km, travelled by each of 60 male cyclists in one weekend.

cie-igcse-2019-oct-nov-p4-tz3-q5

Use the cumulative frequency diagram to find an estimate of

i) the median,

.............................................. km [1]

ii) the lower quartile,


.............................................. km [1]

iii) the interquartile range.

   .............................................. km [1]

4b
Sme Calculator
1 mark

For the same weekend, the interquartile range for the distances travelled by a group of female cyclists is 40 km.

Make one comment comparing the distribution of the distances travelled by the males with the distribution of the distances travelled by the females.

4c
Sme Calculator
2 marks

A male cyclist is chosen at random.

Find the probability that he travelled more than 50 km.

4d
Sme Calculator
6 marks

i) Use the cumulative frequency diagram to complete this frequency table.

Distance (d km)

Number of male cyclists

0<d40

18

40<d50

9

50<d60


60<d70


70<d90


90<d120

2


[2]

ii) Calculate an estimate of the mean distance travelled.  

.............................................. km [4]

5a
3 marks

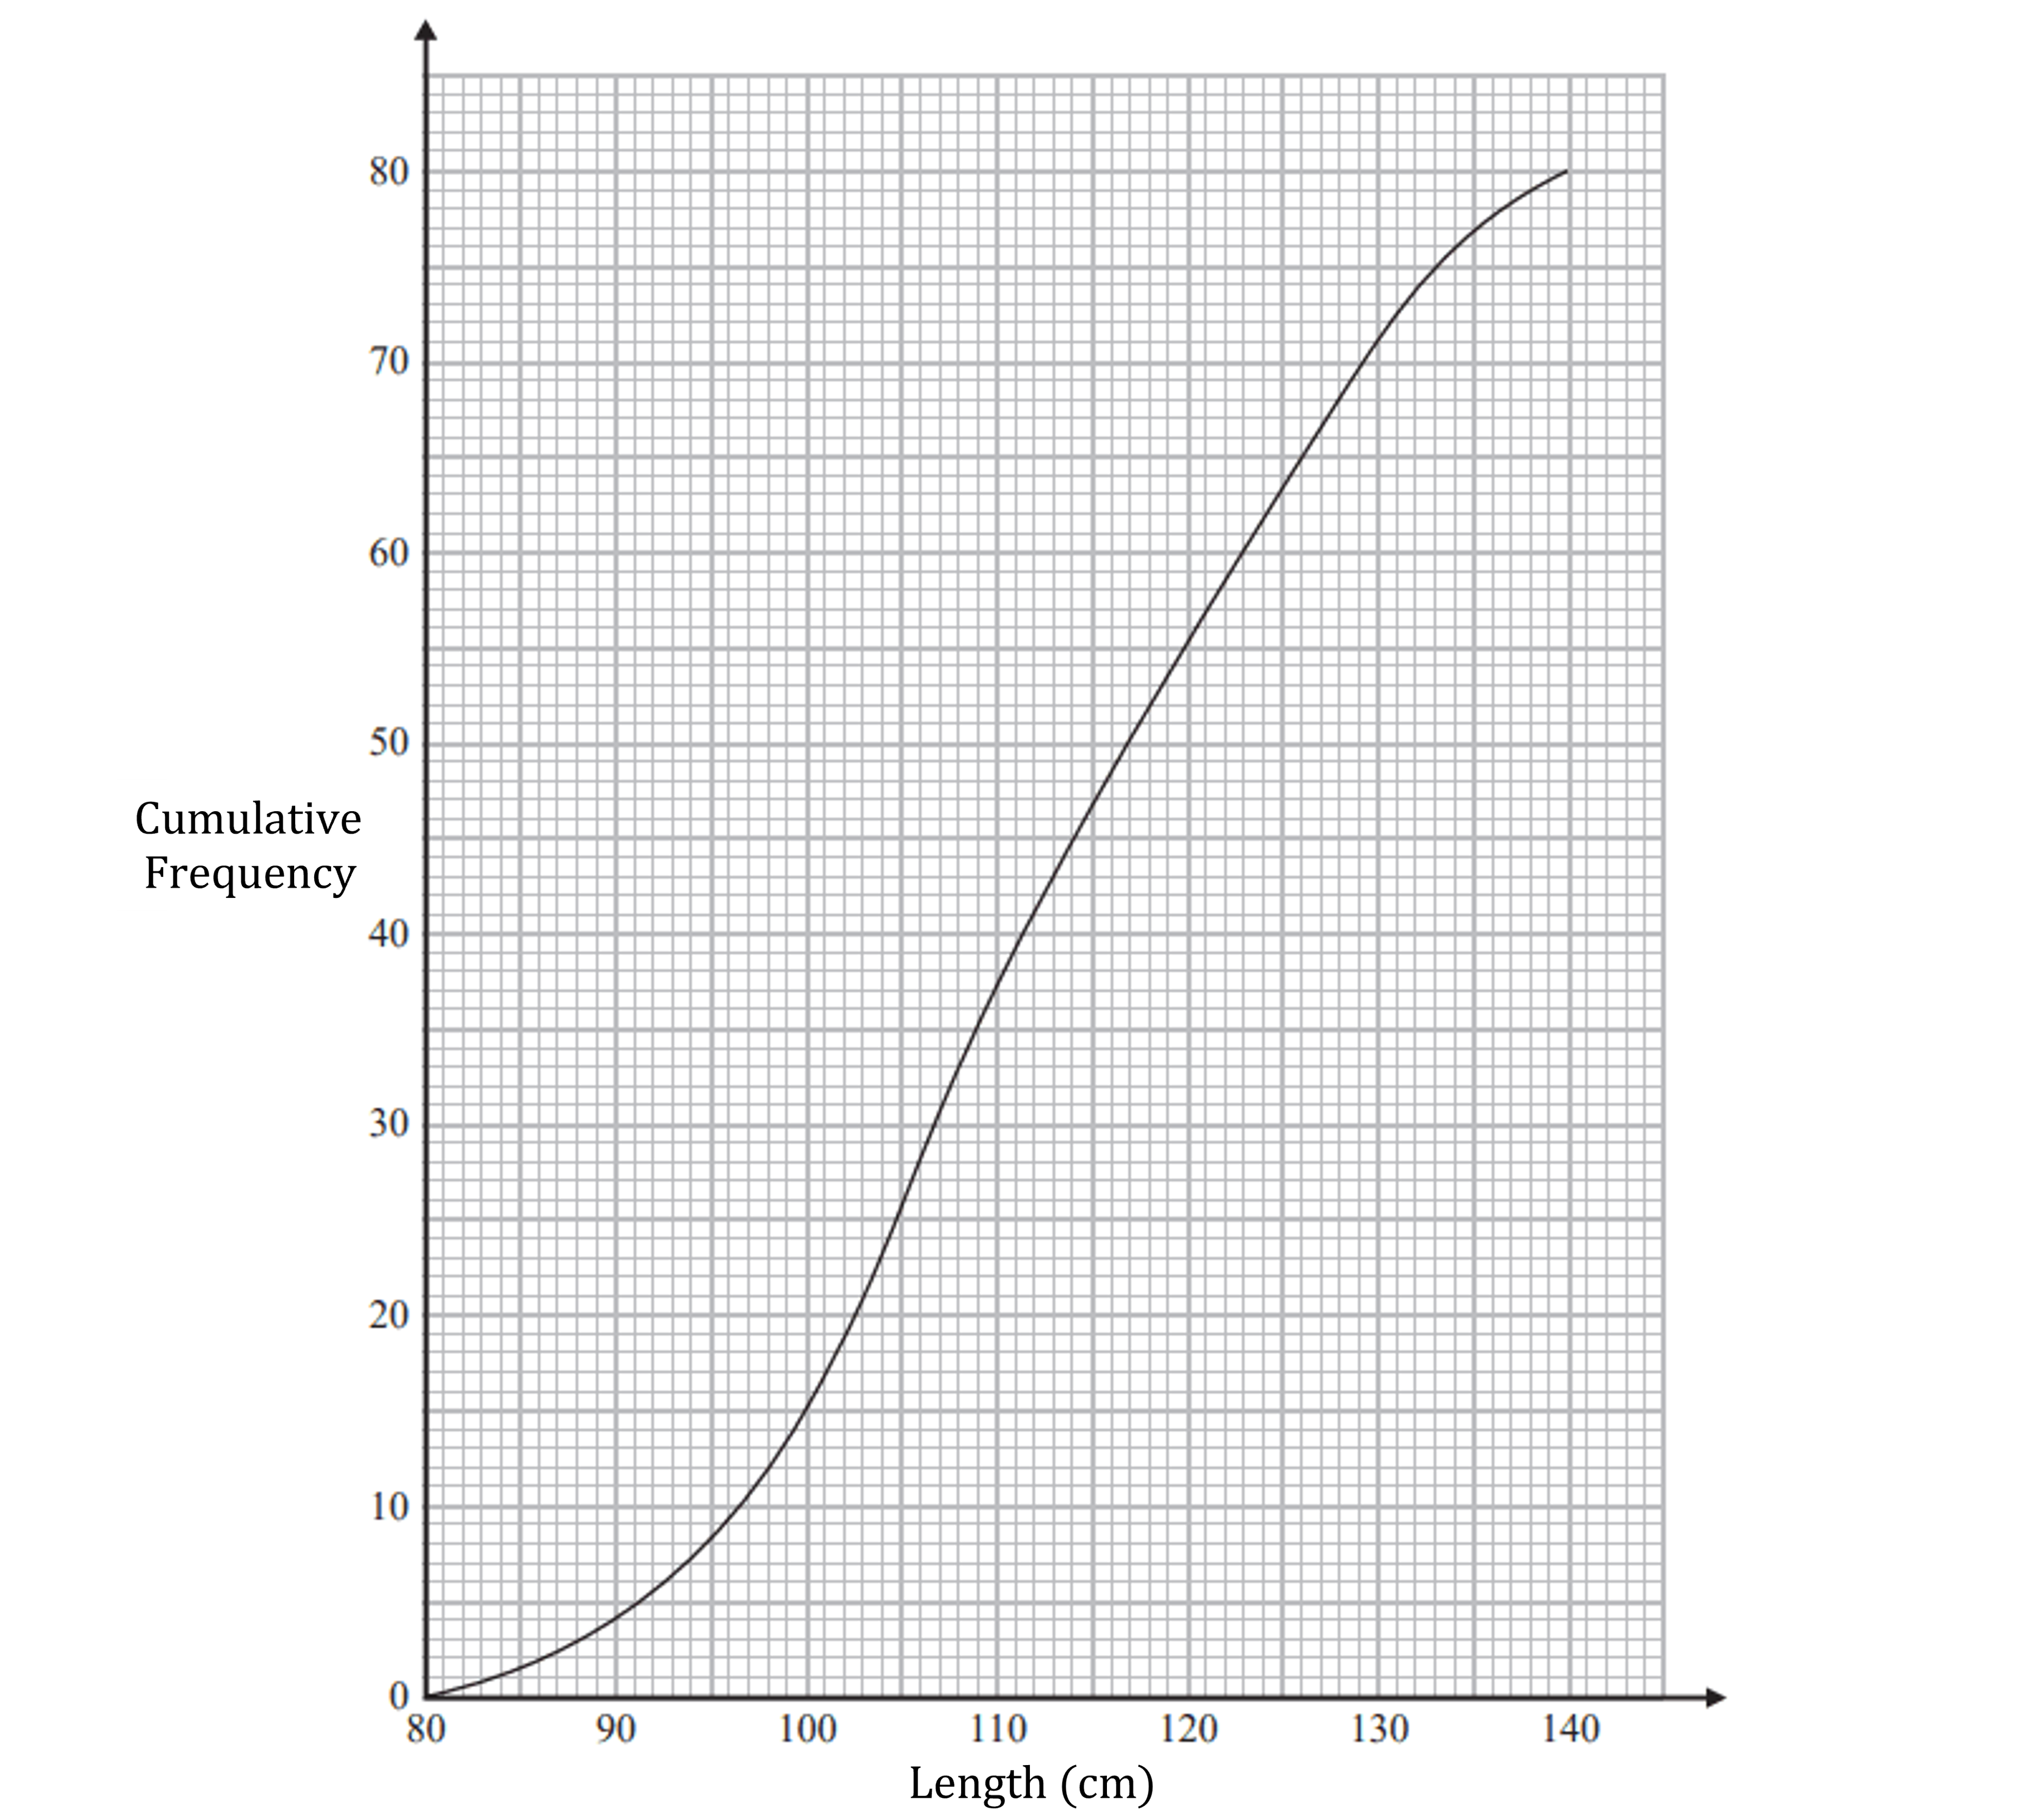
The cumulative frequency graph shows information about the length, in minutes, of each of 80 fish.

cumulative frequency graph

Use the graph to find an estimate for the interquartile range of the fish.

5b
4 marks

Clint says, “More than 35% of the fish are over 120 cm long.”

Is Clint correct?

Give a reason for your answer.