1a
2 marks
Explain why root hair cells do not have chloroplasts.
1b
1 mark
Soil contains magnesium ions.
Which substance in plants contains magnesium?
Chlorophyll
Glucose
Starch
Was this exam question helpful?
Exam code: 8465
Explain why root hair cells do not have chloroplasts.
Soil contains magnesium ions.
Which substance in plants contains magnesium?
Chlorophyll
Glucose
Starch
Was this exam question helpful?
Stem cells are found in human embryos and in meristem tissue.
Which organisms is meristem tissue found in?
Animals
Bacteria
Plants
Was this exam question helpful?
Some plants have leaves with white areas and green areas.
A student tested a leaf with white areas and green areas for starch.
This is the method used.
Boil the leaf in ethanol.
Rinse the leaf in water.
Add iodine solution to the leaf.
Record the colour of each area of the leaf.
Figure 2 shows the results.
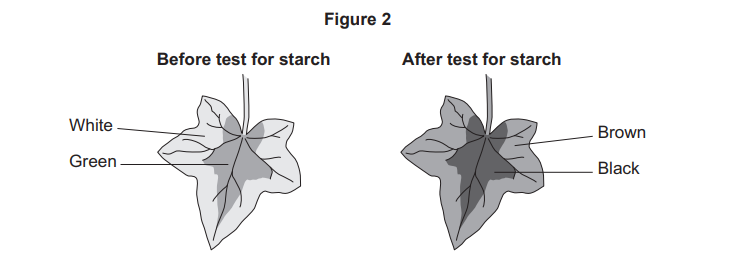
The student boiled the leaf in ethanol to remove the green colour from the leaf.
Why does the green colour need to be removed from the leaf before the leaf is tested for starch?
Explain how the results in Figure 2 provide evidence that the white area of the leaf did not contain chlorophyll.
The student investigated the coloured pigments in the leaf.
Figure 3 shows the apparatus.
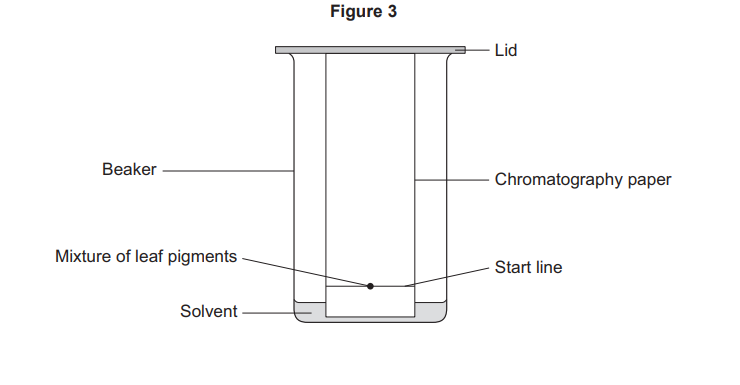
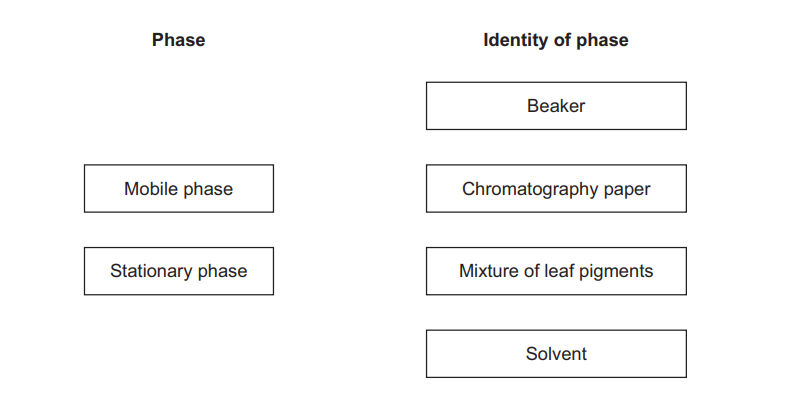
Chromatography involves a mobile phase and a stationary phase.
Draw one line from each phase to the identity of that phase in the investigation.
The student drew the start line in pencil.
Why did the student not draw the start line in ink?
Table 2 shows the results.
Table 2
Colour of leaf pigment | Distance moved by leaf pigment in mm | Rf value |
|---|---|---|
Orange | 116 | 0.96 |
Brown | 42 | 0.35 |
Green | 33 | 0.27 |
Yellow | X | 0.24 |
Calculate X in Table 2.
Use the equation:
The distance moved by the solvent was 121 mm.
Give your answer to 2 significant figures.
Table 3 shows the range of Rf values for known leaf pigments.
Table 3
Leaf pigment | Range of Rf values |
|---|---|
Carotene | 0.89 to 0.98 |
Chlorophyll a | 0.20 to 0.30 |
Phaeophytin | 0.33 to 0.40 |
Xanthophyll | 0.04 to 0.28 |
The student used Table 3 to identify the leaf pigments in their investigation.
Which colour is the leaf pigment phaeophytin?
Use Table 2 and Table 3.
Another student did the investigation using the same leaf pigments.
The Rf values for the same pigments were different.
What is the reason for the difference?
A different solvent was used.
A greater volume of solvent was used.
The solvent moved further.
Was this exam question helpful?
Plants have different tissues that are adapted for special functions.
One plant tissue is meristem tissue.
Meristem tissue:
is made of meristem stem cells
is found in the growing areas of a plant
contains the cells that divide as a plant grows.
Figure 12 shows how specialised leaf cells are produced from meristem cells.

Meristem cells divide and then form specialised cells.
Cells become specialised during process X.
Name process X.
Describe two changes that can happen in a plant because meristem cells divide.
Scientists used a microscope to investigate cell division in a plant shoot.
Figure 13 shows the plant shoot.
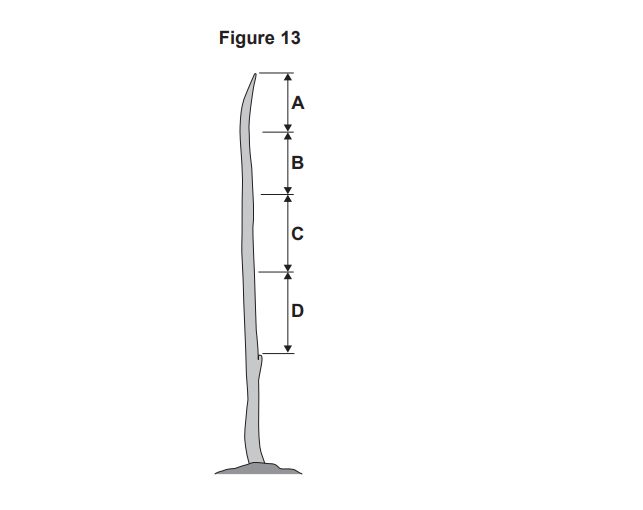
The percentage of cells dividing by mitosis was estimated.
This is the method used.
Take a tissue sample from section A of the plant shoot and view 100 cells.
Count how many of the 100 cells are dividing by mitosis.
Repeat steps 1 and 2 for sections B, C and D of the plant shoot.
Table 8 shows the results.
Table 8
Section of plant shoot | Percentage (%) of cells dividing by mitosis |
|---|---|
A | 13 |
B | 4 |
C | 0 |
D | 0 |
Explain the results in Table 8.
Phloem tissue and xylem tissue are part of a plant’s transport system.
What is the name of the process that transports dissolved sugars around a plant?
Figure 14 shows a section of phloem tissue in a leaf.
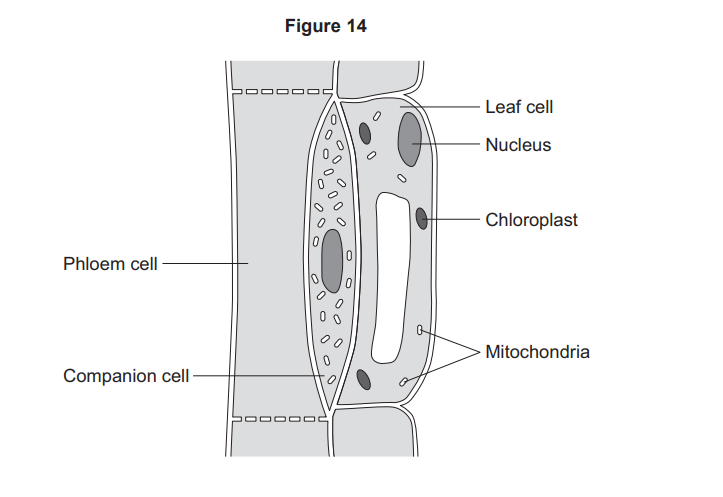
Describe two ways the structure of phloem cells is different from the structure of xylem cells.
Dissolved sugar moves from the leaf cell into the phloem cell.
In Figure 14:
the concentration of sugar in the leaf cell is 4 mg per dm³
the concentration of sugar in the phloem cell is 118 mg per dm³.
The companion cell is needed to move sugar from the leaf cell into the phloem cell.
Explain why.
Was this exam question helpful?
This question is about plants.
Meristem is a specialised tissue found at the tips of shoots and roots.
What is the function of meristem tissue?
Tick (✓) one box.
Cell division
Fertilisation
Transpiration
Xylem tissue and phloem tissue are found in plants.
Cells in phloem tissue contain sugars.
Table 1 shows some features of xylem tissue and phloem tissue.
Complete Table 1.
Put one tick (✓) in each row to show if the feature is true for:
xylem only
phloem only
both xylem and phloem
Table 1
Feature of tissue | Xylem only | Phloem only | Both xylem AND phloem |
|---|---|---|---|
Involved in transport of substances in the plant | |||
Transports water and mineral ions from roots to leaves | |||
Consists of hollow tubes of dead cells | |||
End walls of the cells have pores |
Stomata are tiny holes in the surface of leaves.
Guard cells surround the stomata.
Figure 2 shows the shape of guard cells around stomata at different times of the day.
Figure 2
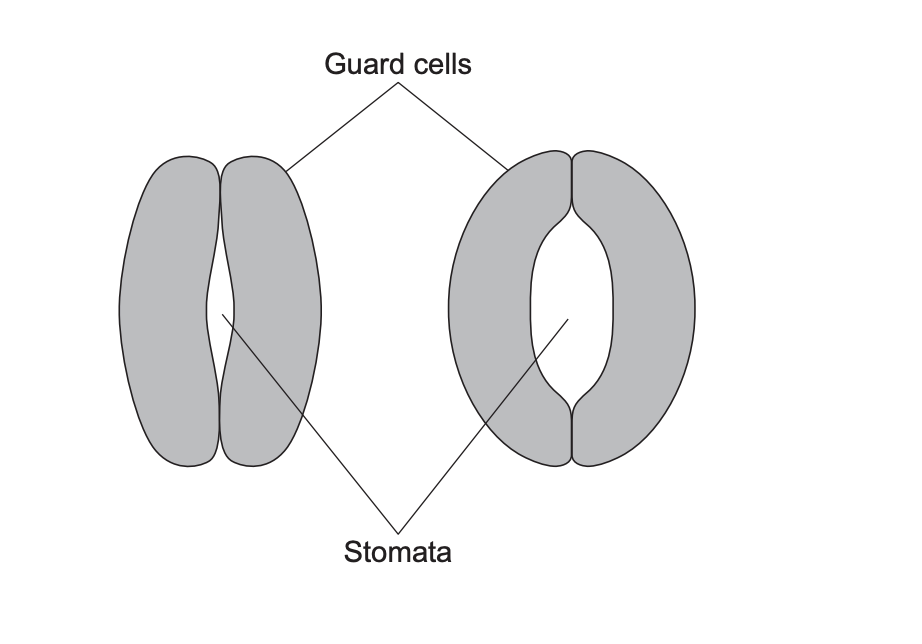
Guard cells control water loss from the leaf.
Explain what happens to the guard cells to increase water loss from the leaf.
Use Figure 2.
Complete the sentences.
Choose answers from the box.
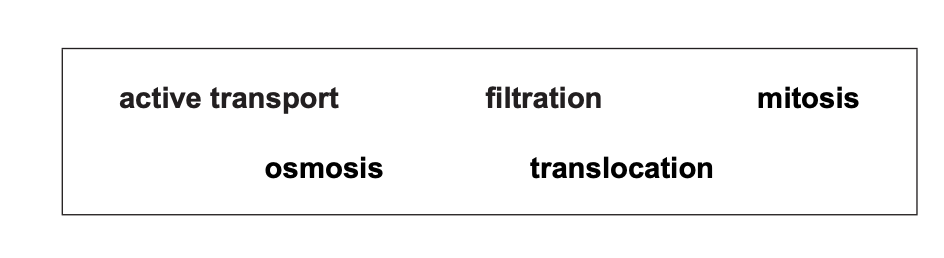
Water moves from the soil into the plant by ._____________
Mineral ions move from a low concentration in the soil to a high concentration in the root by .___________
Sugars are transported from the leaves to other parts of the plant by ._______________
Was this exam question helpful?
Suggest one reason why farmers remove and destroy plants that are infected with TMV.
Was this exam question helpful?
In a managed forest:
tree seedlings are regularly planted
some trees are regularly removed.
Figure 12 shows information about the managed forest.
Figure 12
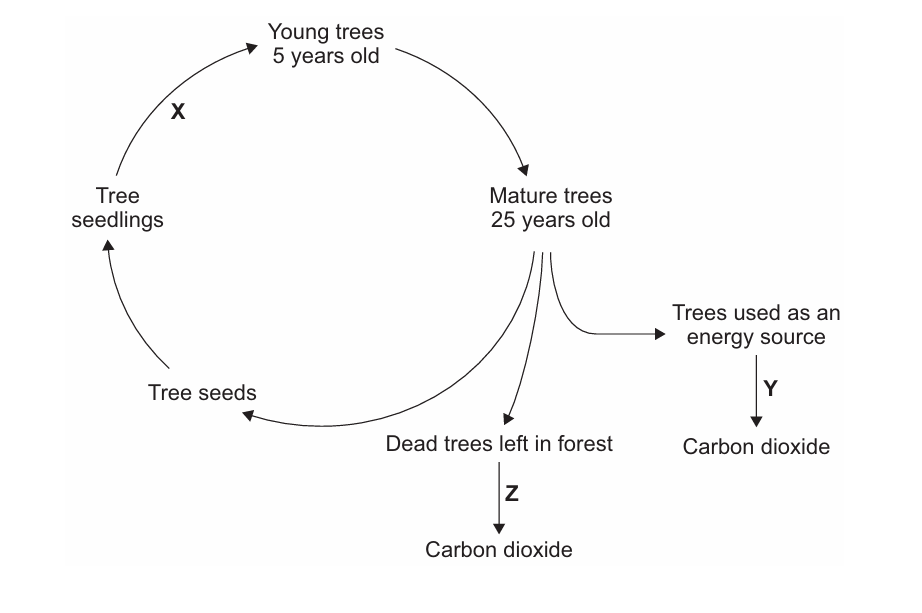
When dead trees are broken down:
carbon dioxide is released into the atmosphere
mineral ions are released into the soil
Tree seedlings take in the carbon dioxide and the mineral ions.
Complete the sentences.
Choose answers from the box.
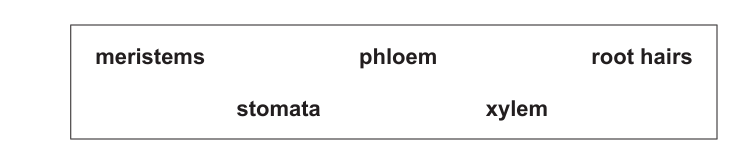
Carbon dioxide enters the tree seedlings through ______________
Mineral ions enter the tree seedlings through __________________
Was this exam question helpful?
Grass leaves look green because of a green pigment found in chloroplasts.
Name the green pigment found in chloroplasts.
Which mineral ion is found in the green pigment in chloroplasts?
Tick (✓) one box.
Magnesium ion
Nitrate ion
Sodium ion
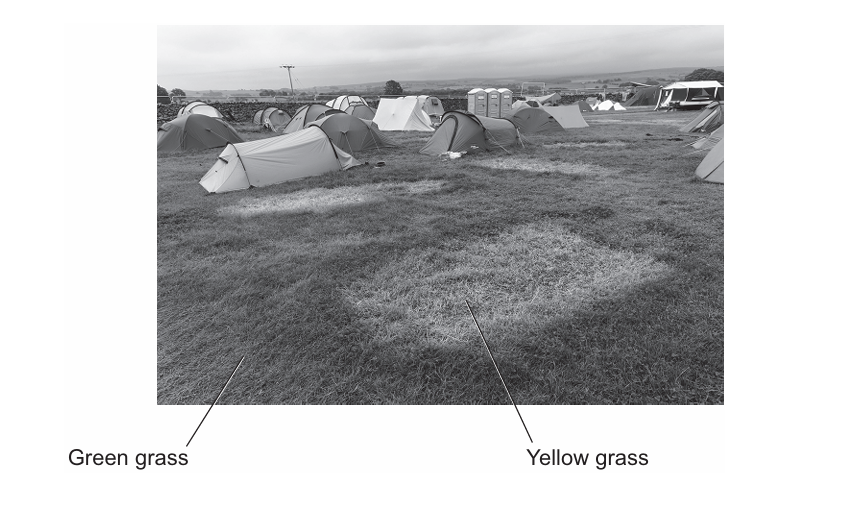
An area of grass changed colour after being covered by a tent.
The colour of the grass changed from green to yellow.
Figure 2 shows the area of green grass and the area of yellow grass.
Figure 2
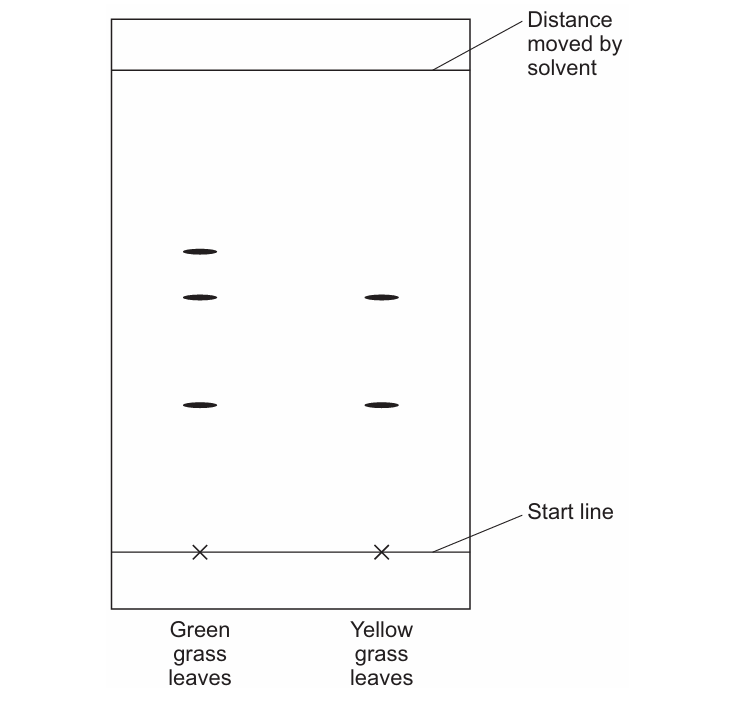
A student used paper chromatography to investigate the pigments in grass leaves from:
the area of green grass
the area of yellow grass
Figure 3 shows the results.
Figure 3
The student crushed the grass leaves.
Describe a method to separate the pigments in the crushed grass leaves using paper chromatography.
Determine the Rf value of the pigment that is found in green grass leaves but not found in yellow grass leaves.
Use the equation:
Use Figure 3.
Rf = ___________
There are fewer pigments in the yellow grass leaves than in the green grass leaves.
Suggest one reason why.
Was this exam question helpful?
Xylem tissue and phloem tissue are found in plants.
Compare the structure and function of xylem tissue and phloem tissue.
Was this exam question helpful?
Explain how the processes of photosynthesis and respiration in a tree are involved in the production of new biomass for the tree.
Was this exam question helpful?
Algae and plants need magnesium ions to grow.
Complete the sentence.
Choose the answer from the box.
chloropyll | glucose | urea |
In algae and plants, magnesium ions become part of .....................................
Was this exam question helpful?
The evolution of algae and plants changed the Earth's atmosphere.
Algae and plants photosynthesise.
Complete the word equation for photosynthesis.
Was this exam question helpful?
Figure 7 shows an oak tree.
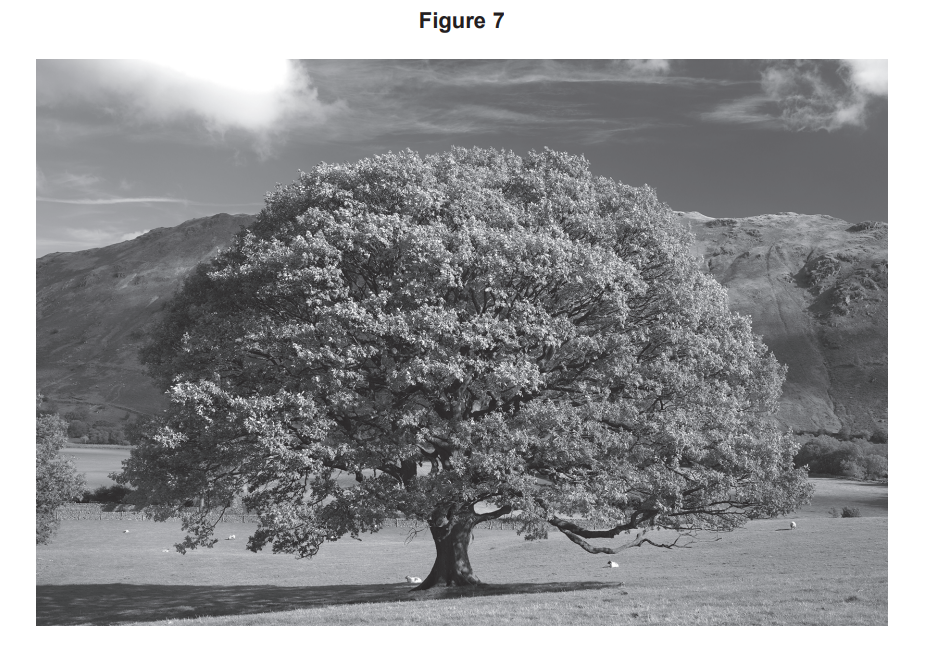
The binomial name of the oak tree is Quercus robur.
What is the genus name of the oak tree?
Oak
Quercus
Robur
Oak trees grow at points where cells can divide.
Growth in oak trees happens at the tips of the branches.
Name the type of tissue at the tips of the branches.
One type of insect lays eggs in acorns.
The insect eggs cause the acorn to grow abnormally.
The abnormal growth is called a gall.
Insect embryos grow inside the gall.
Figure 8 shows a normal acorn and an acorn that has grown a gall.
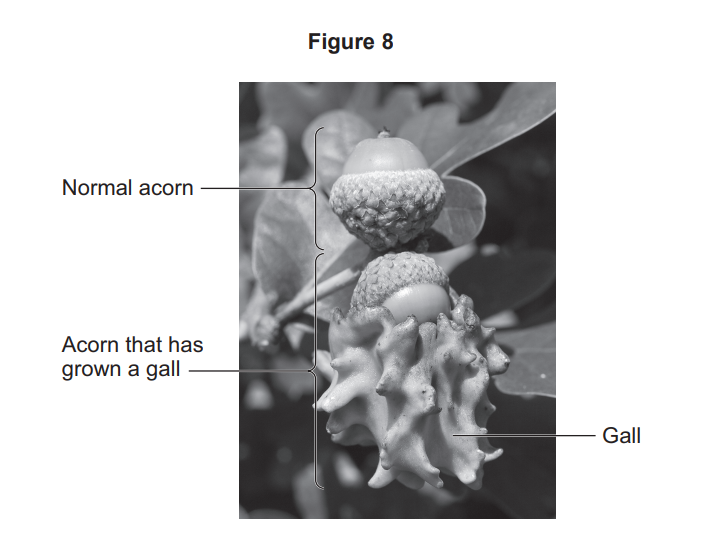
The gall is made from oak tree cells that have divided.
The cells of the gall contain two sets of chromosomes.
Which process produces the cells of the gall?
Circulation
Digestion
Mitosis
The oak tree transports water and nutrients to the insect embryos inside the gall.
Complete the sentence.
Choose the answer from the box.
leaf cells | stomata | xylem |
Water is transported from the roots of the tree to the gall by the _________.
Complete the sentence.
Choose the answer from the box.
chloroplasts | guard cells | phloem |
Sugar is transported through the tree to the insect embryos by the ____________.
Water moves from the roots to the leaves.
Name the process that moves water from the roots to the leaves.
Was this exam question helpful?
Tobacco mosaic virus (TMV) can infect pepper plants.
Infected plants have yellow patches on the leaves.
Explain why plants with TMV grow slower than plants that do not have TMV.
Was this exam question helpful?
Figure 2 shows equipment used to investigate how light intensity affects photosynthesis
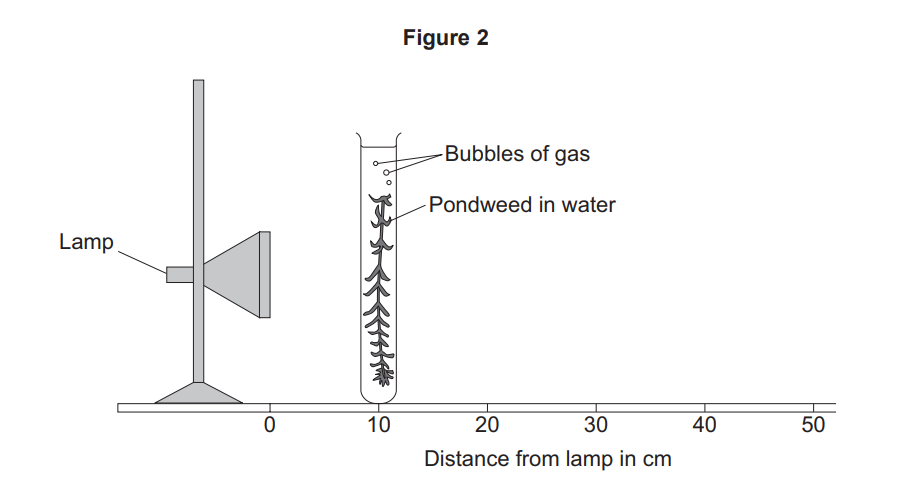
The light intensity can be changed by moving the pondweed to different distances from the lamp.
Describe a method to investigate the effect of light intensity on the rate of photosynthesis in pondweed.
Was this exam question helpful?
A student stated:
'The evolution of algae was essential for the evolution of animals.'
Explain why the student's statement is correct.
Was this exam question helpful?
Algae and plants are producers.
Explain how not having enough magnesium ions and nitrate ions can limit the mass of carbon stored in producers.
Was this exam question helpful?
The insect embryo inside the acorn:
causes the growth of the gall
uses nutrients from the gall to grow
causes lignin to form around the outside of the gall.
The lignin around the gall protects the acorn from being eaten by herbivores.
Which other structure in the oak tree contains lignin?
Tick (✓) one box.
Phloem
Root hair cells
Xylem
Was this exam question helpful?
A student used paper chromatography to identify the pigments in spinach leaves. She used propanone as a solvent.
Figure 12 shows the student's results.
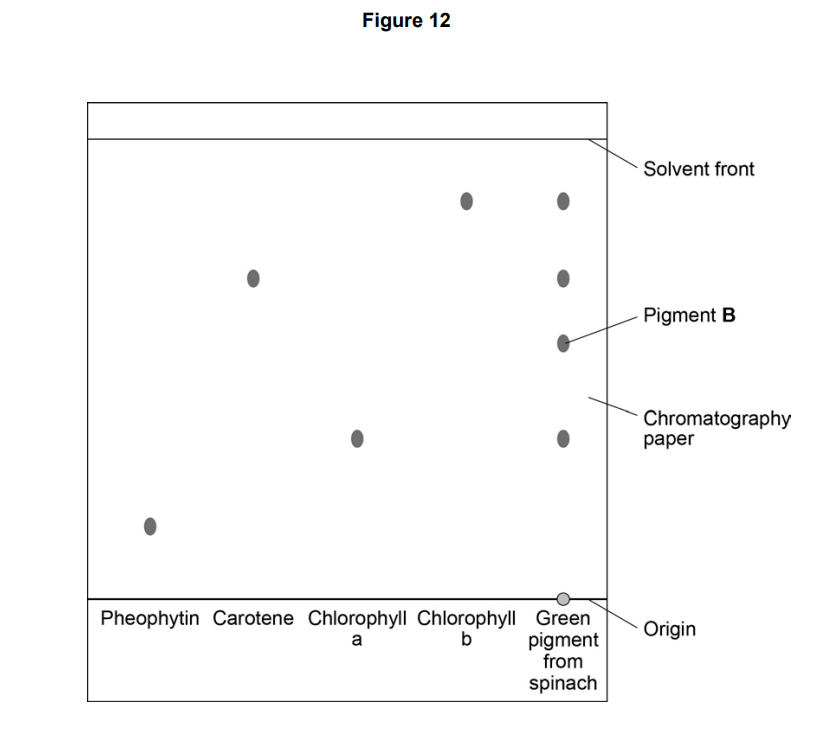
Name the mobile phase and the stationary phase in the student's experiment.
Mobile phase: ___________________________________________
Stationary phase: _________________________________________
What does Figure 12 tell you about the green pigment from spinach?
Write the equation that links distance moved by solvent, distance moved by solute and Rf value.
Use Figure 12 to calculate the value for Pigment B.
value = _____________
Another student set up the apparatus shown in Figure 13
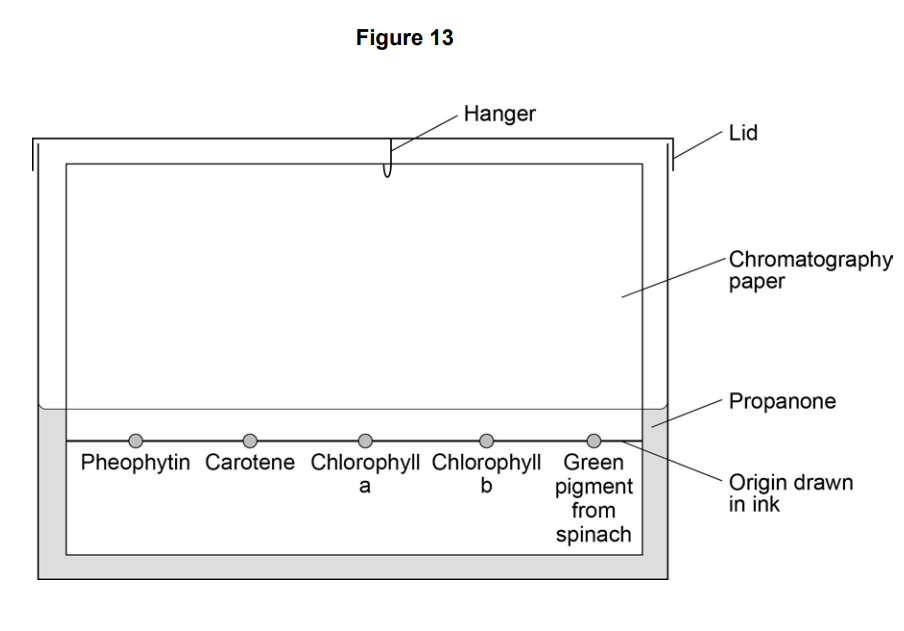
This student did not set up the apparatus correctly.
Identify the errors the student made.
Explain how the errors she made would affect her results.
Was this exam question helpful?
Figure 8 shows a cross-section through a plant root.
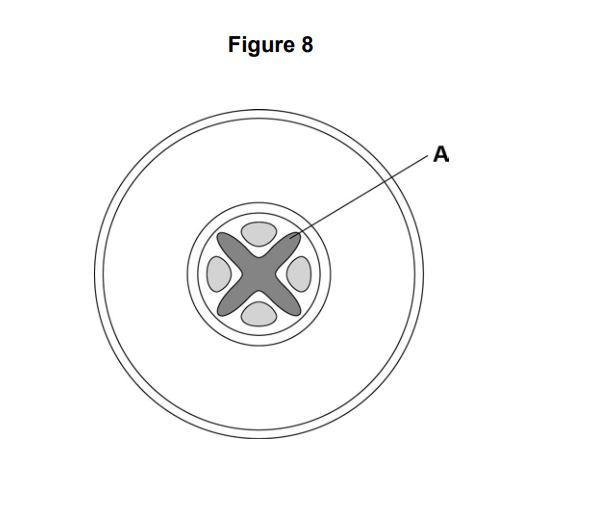
What is tissue A?
A student is given samples of two fluids.
One is from the phloem of a plant and one from the xylem.
The student measures the pH and concentrations of sugar, nitrate ions and potassium ions of each fluid.
Table 4 shows the student's results.
Table 4
Fluid A | Fluid B | |
pH | 7.3 | 5.6 |
Sugar (mg/cm³) | 118 | 1.18 |
Nitrate ions (mg/cm³) | 10 | 600 |
Potassium ions (μg/cm³) | 1.18 | 2500 |
Which fluid is from the phloem, and which is from the xylem?
Explain your answer. Use the information from Table 4.
In fluid A, how many times greater is the concentration of sugar than the concentration of potassium ions?
(Sugar in A = 118 mg/cm³; potassium ions in A = 1.18 μg/cm³.)
Was this exam question helpful?
A student investigated the effect of light intensity on the rate of photosynthesis in pondweed.
The formula for glucose is C₆H₁₂O₆.
Use the formula for glucose to write the balanced symbol equation for photosynthesis.
Figure 8 shows the apparatus the student used
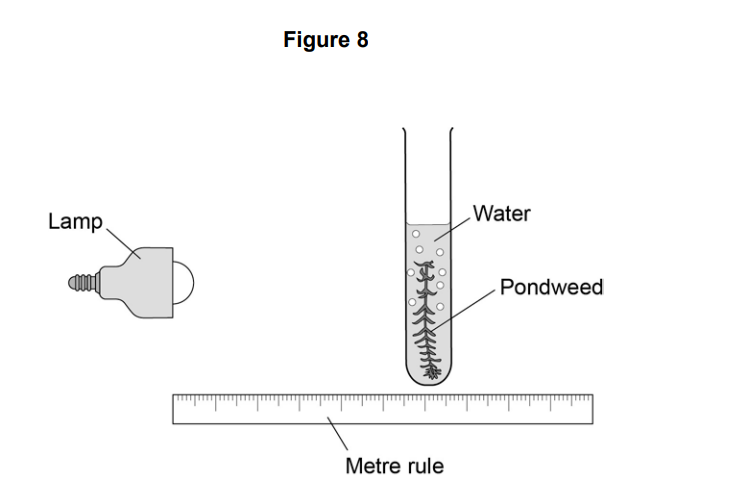
The student altered the distance of the lamp from the pondweed and counted the number of bubbles produced in 30 seconds for each distance.
Table 5 shows the student's results.
Table 5
Distance in cm | Number of bubbles produced in 30 seconds |
10 | 27 |
20 | 23 |
30 | 16 |
40 | 7 |
50 | 2 |
Use the data in Table 5 to complete the graph on Figure 9.
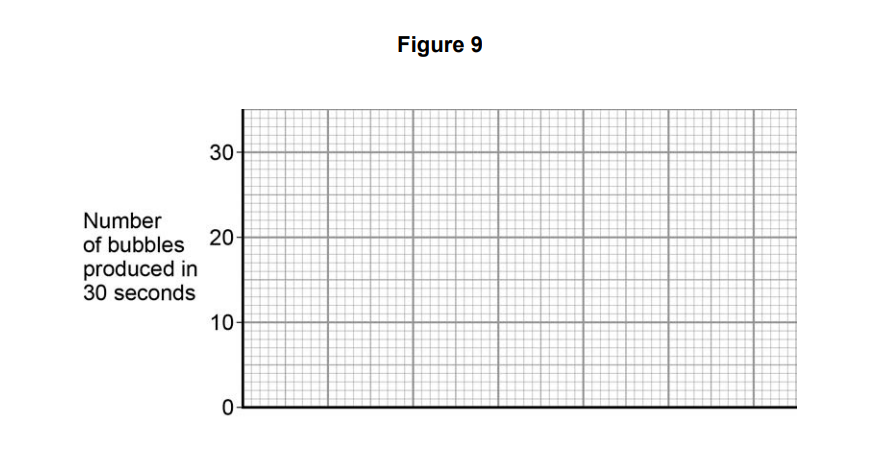
The student concluded that the rate of photosynthesis is inversely proportional to the distance of the lamp from the pondweed.
Does the student's data support this conclusion?
Use data from Figure 9 to justify your answer.
The volume of one bubble can be calculated using the equation:
The radius of one bubble is 0.1 cm.
The value for π is 3.14.
Use data from Table 5 and the information above to calculate the rate of gas production at a distance of 40 cm.
Give your answer in standard form to three significant figures.
Rate of reaction = ______________cm³ per minute
Was this exam question helpful?