1
3 marks
Study Figure 1, which shows the effects of deforestation.
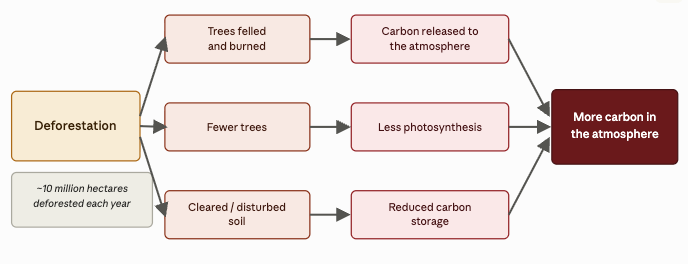
Suggest one way that deforestation adds carbon to the atmosphere.
Was this exam question helpful?
Exam code: 9GE0
Study Figure 1, which shows the effects of deforestation.
Suggest one way that deforestation adds carbon to the atmosphere.
Was this exam question helpful?
Study Figure 1, which shows the process of ocean acidification.
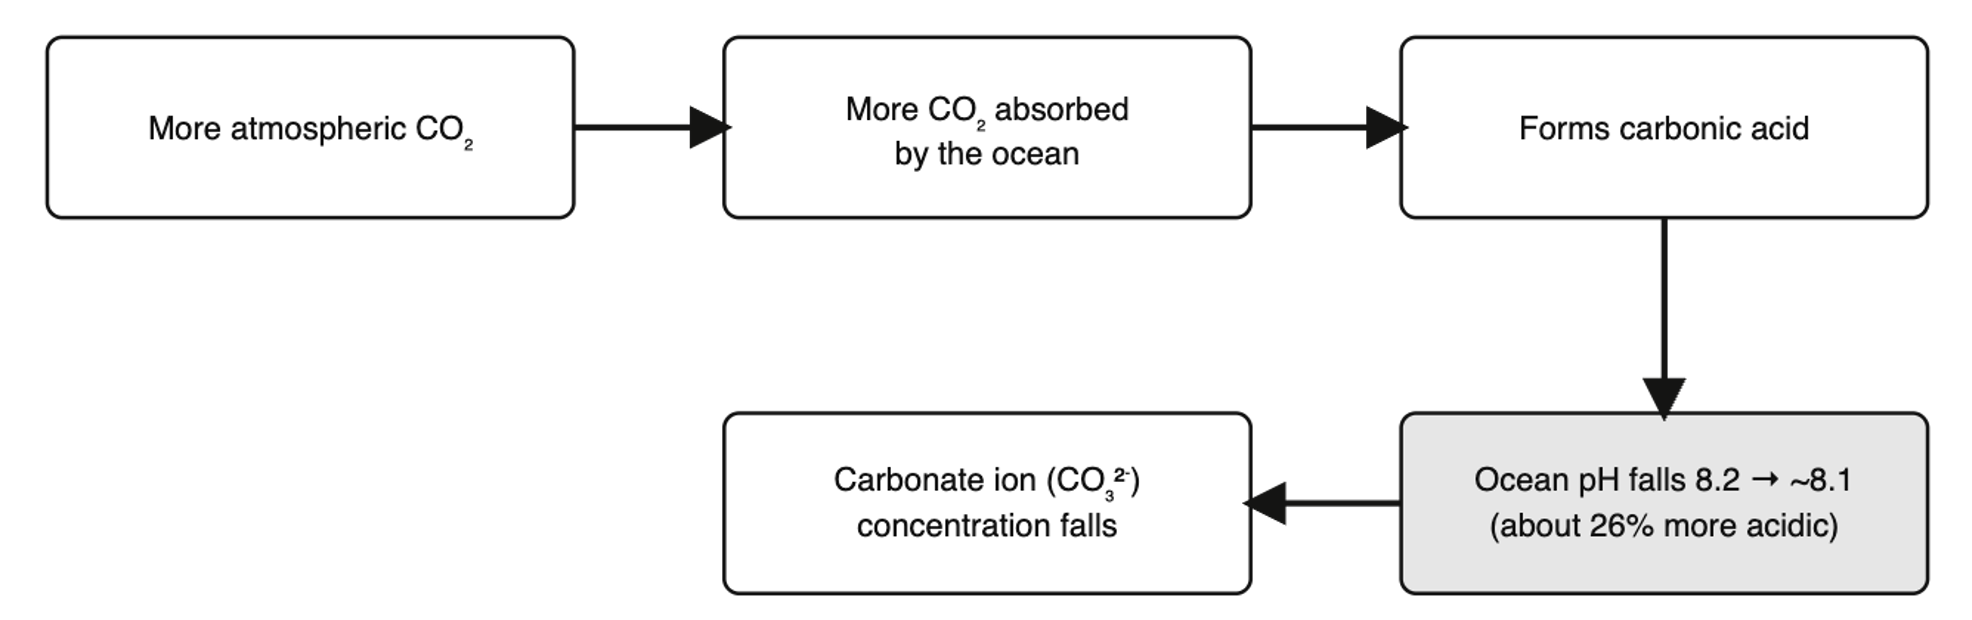
Suggest one reason why ocean acidification threatens organisms such as coral and shellfish.
Was this exam question helpful?
Study Figure 1, which shows the largest national emitters of carbon dioxide.
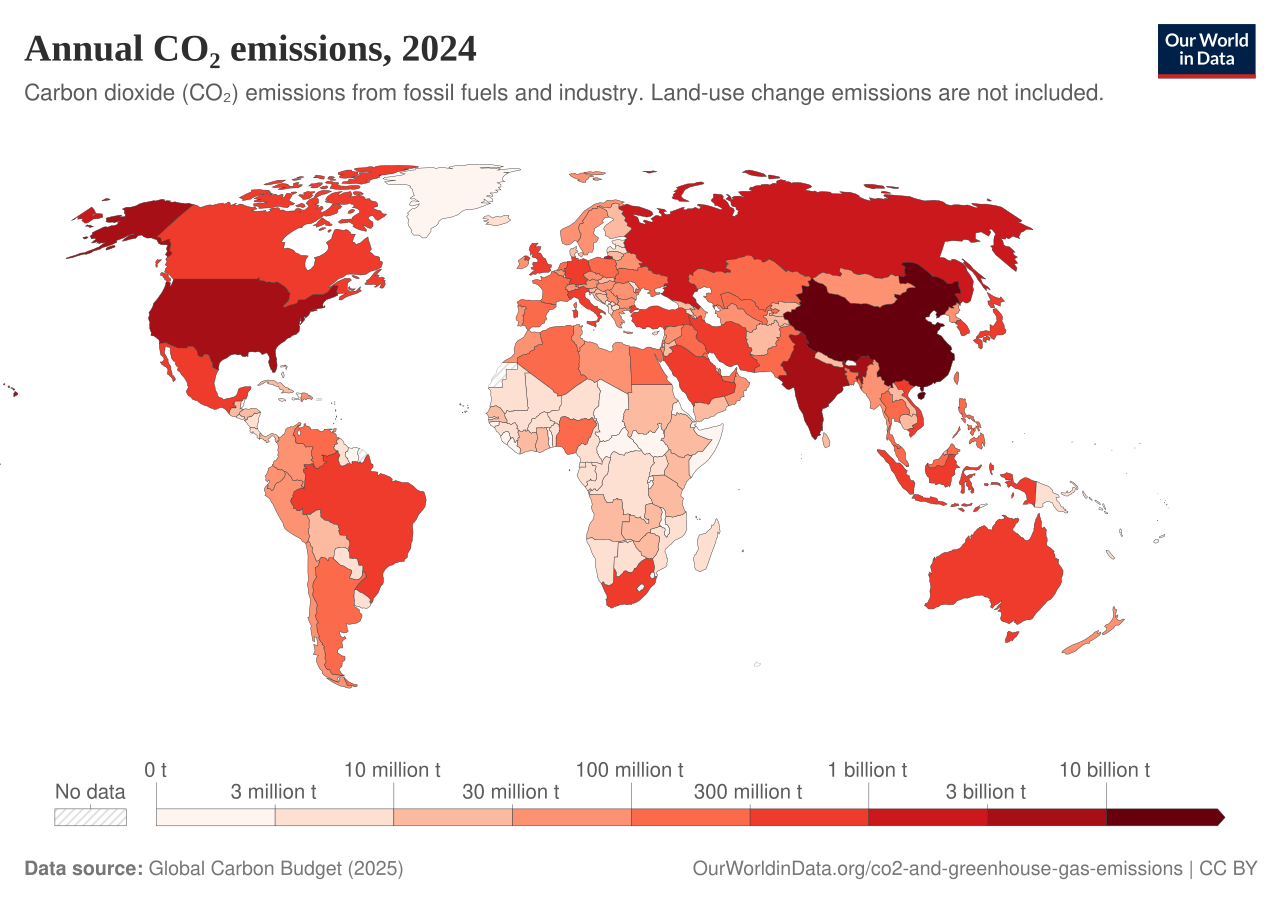
Suggest one reason why China has become the world's largest emitter of carbon dioxide.
Was this exam question helpful?
Study Figure 1, which shows changes in the Arctic.
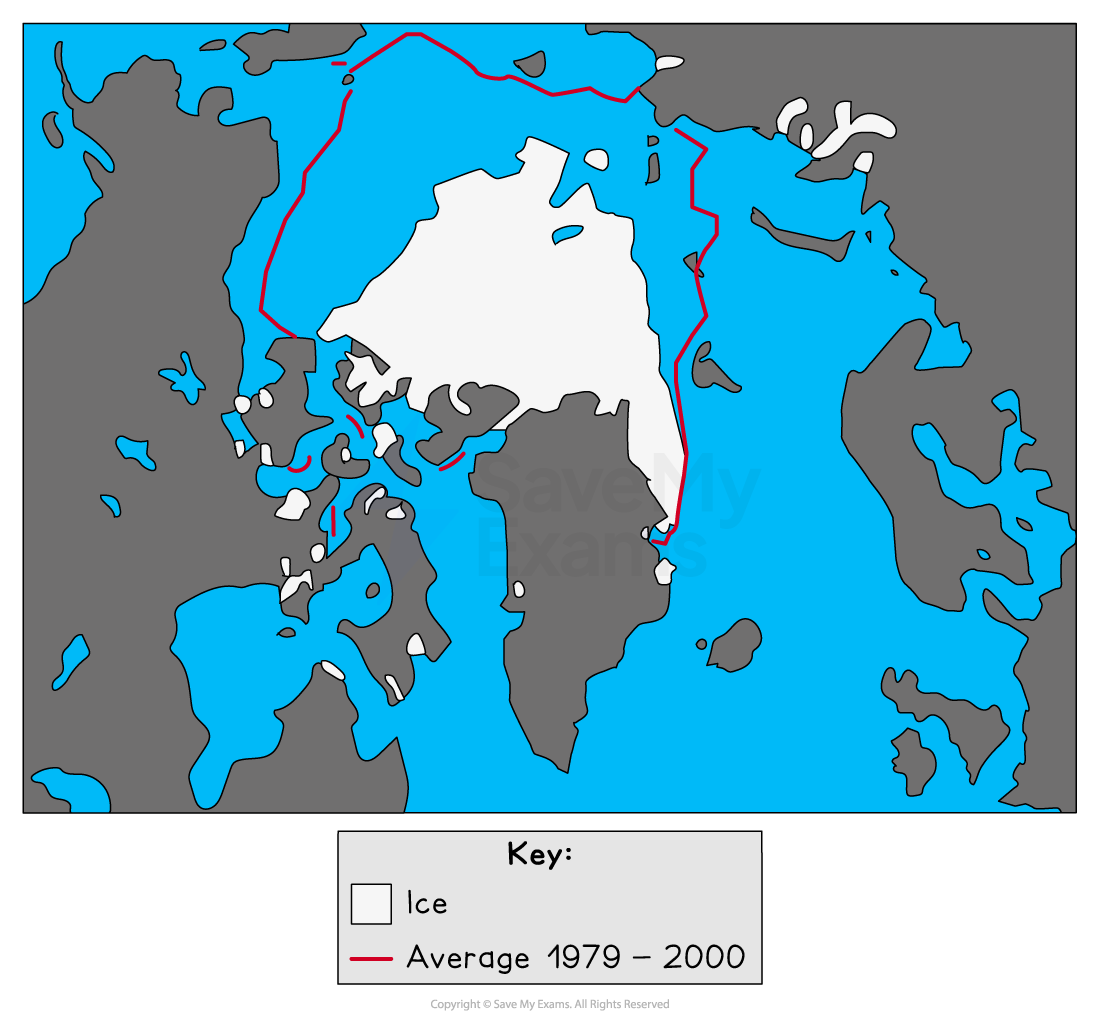
Suggest one reason why the Arctic is warming faster than the global average.
Was this exam question helpful?
Study Figure 1, which shows information about forests.
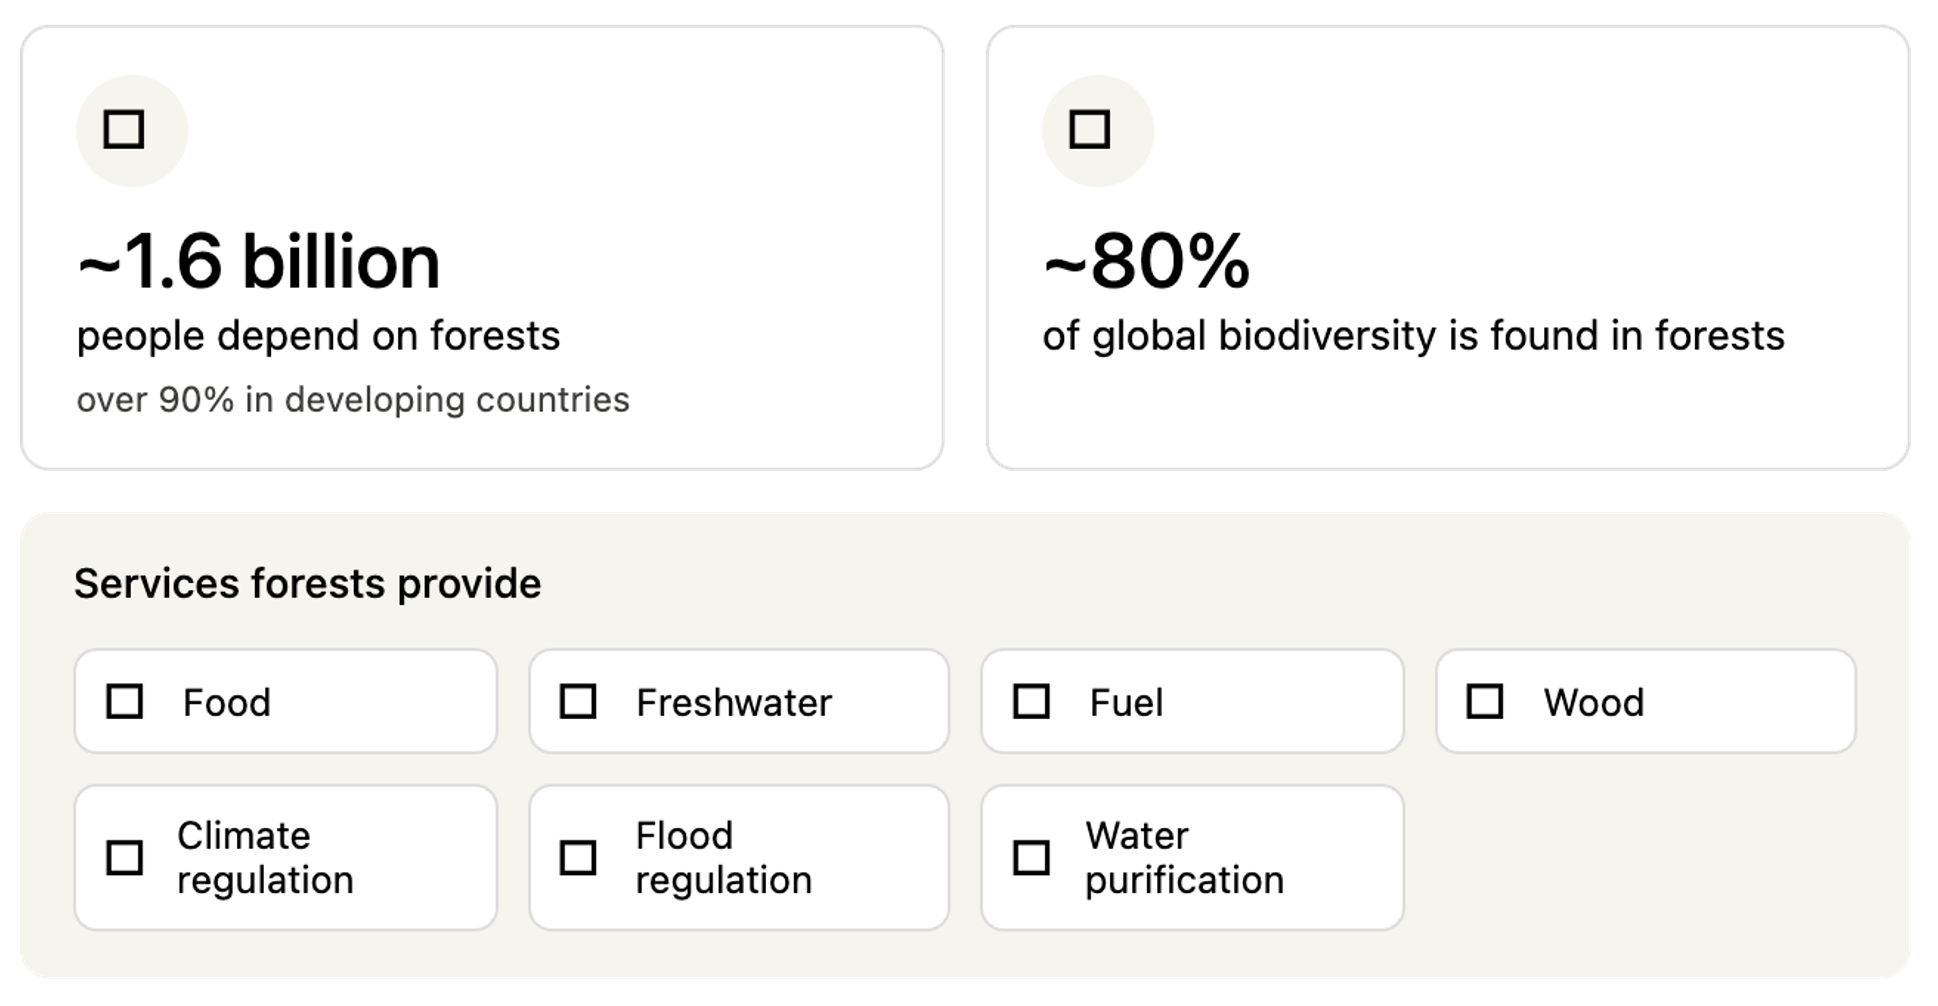
Suggest one reason why deforestation threatens human well-being.
Was this exam question helpful?
Study Figure 1, which shows a coral reef.
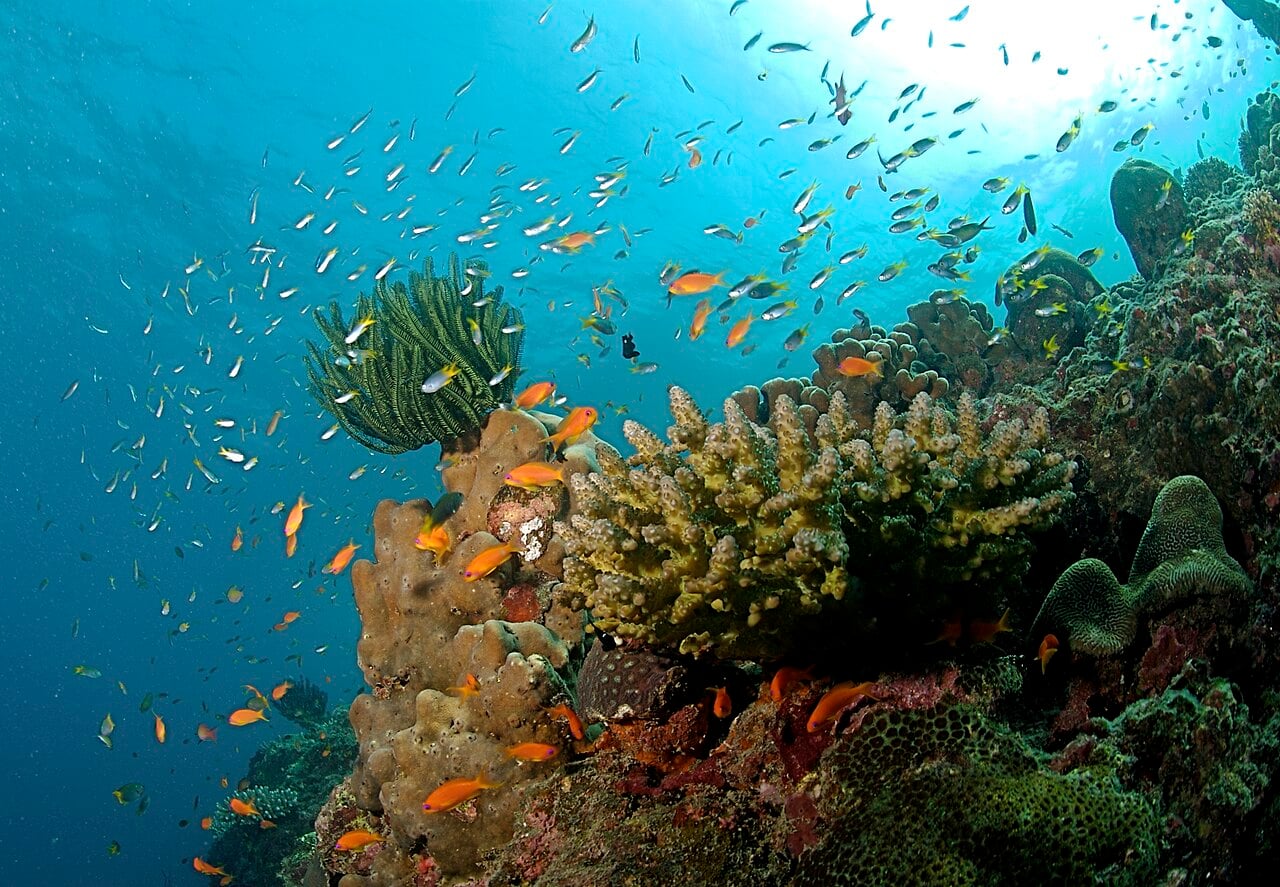
Suggest one reason why the decline of coral reefs threatens some coastal communities.
Was this exam question helpful?
Explain why changes in ocean health may threaten people's well-being.
Was this exam question helpful?
Explain why there are uncertainties about future levels of carbon release from peatlands and permafrost.
Was this exam question helpful?
Explain how deforestation affects both the carbon cycle and the water cycle.
Was this exam question helpful?
Explain how ocean acidification occurs and why it damages marine ecosystems.
Was this exam question helpful?
Explain how rising global temperatures affect the hydrological cycle.
Was this exam question helpful?
Explain why there is uncertainty about future levels of carbon emissions and global warming.
Was this exam question helpful?
Explain how mitigation and adaptation strategies can reduce the risks posed by climate change.
Was this exam question helpful?
Study Figure 4B.

Figure 4B
Diagram showing how climate warming impacts on the carbon cycle in a tundra environment
Assess the likely impacts of climate warming on the components of the carbon cycle shown in Figure 4B.
Was this exam question helpful?
Evaluate the view that changes to the carbon cycle pose more threats to people than changes to the water cycle.
Was this exam question helpful?
Evaluate the view that mitigation strategies are more important than adaptation strategies in addressing the risks posed by the degradation of the carbon cycle.
Was this exam question helpful?
Assess the impacts of climate change on the flows (processes) in the hydrological cycle.
Was this exam question helpful?
Assess the impact of increasing ocean acidification on people and marine ecosystems.
Was this exam question helpful?
The processes of the carbon cycle operate at longer and slower (geological) and shorter and faster (biological) timescales.
Evaluate the view that human activities are having a greater impact on shorter term biological processes than on longer term geological processes.
Was this exam question helpful?