Cumulative Frequency Graphs (DP IB Analysis & Approaches (AA)): Revision Note

Did this video help you?
Cumulative frequency graphs
What is cumulative frequency?
The cumulative frequency of x is the running total of the frequencies for the values that are less than or equal to x
For grouped data you use the upper boundary of a class interval to find the cumulative frequency of that class
What is a cumulative frequency graph?
A cumulative frequency graph is used with data that has been organised into a grouped frequency table
Some coordinates are plotted
The x-coordinates are the upper boundaries of the class intervals
For each x-coordinate, the y-coordinate is the cumulative frequency of that class interval
The coordinates are then joined together by hand using a smooth increasing curve
What are cumulative frequency graphs useful for?
They can be used to estimate statistical measures
Draw a horizontal line from the y-axis to the curve
For the median: draw the line at 50% of the total frequency
For the lower quartile: draw the line at 25% of the total frequency
For the upper quartile: draw the line at 75% of the total frequency
For the pth percentile: draw the line at p% of the total frequency
Draw a vertical line down from the curve to the x-axis
This x-value is the relevant statistical measure
They can used to estimate the number of values that are bigger/small than a given value
Draw a vertical line from the given value on the x-axis to the curve
Draw a horizontal line from the curve to the y-axis
This value is an estimate for how many values are less than or equal to the given value
To estimate the number that is greater than the value subtract this number from the total frequency
They can be used to estimate the interquartile range
format('truetype')%3Bfont-weight%3Anormal%3Bfont-style%3Anormal%3B%7D%3C%2Fstyle%3E%3C%2Fdefs%3E%3Ctext%20font-family%3D%22Times%20New%20Roman%22%20font-size%3D%2218%22%20text-anchor%3D%22middle%22%20x%3D%2215.5%22%20y%3D%2216%22%3EIQR%3C%2Ftext%3E%3Ctext%20font-family%3D%22math143f4d31b04031e49f5eb18baba%22%20font-size%3D%2216%22%20text-anchor%3D%22middle%22%20x%3D%2239.5%22%20y%3D%2216%22%3E%3D%3C%2Ftext%3E%3Ctext%20font-family%3D%22Times%20New%20Roman%22%20font-size%3D%2218%22%20font-style%3D%22italic%22%20text-anchor%3D%22middle%22%20x%3D%2254.5%22%20y%3D%2216%22%3EQ%3C%2Ftext%3E%3Ctext%20font-family%3D%22Times%20New%20Roman%22%20font-size%3D%2213%22%20text-anchor%3D%22middle%22%20x%3D%2265.5%22%20y%3D%2224%22%3E3%3C%2Ftext%3E%3Ctext%20font-family%3D%22math143f4d31b04031e49f5eb18baba%22%20font-size%3D%2216%22%20text-anchor%3D%22middle%22%20x%3D%2277.5%22%20y%3D%2216%22%3E%26%23x2212%3B%3C%2Ftext%3E%3Ctext%20font-family%3D%22Times%20New%20Roman%22%20font-size%3D%2218%22%20font-style%3D%22italic%22%20text-anchor%3D%22middle%22%20x%3D%2292.5%22%20y%3D%2216%22%3EQ%3C%2Ftext%3E%3Ctext%20font-family%3D%22Times%20New%20Roman%22%20font-size%3D%2213%22%20text-anchor%3D%22middle%22%20x%3D%22103.5%22%20y%3D%2224%22%3E1%3C%2Ftext%3E%3C%2Fsvg%3E)
They can be used to construct a box plot for grouped data
Worked Example
The cumulative frequency graph below shows the lengths in cm, ![]() , of 30 puppies in a training group.
, of 30 puppies in a training group.

a) Given that the interval ![]() was used when collecting data, find the frequency of this class.
was used when collecting data, find the frequency of this class.
Answer:

b) Use the graph to find an estimate for the interquartile range of the lengths.
Answer:

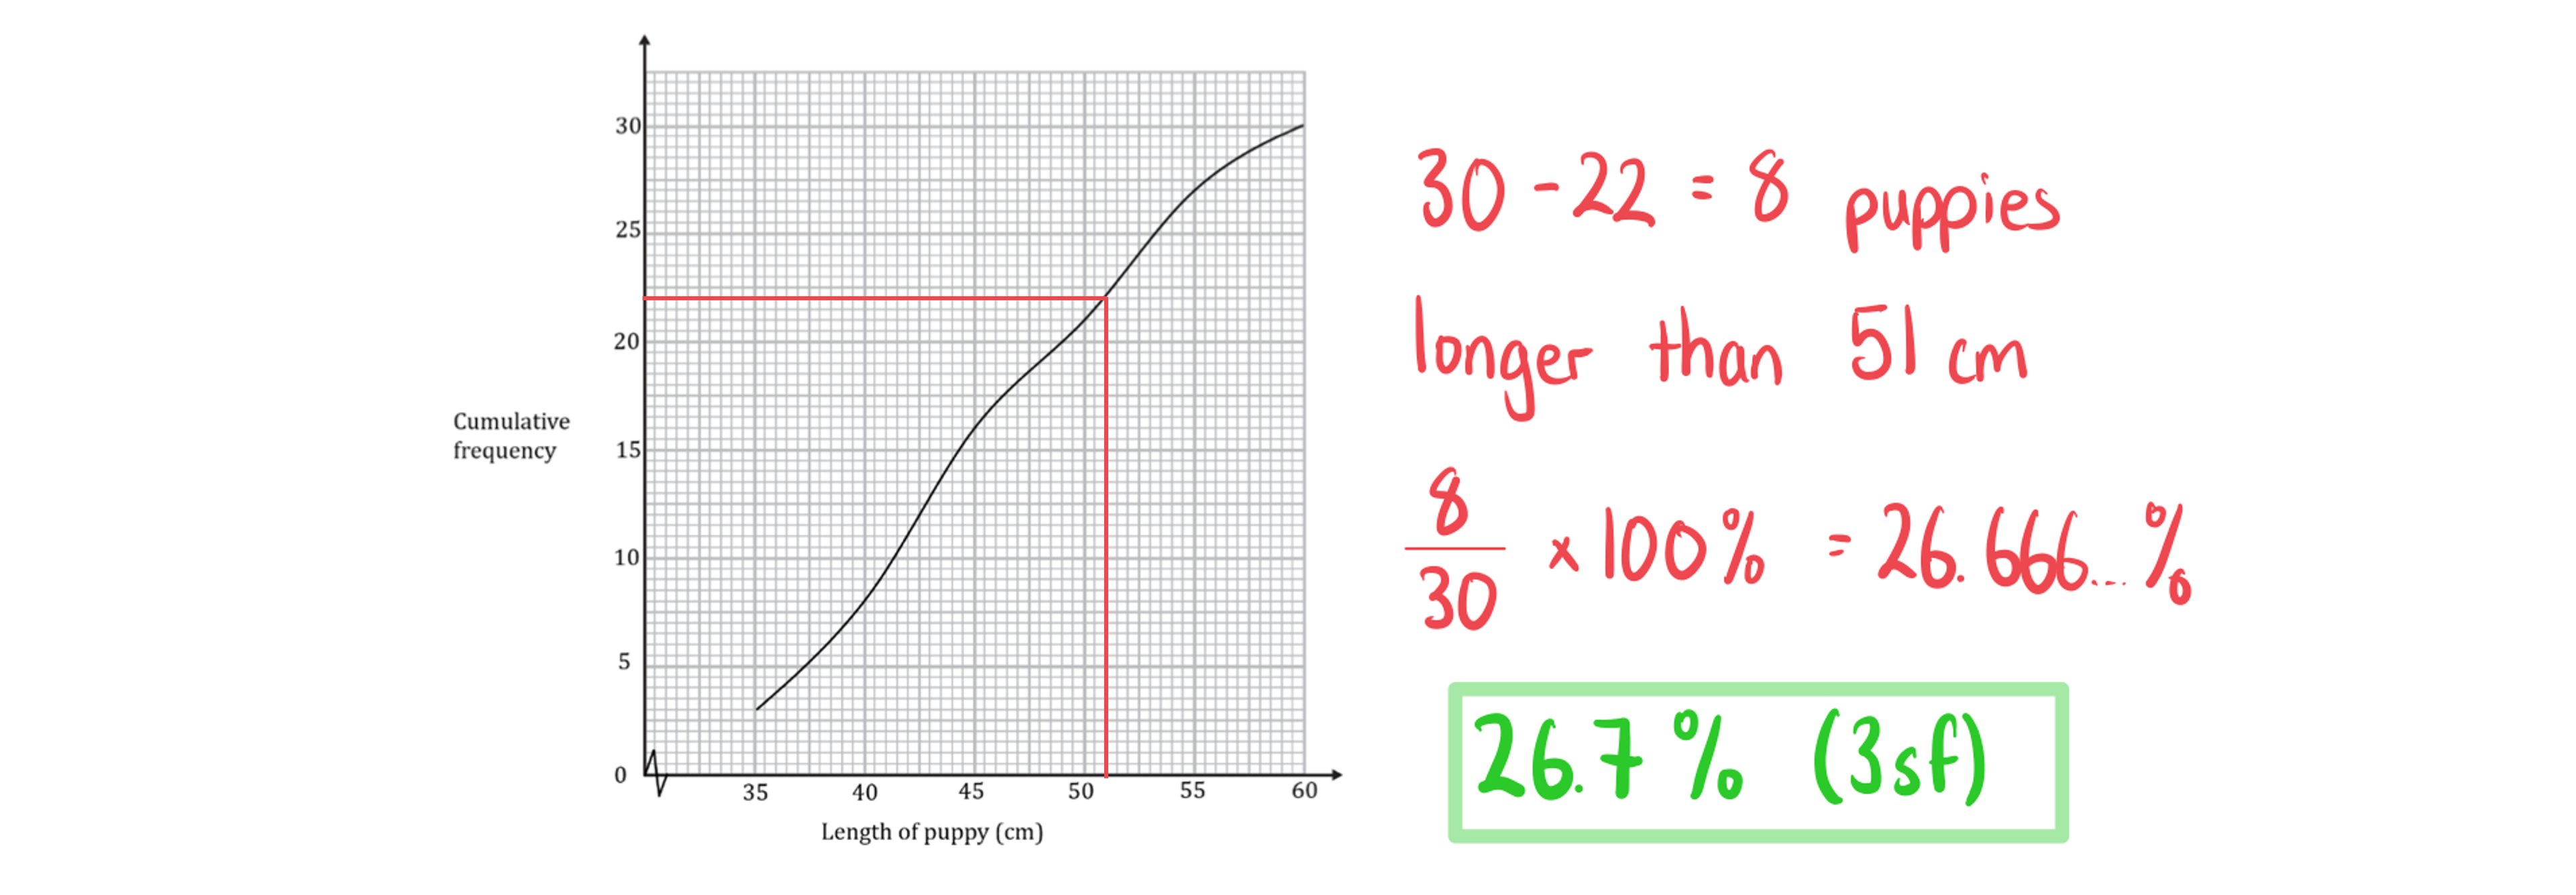
c) Estimate the percentage of puppies with length more than 51 cm.
Answer:

Unlock more, it's free!
Join the 100,000+ Students that ❤️ Save My Exams
the (exam) results speak for themselves:

Was this revision note helpful?
