Square Transformations (DP IB Analysis & Approaches (AA): HL): Revision Note

Square transformations
What is a square transformation?
For the graph the square transformation is
It transforms points on the graph
by keeping the -coordinates the same
but squaring their -coordinates
increasing them from a height of to a height of
Any points below the -axis (where is negative)
transform to being above the -axis
since is always positive
Examiner Tips and Tricks
The square transformation shares a similarity with the in that there are no parts below the -axis.
Points that have -coordinates of or 1 stay in the same position
How do I sketch a square transformation y = [f(x)]²?
To sketch a square transformation, you need to know
how key features on the original graph
transform to different key features on the graph of
In general
any points on with heights that satisfy
move further away from the -axis on
any points on with heights that satisfy
move closer to the the -axis on
where negative heights are reflected in the -axis then
increased if
or decreased if
More specifically
If has a -intercept at
has a -intercept at
If has an -intercept (root)at
has a root and minimum point at
If has a vertical asymptote at
has a vertical asymptote at
If has a local maximum at
has a local maximum at if
has a local minimum at if
If has a local minimum at
has a local minimum at if
has a local maximum at if
What happens to x-intercepts under a square transformation?
The square transformation affects -intercepts in different ways
If the graph touches the -axis via a turning point
the turning point becomes flatter / more bucket-like on
e.g. compare to
Small heights less than 1 around the turning point get smaller when squared (not bigger)
e.g. the point becomes (i.e. flattened)
If the graph of cuts the -axis
the -intercept turns into a smooth minimum point
e.g. compare to
Examiner Tips and Tricks
When sketching make it clear to the examiner that the curve touches smoothly at an -intercept (do not draw it as a sharp cusp, like )
Worked Example
The diagram below shows the graph of which has a local maximum at the point .
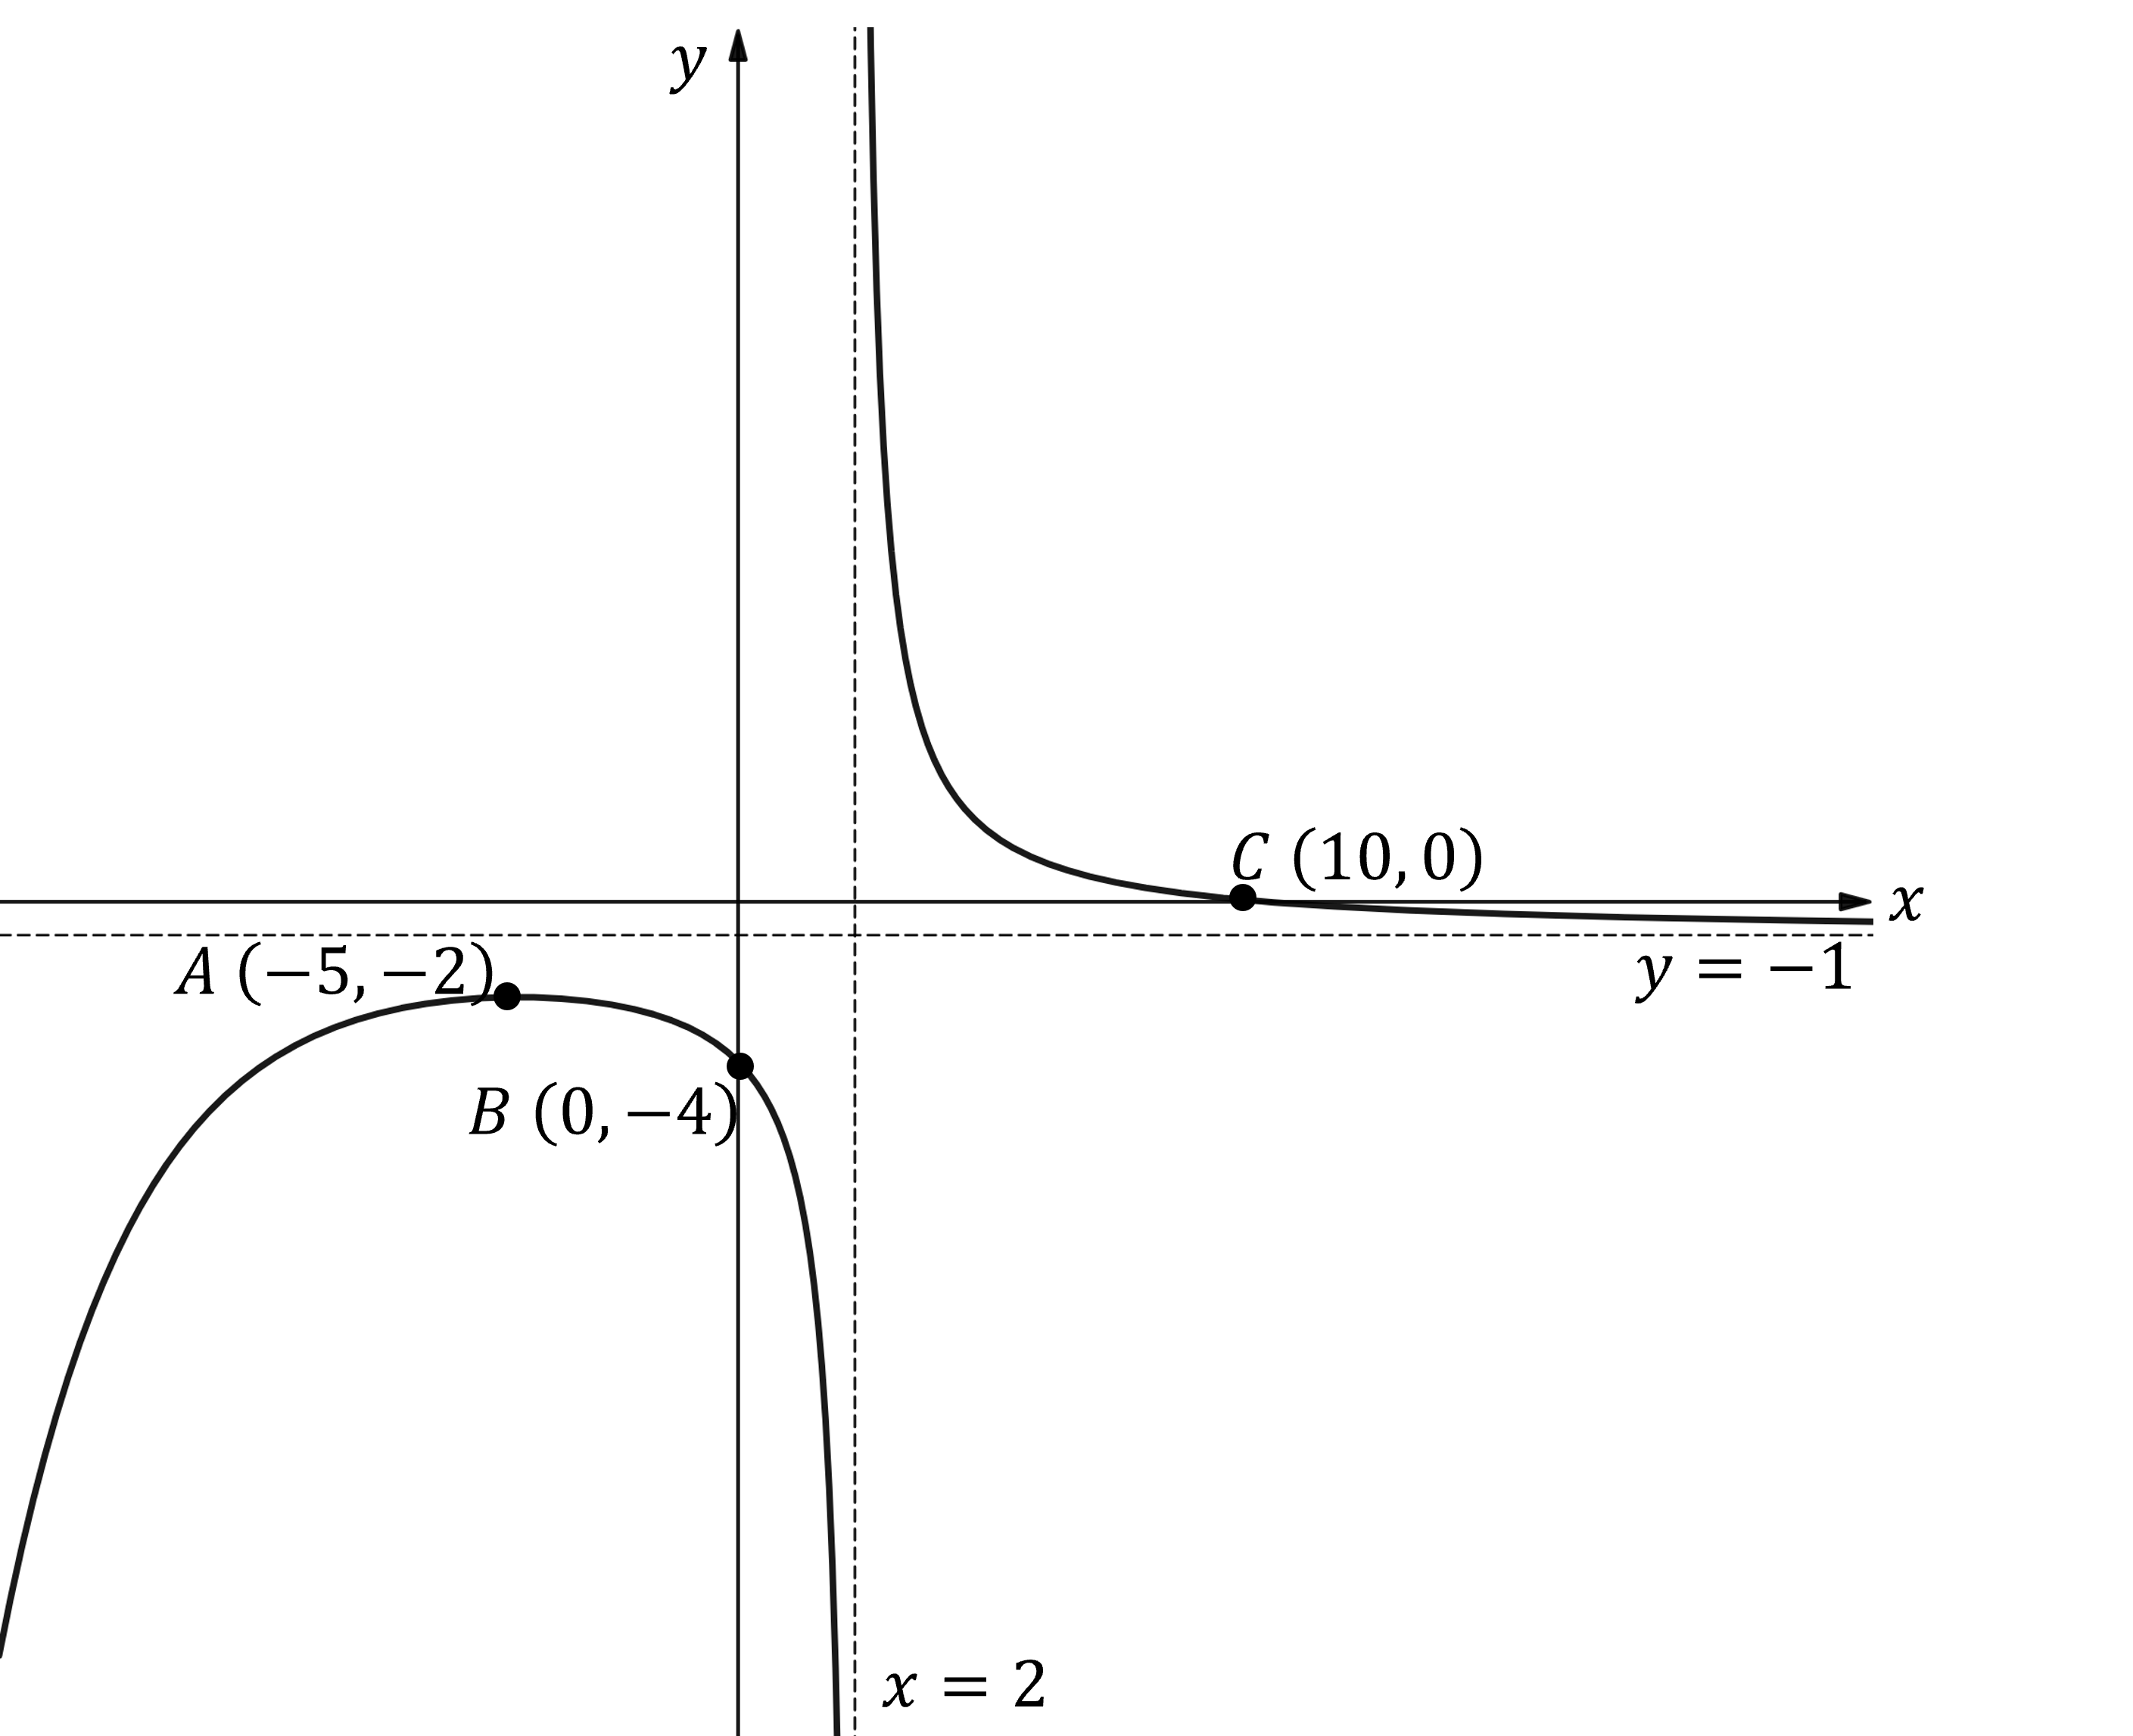
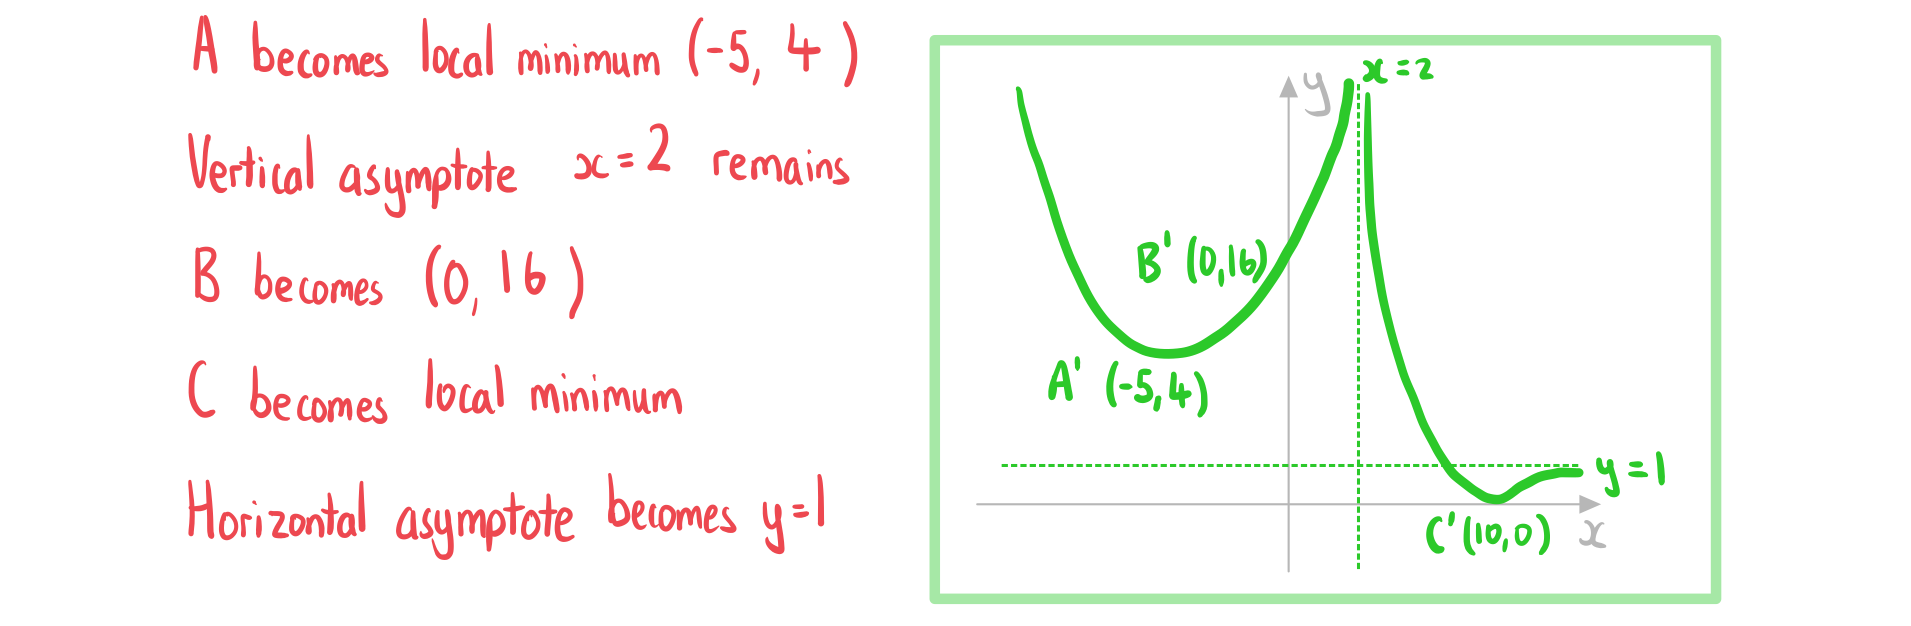
Sketch the graph of .
Answer:

Unlock more, it's free!
Join the 100,000+ Students that ❤️ Save My Exams
the (exam) results speak for themselves:

Was this revision note helpful?
Build on this topic