Modelling with Trigonometric Functions (DP IB Analysis & Approaches (AA): HL): Revision Note

Modelling with trigonometric functions
What can be modelled with trigonometric functions?
Anything that oscillates (fluctuates periodically) can be modelled using a trigonometric function
Normally some transformation of the sine or cosine function
Examples include:
is the depth of water at a shore t hours after midnight
is the temperature of a city d days after the 1st January
is vertical height above ground of a person t minutes after entering a Ferris wheel
Notice that the x-axis will not always contain an angle
In the examples above time would be on the x-axis
Depth of the water, temperature or vertical height would be on the y-axis
What are the parameters of trigonometric models?
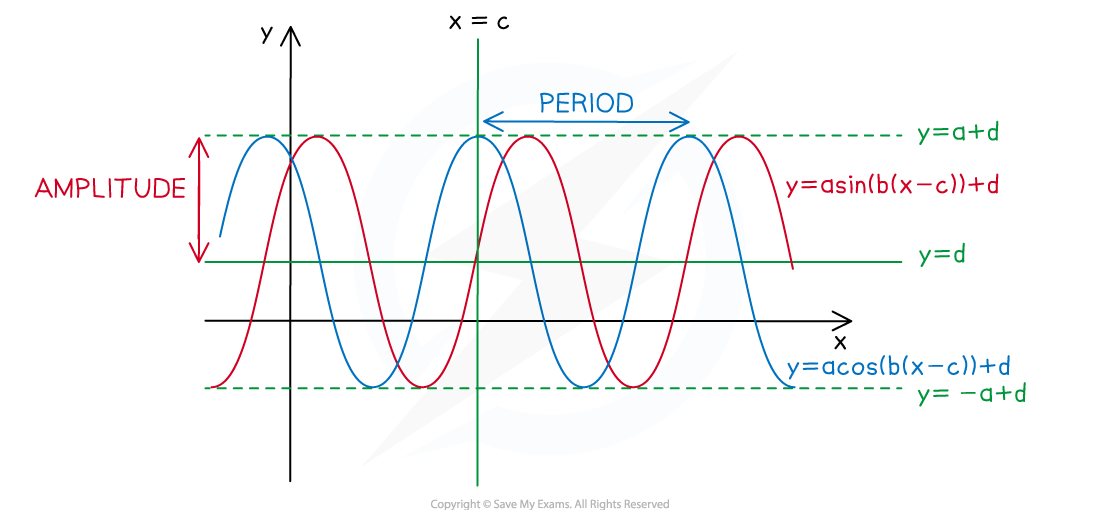
A trigonometric model could be of the form
The value of represents the amplitude of the function
The bigger the value of the bigger the range of values of the function
The value of determines the period of the function
Period
The smaller the value of the quicker the function repeats a cycle
The value of represents the horizontal shift
The value of represents the vertical shift
This is the principal axis
For example, if is the vertical height (in metres) above ground of a person minutes after entering a Ferris wheel
The highest point above ground is 21+20 = 42 m
The lowest point above ground is 21-20 = 1 m
The speed to complete one cycle is minutes
What are possible limitations of a trigonometric model?
The model assumes that the amplitude is the same for each cycle
In real-life this might not be the case
The function might get closer to the principal axis over time
The model assumes that the period is the same for each cycle
In real-life this might not be the case
The time to complete a cycle might change over time
Worked Example
The water depth, , in metres, at a port can be modelled by the function
where is the elapsed time, in hours, since midnight.
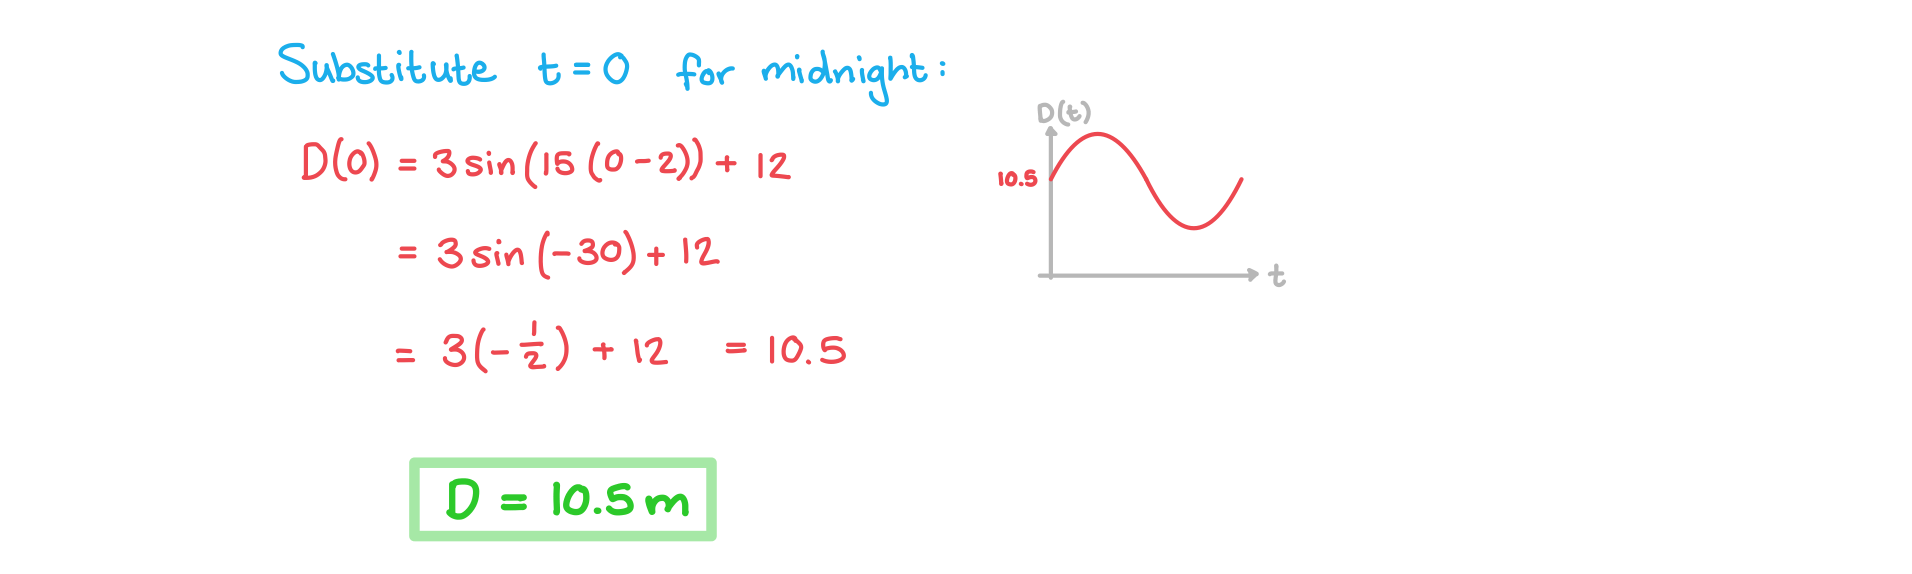
a) Write down the depth of the water at midnight.
Answer:
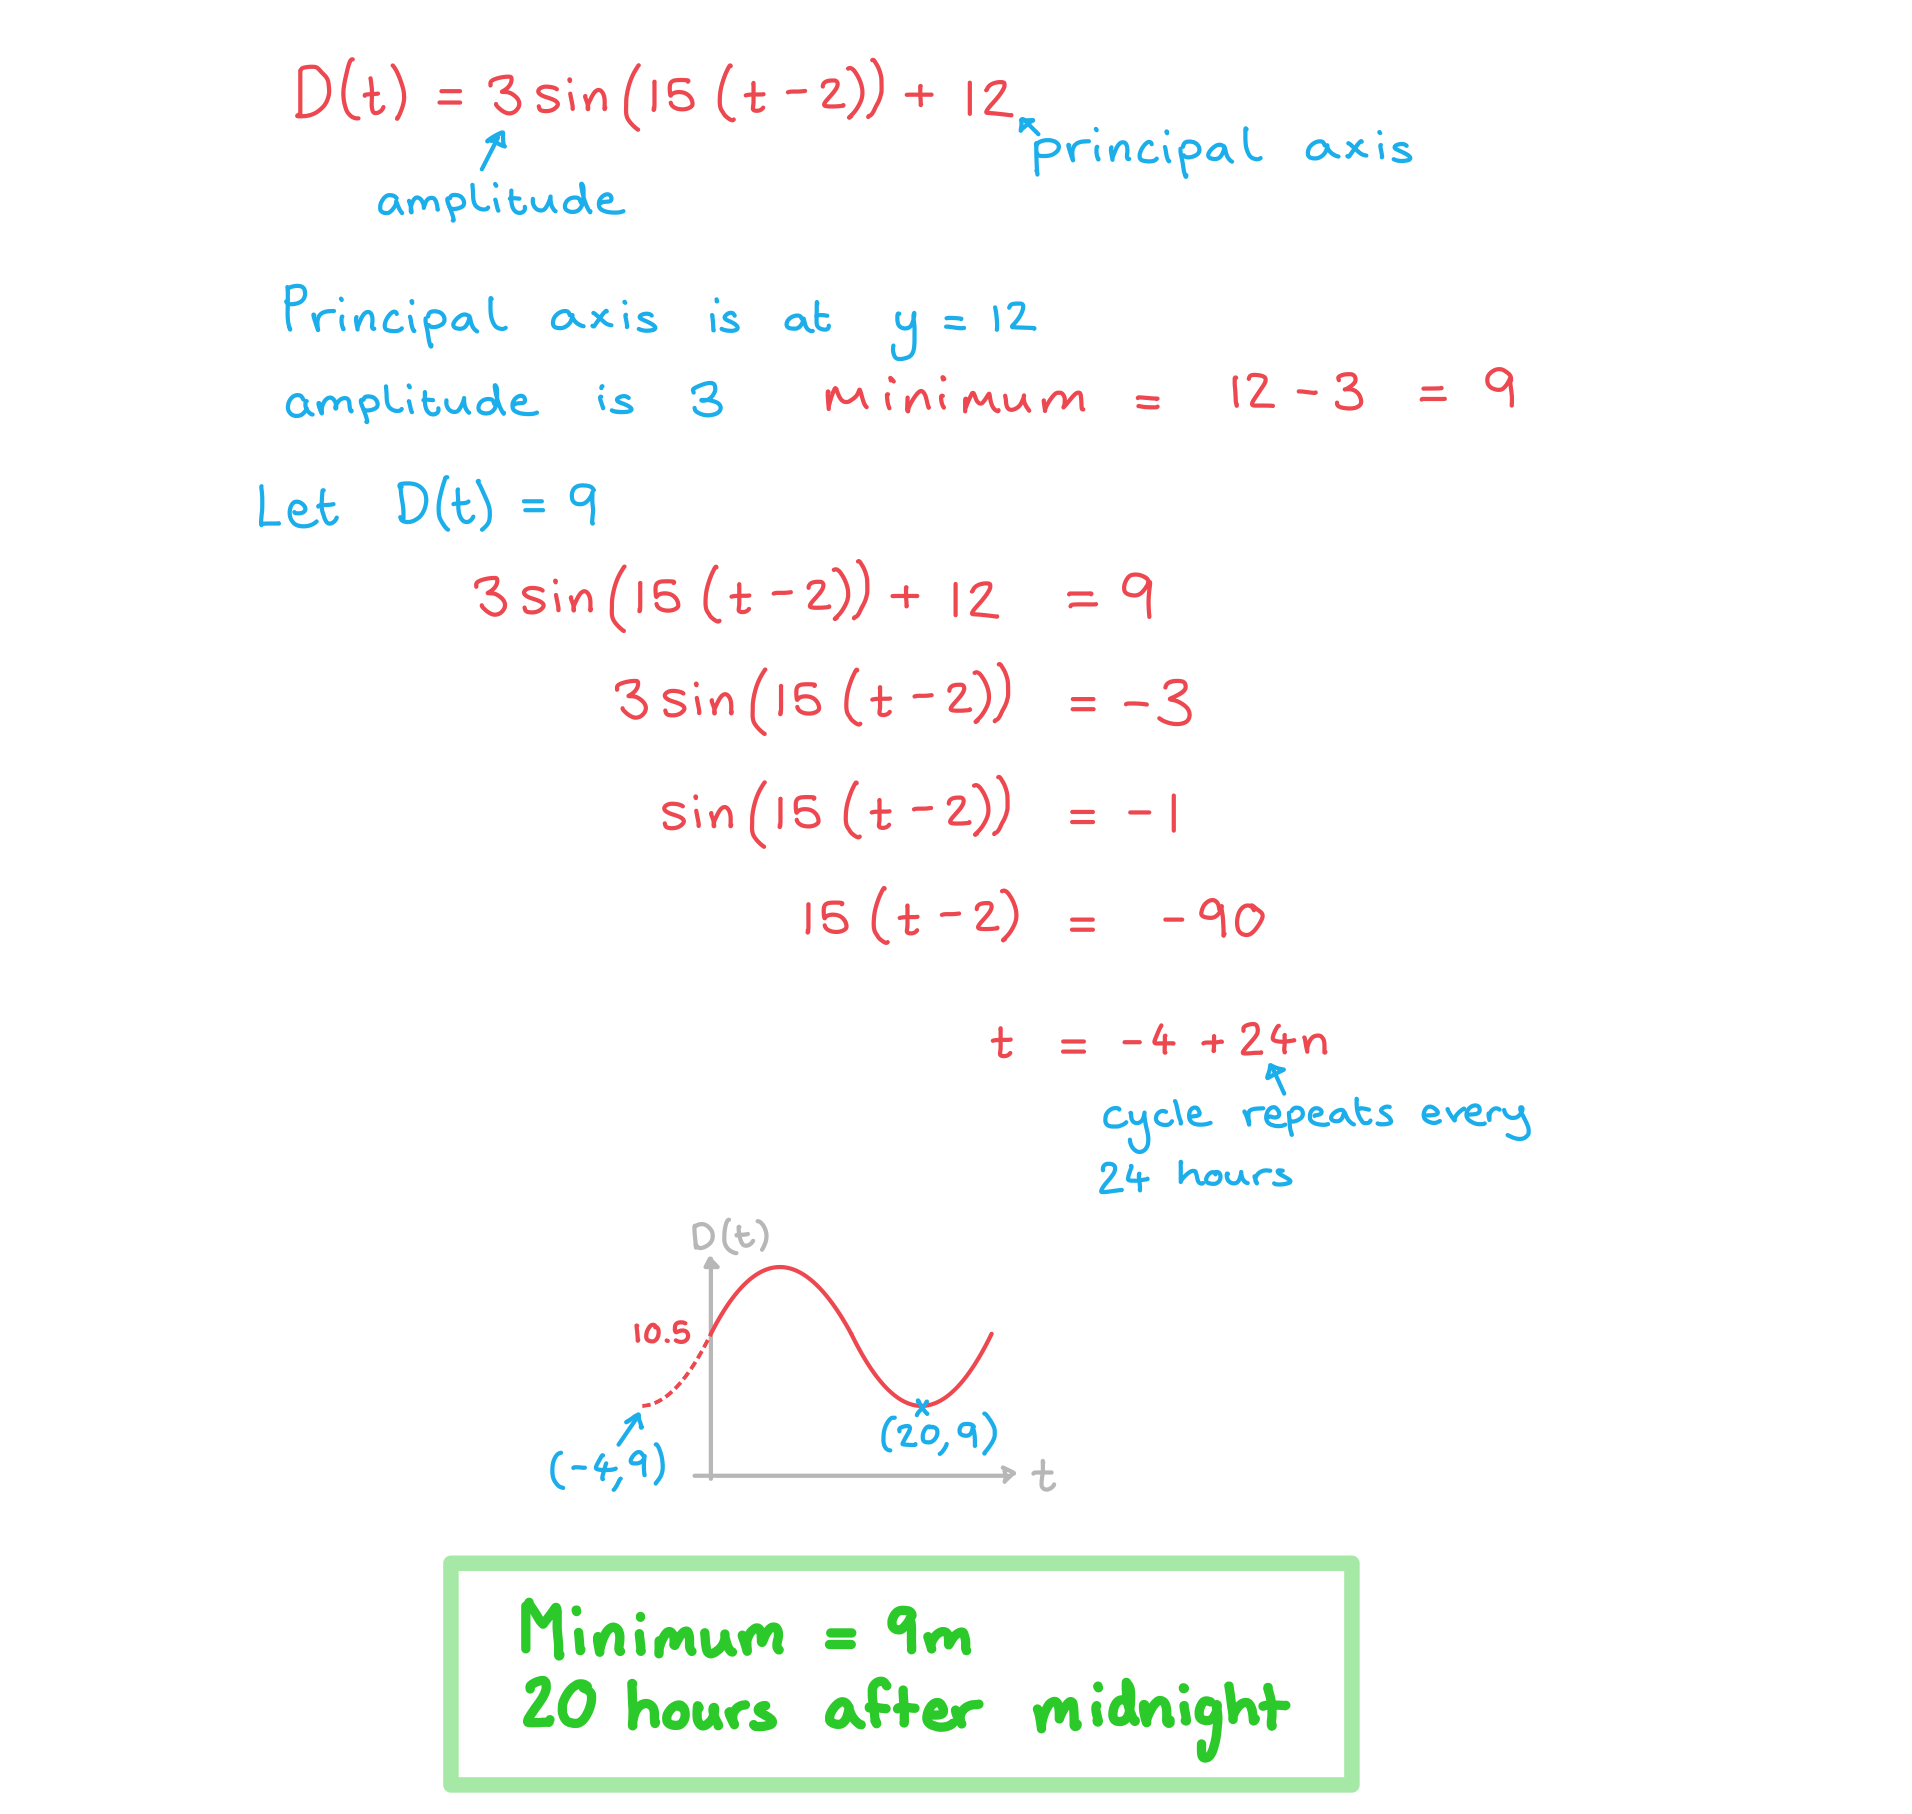
b) Find the minimum water depth and the number of hours after midnight that this depth occurs.
Answer:
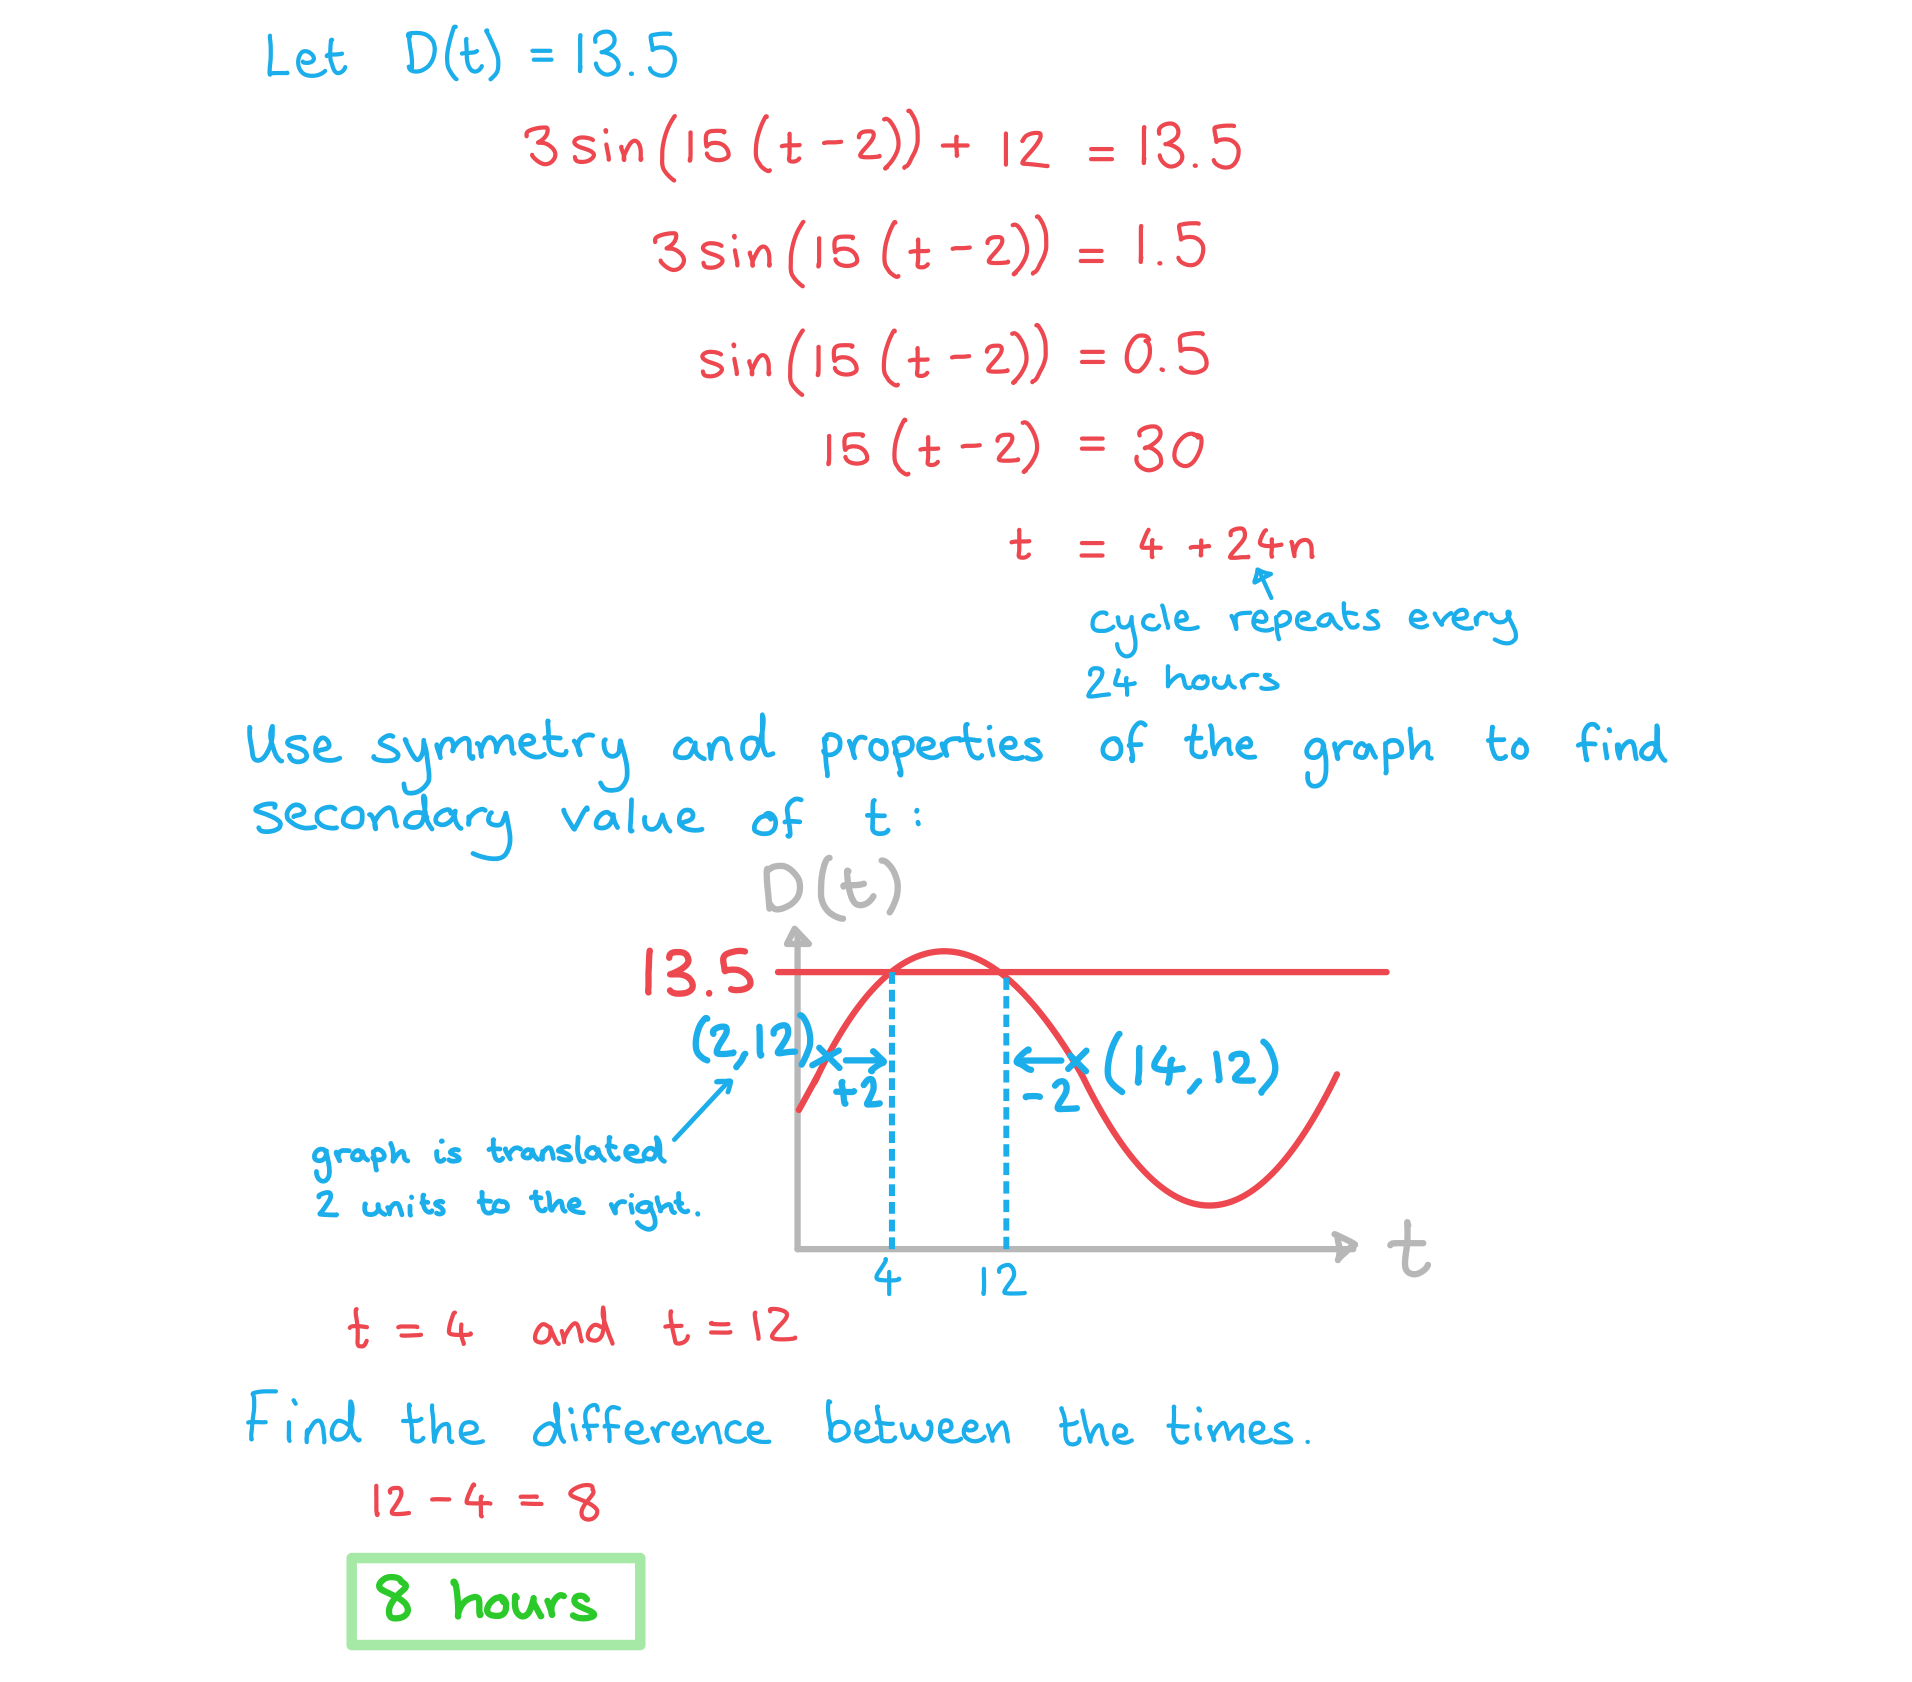
c) Calculate how long the water depth is at least 13.5 m each day.
Answer:

Unlock more, it's free!
Join the 100,000+ Students that ❤️ Save My Exams
the (exam) results speak for themselves:

Was this revision note helpful?
Build on this topic
